July 3, 2026
The Counterintuitive Reality of Gold in a Crisis
Most investors carry a mental model of gold that goes something like this: when the world gets dangerous, gold goes up. It is a neat, satisfying narrative. It is also dangerously incomplete. Understanding why gold is down during geopolitical crisis conditions requires a far more nuanced framework than the conventional safe-haven shorthand allows.
The deeper truth about gold as a protective asset is that its safe-haven properties operate across a fundamentally different timeframe than most investors assume. Understanding why gold sometimes falls hardest precisely when headlines suggest it should be surging is one of the most practically valuable insights any investor can develop. It reframes the asset entirely and, more importantly, it prevents the kind of panic-driven selling that destroys long-term wealth.
When big ASX news breaks, our subscribers know first
The Safe-Haven Paradox: Gold Falling When Fear Is Highest
Why the Conventional Logic Is Incomplete
The instinct to expect gold to rise during conflict or crisis is not entirely wrong. Over sufficiently long timeframes, it is well-supported by the historical record. The problem arises when that medium-to-long-term characteristic is incorrectly applied to a 24-hour or even 24-week timeframe.
When a crisis breaks, the immediate market response is not a calm, rational rotation into defensive assets. It is a scramble. Portfolios are stressed, margin calls emerge, and investors across every asset class need to raise cash quickly. In that environment, gold's greatest structural advantage — its extraordinary liquidity — becomes its greatest short-term vulnerability.
The gold safe-haven role is one of the most misunderstood concepts in investing. As a key insight: gold's safe-haven status operates on a medium-to-long-term timeframe. In the immediate aftermath of a crisis, gold can and frequently does decline before its protective characteristics reassert themselves. The only asset that is genuinely safe from one day to the next is cash, but over any meaningful investment horizon, cash is the guaranteed loser to inflation.
The "Gold Always Goes Up in a Crisis" Myth
The misconception has been reinforced by selective memory. Investors recall gold's multi-year bull markets during periods of sustained economic stress. They are less likely to remember the sharp early selloffs that preceded those gains. The narrative has been compressed and oversimplified into a single cause-and-effect shorthand that does not survive contact with actual market data.
The reality is more nuanced: gold's defensive properties are real, but they manifest over months and years, not hours and days. Recognising this distinction is the difference between being shaken out at the bottom of a correction and being positioned to benefit from the recovery that historically follows.
What Actually Drives Gold Lower During Geopolitical Turmoil
Three Macroeconomic Forces That Override Fear Premiums
When asking why gold is down during a geopolitical crisis, the answer almost always involves at least one, and frequently all three, of the following structural forces:
| Driver | Mechanism | Impact on Gold |
|---|---|---|
| Rising US Dollar | Energy shocks reinforce the dollar's reserve currency role | Makes gold more expensive for non-USD buyers; reduces global demand |
| Higher Real Yields | Elevated inflation delays rate cuts; Treasury yields rise | Non-yielding gold becomes less competitive versus interest-bearing assets |
| Liquidity Demand | Market volatility triggers cash-raising across all liquid assets | Gold is sold not from lost conviction, but to raise immediate cash |
Why an Oil Shock Is Particularly Damaging in the Short Term
An oil-driven crisis creates a specific macroeconomic sequence that is hostile to gold prices in the near term. Furthermore, this sequence compounds across multiple channels simultaneously:
- Crude oil price spikes feed directly into global inflation readings
- Elevated inflation signals to central banks that monetary policy must remain restrictive
- Tighter policy pushes real yields higher, which historically suppresses gold
- The US dollar strengthens as energy markets settle into dollar-denominated flows
- Dollar strength raises the local-currency cost of gold for buyers across Asia, the Middle East, and Europe, reducing demand from the world's largest physical gold-consuming regions
The Real Yield Mechanism Explained
Gold generates no income. This single fact defines its relationship with interest rates more than any other variable. When real yields on government bonds rise, the opportunity cost of holding gold increases proportionally. Consequently, an investor who can earn a genuine real return from US Treasuries has a rational reason to reduce gold exposure in the short term. This relationship has held across multiple historical cycles and is not unique to any single crisis environment. For a broader perspective on these dynamics, gold and bond dynamics deserve careful consideration by any long-term investor.
The Equity Market Factor That Most Investors Miss
Here is a dimension of gold's recent weakness that receives far less attention than it deserves. In the period from late March through to approximately mid-year, the S&P 500 posted gains of roughly 20%, driven largely by exceptional earnings in the artificial intelligence sector and elevated investor optimism around major technology listings. When equities are performing strongly and investor sentiment is positive, the perceived need for defensive allocations like gold diminishes significantly, even when geopolitical risks remain materially elevated.
The more provocative analytical question during this period may not be why gold fell, but why equities rose 20% against a backdrop of an active conflict, an oil shock, and ongoing inflationary pressures.
Historical Precedents That Reframe the Narrative
The 2008 Global Financial Crisis: Gold's Most Instructive Case Study
The most powerful historical parallel for understanding gold's current behaviour is not a distant or obscure event. When Lehman Brothers collapsed in September 2008, October of that year became one of gold's worst monthly performances in two decades. By almost any short-term metric, gold appeared to be failing in its designated role.
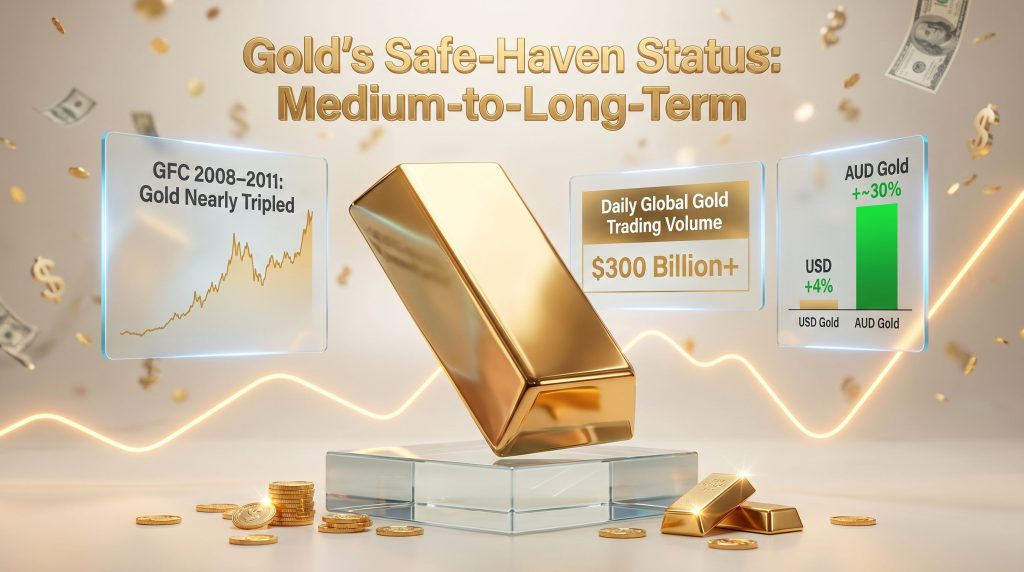
Yet over the three-year window that encompassed the full arc of the Global Financial Crisis, the gold price came close to tripling. The October 2008 selloff was not a structural failure of gold as an asset. It was a liquidity event, driven by the same mechanics at work in any acute crisis. Indeed, gold in recessions consistently demonstrates this pattern of short-term weakness followed by powerful medium-term recovery.
How a Crisis Typically Unfolds for Gold: A Step-by-Step Framework
- Geopolitical shock occurs — initial market volatility triggers broad-based asset selling across all liquid markets
- Liquidity demand spikes — gold, being among the most liquid assets on earth, is sold to raise cash quickly and at a fair price
- Macro forces dominate — dollar strength, rate expectations, and oil prices exert compounding downward pressure
- Sentiment resets — the FOMO-driven accumulation of the preceding rally gives way to apathy; speculative positioning unwinds
- Structural buyers re-enter — central banks, institutional allocators, and long-horizon investors begin accumulating at lower prices
- Gold resumes its trend — medium-term performance reflects underlying monetary and economic fundamentals rather than short-term sentiment
What the Worst Equity Drawdowns of the Past 50 Years Reveal
Across the worst quarterly pullbacks for equity markets over the last five decades, gold has been the strongest-performing major asset class on average. Cash preserves nominal value but surrenders purchasing power to inflation. Bonds have historically risen during equity selloffs, but by a smaller margin than gold. This pattern confirms that gold's safe-haven function is a medium-to-long-term structural characteristic, not a 24-hour hedge.
For further context on how gold volatility amid geopolitical crises has played out historically, the data consistently supports this longer-horizon interpretation.
Why Gold's Liquidity Makes It Vulnerable to Short-Term Selloffs
The Paradox of Being the Easiest Asset to Sell
Daily global gold trading volumes exceed USD $300 billion, a figure that dwarfs the combined turnover of all Dow Jones component stocks and surpasses even the US Treasury bill market. This extraordinary liquidity is one of gold's defining investment advantages. It is also the precise mechanism by which gold becomes a short-term casualty during crises.
When investors need to raise cash rapidly, they sell what they can sell at a fair price without moving the market against themselves. Private credit markets freeze. Unlisted property becomes effectively illiquid. Many alternative assets simply have no functional bid. Gold, by contrast, has a deep, global, around-the-clock market with tight spreads. It gets sold not because investors have lost faith in it, but because it is the easiest thing to sell.
| Asset Class | Crisis Liquidity | Typical Bid-Ask Spread | 24/7 Tradeable? |
|---|---|---|---|
| Physical Gold Bullion | Very High | Tight | Yes (OTC markets) |
| Gold ETFs | High (exchange hours only) | Tight | No |
| Listed Equities | Moderate to High | Variable | No |
| Private Credit | Very Low | Wide or Frozen | No |
| Unlisted Property | Very Low | Illiquid | No |
One of the most persistent misconceptions among retail investors is that gold is illiquid — an assumption often formed through familiarity with gold jewellery rather than bullion markets. In reality, adding a gold allocation almost certainly improves the liquidity profile of a diversified portfolio rather than diminishing it.
What Gold Actually Is: A Currency, Not a Commodity
Why the Commodity Framework Misrepresents Gold
Every other major commodity — whether oil, copper, wheat, or iron ore — is extracted for the purpose of consumption. Once it is used, it is gone. Gold is fundamentally different. Virtually all of the gold ever mined in human history remains in existence today, held by households, investors, institutions, or central banks. Nothing is consumed. Nothing disappears.
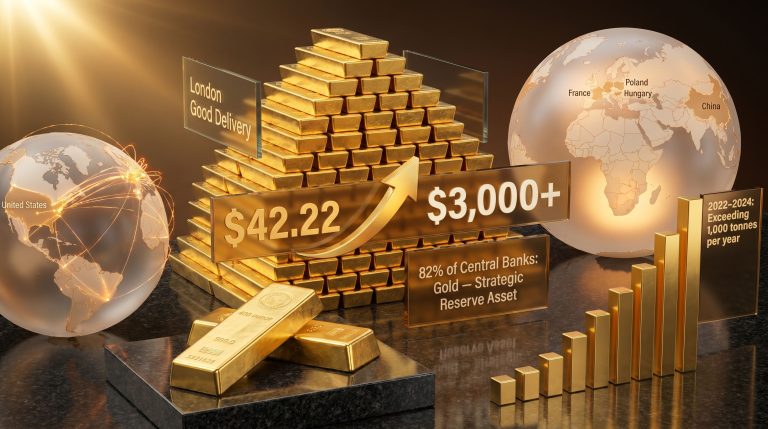
This characteristic places gold firmly in the category of monetary assets rather than commodities. Central banks globally hold approximately 35,000 tonnes of gold, representing nearly 20% of all gold ever mined, as a primary reserve asset. They do not hold it as an industrial input. They hold it because it functions as money. Indeed, central bank gold demand has been one of the most consistent structural forces underpinning the gold market over the past decade.
The Chemical and Sociological Foundations of 5,000 Years of Value
Gold's endurance as humanity's premier store of value is not arbitrary. Its physical and chemical properties provide a rational foundation:
- It does not rust, tarnish, or corrode under any natural conditions
- It is chemically homogeneous: one ounce of fine gold from Australia is physically identical to one ounce from Africa or South America
- It is essentially indestructible, meaning the stock accumulated over millennia persists
- Its density and beauty create an intrinsic sensory quality that other metals lack
Perhaps the most compelling evidence of gold's intrinsic suitability as a monetary asset is a sociological observation: independent civilisations across the ancient world, with no knowledge of each other's existence, all independently converged on gold as their primary symbol and store of wealth. This cross-cultural convergence is not a coincidence or social convention. It reflects the underlying physical properties of the metal itself.
Gold as Both Insurance and Growth Asset
| Portfolio Function | Conditions Where Gold Excels | Historical Example |
|---|---|---|
| Wealth Preservation | Recessions, equity bear markets, monetary debasement | GFC 2008-2011: gold price came close to tripling |
| Currency Hedge | AUD depreciation during economic downturns | 2008: USD gold +4%; AUD gold approximately +30% |
| Portfolio Liquidity | Crisis periods requiring rapid asset liquidation | Over $300 billion in daily global turnover |
| Inflation Protection | Sustained money supply expansion, fiscal deficits | 1970s: gold rose approximately 20x from $35 to ~$800/oz |
The next major ASX story will hit our subscribers first
The Long-Term Structural Drivers Shaping Gold's Trajectory
Four Forces Across a 20 to 40 Year Investment Horizon
1. Central Bank Accumulation
Central banks globally have been net buyers of gold for approximately 15 years, a structural shift from the preceding two decades when they were consistent net sellers. Emerging market central banks still hold disproportionately small gold reserves relative to their total reserve portfolios, and a measurable pivot away from US Treasuries and euro-denominated debt toward gold is underway. Annual central bank purchases are running at approximately 1,000 tonnes per year, providing a durable structural bid beneath the market.
2. Emerging Market Household Demand
In China, India, Southeast Asia, and the Middle East, gold is not an alternative asset class considered after equities and bonds. It is the primary savings and wealth preservation vehicle. Rising incomes across these regions correlate strongly and historically with increased demand for gold bars, coins, and jewellery. This demand base is structural and demographic in nature, not speculative.
3. Monetary Expansion and Fiscal Deficits
Persistent government deficits require ongoing money creation to service and refinance debt. All finite real assets benefit from monetary debasement over time, and gold is among the primary institutional beneficiaries of this dynamic. This is not a feature unique to any single country but a characteristic of the current global fiscal architecture.
4. Equity Valuations and Bond Market Dynamics
The S&P 500 is currently trading at over 40 times cyclically adjusted earnings, a historically elevated level by most valuation frameworks. Government bonds face structural headwinds from rising debt levels and persistent fiscal deficits. As bonds progressively lose their traditional negative correlation with equities, gold's role as the portfolio hedge of last resort strengthens by default.
Why Gold Fell Between 1980 and 2000: Context for Today
The Conditions That Created a 20-Year Bear Market
Gold's two-decade bear market from 1980 to 2000 is frequently cited as evidence against its long-term value proposition. The context, however, is essential. Gold entered 1980 having already delivered a roughly 20-fold return over the preceding decade, rising from approximately $35 to around $800 per ounce. That starting valuation was stretched by any measure.
Simultaneously, equities were historically cheap at approximately 10 times earnings, representing extraordinary forward value. The Federal Reserve's aggressive rate hiking cycle crushed inflation and created a two-decade tailwind for financial assets. By 2000, the script had fully reversed: equities were expensive and gold had been deeply undervalued relative to financial assets for years.
Where Gold Stands Today Relative to That Historical Cycle
Gold in 2026 is no longer as undervalued as it was at the 2000 trough. That extreme relative cheapness has normalised. However, gold is not expensive by historical standards. Average portfolio allocations to gold remain at approximately 2% of total assets across most institutional and retail studies, leaving substantial room for demand growth without requiring extreme price appreciation. As one practitioner in the Australian precious metals market has observed, at a 2% average allocation, there is roughly $98 of potential buying power for every $2 of existing exposure.
How to Think About Gold in a Portfolio
The Portfolio Construction Case
Framework: Adding a meaningful gold allocation to a diversified portfolio of equities, property, and bonds has historically improved overall liquidity, reduced credit risk exposure, and enhanced drawdown resilience, without meaningfully sacrificing long-term compound returns. Investment modelling in the Australian market generally supports allocations of up to 25%, with even a 10% allocation producing measurable improvements in portfolio robustness.
Gold's correlation profile with other major asset classes makes it genuinely diversifying rather than theoretically so. It tends to perform best precisely when equities perform worst. Property and equities share a common dependency on economic growth. Gold does not. As bonds progressively lose their traditional defensive characteristics under fiscal pressure, gold is filling that protective gap in diversified portfolios.
The AUD Currency Dimension
For Australian investors, unhedged gold exposure carries a structural advantage that is easily overlooked. The Australian dollar is a commodity-linked currency that typically depreciates during global recessions and risk-off market events. Unhedged AUD gold exposure means returns are amplified in precisely the periods when protection is most needed.
The 2008 calendar year provides the clearest illustration: USD gold returned approximately 4% for the full year, a modest result. AUD gold, by contrast, returned approximately 30%, purely because the Australian dollar fell sharply against the US dollar as global risk appetite collapsed. The currency leg is not a drag on performance. In the periods that matter most, it can be the most powerful component of the return.
Physical Bullion vs. ETFs vs. CFDs: A Structured Comparison
Choosing the right access method matters considerably over the long term. Understanding the differences between physical gold vs ETFs is an important step before committing to any particular structure.
| Access Method | Ownership of Underlying | Trading Hours | Fee Structure | Liquidity |
|---|---|---|---|---|
| Physical Bullion | Yes, direct ownership | 24/7 via OTC markets | Storage cost (fixed, does not scale with price) | Very High |
| Gold ETF | No, price exposure only | Exchange hours only | Management fee (scales upward as price rises) | High |
| CFD | No, synthetic exposure | Varies by provider | Spread plus overnight funding costs | High |
A key structural distinction worth understanding: ETF management fees are charged as a percentage of assets under management. If gold prices rise significantly over a long holding period, the absolute dollar cost of the management fee rises proportionally. Physical bullion storage costs are generally fixed, meaning they do not scale with price appreciation. Over a long investment horizon with meaningful assumed returns, this distinction can compound into a material difference in net returns.
Frequently Asked Questions: Why Is Gold Down During a Geopolitical Crisis?
Why doesn't gold always rise when there is conflict or war?
Gold's safe-haven properties are genuine but operate over medium-to-long timeframes. In the immediate aftermath of a crisis, liquidity demands, US dollar strength, and rising real yields can all suppress the price, even as the underlying geopolitical risk remains elevated. The mechanism is well-documented historically and does not represent a structural failure of gold's investment case.
What is the relationship between interest rates and the gold price?
Gold generates no income. When real yields on government bonds rise, the opportunity cost of holding gold increases. Investors can earn a genuine real return from bonds, making gold comparatively less attractive in the short term. This relationship has held across multiple historical rate cycles.
How long does it typically take for gold to recover after an initial crisis selloff?
Recovery timelines vary considerably depending on the nature and duration of the underlying economic stress. The GFC provides a useful benchmark: after gold's worst monthly performance in October 2008, it went on to nearly triple over the subsequent three years. The recovery is driven by the persistence and severity of the macro conditions, not by the initial crisis event itself.
Does gold's current weakness suggest it has lost its safe-haven role?
No. The current configuration of oil-driven inflation, dollar strength, and elevated real yields creates a specific macroeconomic environment that is historically hostile to gold in the short term. This pattern, as Morningstar's analysis of falling gold prices illustrates, has clear precedent across multiple crises. It reflects a temporary set of macro conditions rather than a structural change in gold's role as a long-term store of value.
How much gold should an investor hold?
There is no universally correct answer. Investment modelling across diversified portfolios generally supports allocations in the range of 5% to 25%, depending on individual risk tolerance, existing portfolio composition, time horizon, and the role gold is intended to play. Even a 10% allocation has historically improved portfolio resilience without meaningfully reducing long-term compound returns. This is general information only and does not constitute personal financial advice.
Is Bitcoin a valid substitute for gold as a safe-haven asset?
The two assets share some conceptual framing but differ fundamentally in physical existence, trading history, institutional adoption, and behaviour during acute market stress. Bitcoin's purported use case as a payments medium or alternative monetary system has not materialised in practice. Most holders accumulate it as a speculative return vehicle denominated in fiat currency, which is a legitimate investment approach but a categorically different proposition from gold's 5,000-year role as a monetary asset. Early Bitcoin return data cited in promotional contexts often reflects period-specific gains when the asset had a market capitalisation measurable in thousands of dollars — figures that carry limited relevance to institutional-scale analysis.
Key Takeaways: Reframing Gold's Safe-Haven Role
- Gold's safe-haven function is time-frame dependent: it is a medium-to-long-term protective asset, not a 24-hour crisis hedge
- Short-term price declines during crises are driven by liquidity demands, dollar strength, and real yield dynamics, not a failure of gold's fundamental characteristics
- The GFC precedent remains the most instructive historical parallel: gold fell sharply in October 2008 before nearly tripling over the subsequent three years
- Gold's extraordinary daily liquidity exceeding $300 billion makes it paradoxically vulnerable to short-term selloffs because it can be sold efficiently when other assets cannot
- For Australian investors, unhedged AUD gold exposure may amplify returns during the periods when protection is most valuable, due to the AUD's commodity-currency behaviour during global downturns
- Long-term structural tailwinds, including central bank accumulation at roughly 1,000 tonnes per year, emerging market household demand, monetary expansion, and historically elevated equity valuations, remain intact regardless of short-term price volatility
- At average portfolio allocations of approximately 2%, gold remains meaningfully underowned relative to its historical role, suggesting structural demand growth does not require extreme price assumptions to materialise
This article is intended for educational and informational purposes only. It does not constitute financial advice and does not take into account your personal financial circumstances. Before making any investment decisions, you should consider your own objectives and risk tolerance and speak with a qualified financial professional. Past performance of any asset class is not a reliable indicator of future performance.
Want to Know When the Next Major ASX Mineral Discovery Hits the Market?
Discovery Alert's proprietary Discovery IQ model scans ASX announcements in real time, delivering instant notifications on significant mineral discoveries and turning complex data into clear, actionable insights for investors at every experience level — explore historic discoveries and their exceptional returns to understand what early positioning can mean, then begin your 14-day free trial at Discovery Alert to secure your market-leading edge.