July 21, 2026

The Royalty Model: A Smarter Architecture for Capturing Gold's Structural Upside
Investor sentiment toward gold has always been reactive, surging when fear spikes and retreating when confidence returns. But that reactive framing misses the deeper, more durable forces reshaping the precious metals market in 2026. The real story is not about short-term price swings or geopolitical headlines. It is about the architecture of money itself, the slow erosion of purchasing power, and which investment structures are genuinely built to capture compound, inflation-protected returns as gold price new highs and Gold Royalty continue to redefine the market's ceiling.
When big ASX news breaks, our subscribers know first
The Monetary Forces Underneath Gold's Record-Breaking Trajectory
Real Inflation vs. Reported Inflation: The Hidden Driver
Official consumer price indices have consistently reported inflation in the two to three percent range throughout the mid-2020s. However, the lived economic experience for most households and businesses has looked nothing like those figures. Energy costs, housing, food, insurance, and services have compounded in ways that bear little resemblance to headline statistics. When the inflation that people actually experience in their daily lives runs well ahead of what statistical agencies report, the implications for monetary policy are profound.
Real interest rates, which are calculated by subtracting actual inflation from nominal rates, remain deeply negative under this lens. Furthermore, deeply negative real interest rates have historically been one of the most reliable preconditions for sustained gold price appreciation. This is not a speculative position. It is a structural relationship that has held across multiple decades and monetary regimes.
When actual inflation outpaces reported figures, gold's role as a monetary hedge becomes structurally reinforced rather than cyclically driven. The debasement trade that gold represents has been operative for over fifty years and shows no signs of reversing under current global monetary conditions.
Global Money Supply and the Compounding Effect on Gold Valuations
Central banks worldwide have expanded their balance sheets at historically unprecedented rates since 2020. This expansion of the monetary base does not disappear from the system simply because rates rise modestly. The stock of money that has been created remains in circulation, searching for stores of value that cannot be debased by further issuance. Gold, with its finite supply and zero counterparty risk, sits at the apex of that category.
The Federal Reserve's capacity to meaningfully raise real interest rates is structurally constrained by the scale of government debt relative to tax revenues. Debt servicing costs at current debt levels make sustained high nominal rates fiscally untenable, which means that even if nominal rates stay elevated, real rates are likely to remain negative for an extended period. This fiscal arithmetic is a powerful tailwind for gold that operates independently of any single geopolitical event.
Gold Price Milestones and the 2026 Market Landscape
Gold's price trajectory through 2026 has been remarkable by any historical measure. The gold price record highs achieved early in the year have since seen prices pull back during periods of acute geopolitical stress, consistent with a well-documented but often misunderstood market dynamic.
| Metric | Value |
|---|---|
| All-Time High (January 2026) | $5,608.35 USD/oz |
| Current Spot Price (July 2, 2026) | ~$4,059 to $4,126 USD/oz |
| Year-Over-Year Gain | approximately 60% |
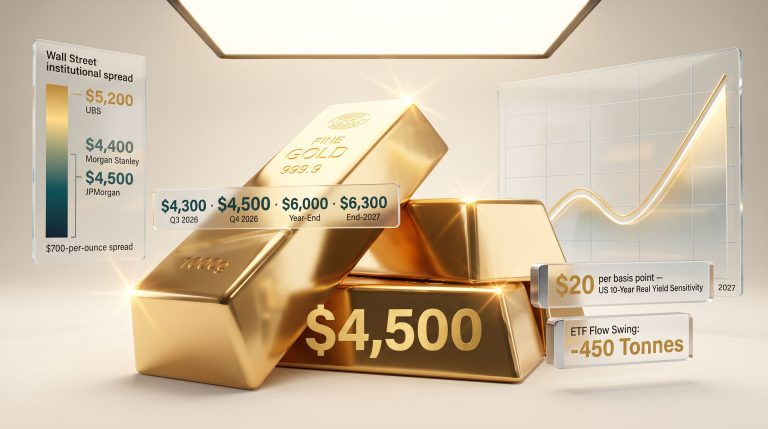
| Goldman Sachs 2026 Base Target | $4,900/oz |
| Goldman Sachs 2026 Bull Target | $5,400/oz |
| Consensus Analyst Target (2026) | $4,700/oz |
Why Pullbacks Are Mechanical, Not Fundamental
In acute risk-off environments, gold's high liquidity makes it one of the first assets investors sell to cover losses in other parts of their portfolios. This is a mechanical response driven by margin calls and position liquidation rather than any fundamental deterioration in gold's investment case. Historically, these liquidity-driven selldowns have consistently preceded strong recoveries once the triggering conditions stabilise.
The current consolidation phase, amplified by ongoing geopolitical tensions in the Middle East, fits this pattern precisely. Investors treating the pullback as evidence of a structural trend reversal may be misreading a cyclical, liquidity-driven event as something more permanent.
In periods of acute market stress, gold gets sold not because its fundamentals have changed, but because its liquidity makes it easy to sell. This distinction is critical for investors assessing whether current prices represent risk or opportunity.
Understanding the Gold Royalty Model and Why It Matters at $4,000+ Gold
How Royalty Structures Actually Work
Gold royalty companies occupy a structurally distinct position within the mining investment universe. Rather than operating mines or bearing geological and operational risk, royalty companies provide capital to developers, explorers, and operators who need financing to build, expand, or optimise their operations. In return, the royalty company receives a perpetual, top-line royalty entitling it to a fixed percentage of the gross revenue generated by that property once it enters production.
Several features of this structure are worth understanding in detail:
- Royalties are calculated on gross revenue, not net profit, meaning rising operating costs at the mine site have zero impact on the royalty holder's return
- The royalty is perpetual and attached to the property, not the operator, so ownership changes at the mine level do not affect the royalty holder's entitlement
- Any exploration or expansion activity undertaken by the operator on the royalty-encumbered property creates additional production upside that accrues to the royalty holder at no additional cost
- The royalty holder's capital outlay is fixed at the time of the original agreement, meaning all subsequent upside is effectively free optionality
The Critical Distinction: Top-Line vs. Bottom-Line Exposure
This is where the royalty model's inflation-protection credentials become genuinely compelling. Mining operations face relentless cost inflation across labour, energy, consumables, and capital equipment. For an operating mining company, rising costs directly compress margins. For a royalty holder, however, those same cost pressures are entirely invisible. The royalty is calculated on gross revenue before any costs are deducted, making the royalty holder's return mathematically independent of the operator's cost structure.
In an environment where input cost inflation in mining is running at elevated levels, this structural insulation is not a minor benefit. It is a fundamental re-engineering of how investment returns are generated in the sector. Consequently, gold price new highs and Gold Royalty together represent a compelling structural argument for royalty-model investing.
Physical Gold vs. Gold Royalty Companies: A Structural Comparison
The choice between holding physical gold and investing in gold royalty companies is often framed as a risk spectrum decision. However, the more accurate framing is a leverage and optionality comparison.
| Factor | Physical Gold | Gold Royalty Companies |
|---|---|---|
| Capital Expenditure Exposure | None | None (pre-funded at acquisition) |
| Reserve Expansion Upside | None | Yes, funded entirely by operators |
| Price Leverage Type | Linear (1:1 with gold price) | Exponential (price plus volume growth) |
| Mine-Site Inflation Protection | Not applicable | Full insulation via top-line structure |
| Entry Price for Existing Contracts | Current spot | Contracts acquired at prior lower levels |
| Production Growth Optionality | None | Yes, majority of assets not yet in production |
Physical gold delivers exactly what the gold price delivers, nothing more. A royalty portfolio, by contrast, has multiple embedded growth vectors operating simultaneously: the gold price itself, volume growth as new royalty assets enter production, and the call-option effect as gold prices cross thresholds that make previously sub-economic deposits commercially viable. For further context, undervalued mining stocks in this environment present a particularly interesting opportunity alongside royalty positions.
The Call Option Effect at $4,000+ Gold
Many royalty agreements were structured when gold was trading at substantially lower prices. As spot gold surpasses the economic viability thresholds embedded in older royalty contracts, deposits that were previously too low-grade or too remote to mine economically suddenly become viable. Operators make production decisions, and royalty revenue begins flowing from assets that were effectively dormant. The royalty holder benefits from this activation without committing any additional capital.
As gold prices cross the economic thresholds that unlock previously sub-economic deposits, royalty holders receive a de facto production windfall from assets they have already paid for. This mechanism is one of the least appreciated sources of value creation in the royalty model.
Are Gold Mining Equities Undervalued? The 2012 Comparison
What the Last Cycle Peak Teaches Investors
The 2012 peak in mining equity valuations offers a useful historical reference point. At that time, a super-cycle narrative drove elevated multiples across the mining sector, leading to excessive debt accumulation, overbuilding, and a prolonged period of capital destruction. The correction that followed lasted approximately twelve years, during which institutional investors largely withdrew from mining equities and sentiment shifted to what some market observers described as a nuclear winter for the sector.
The important observation for today is that despite gold now trading at prices meaningfully above 2012 levels, mining equity multiples remain a fraction of where they were at that cycle's peak. General equity investors remain underweighted in gold equities relative to both historical positioning and the underlying commodity fundamentals. In addition, understanding gold stocks and secular cycles helps contextualise why this disconnect between the gold price and mining equity valuations represents a structural opportunity not yet fully recognised by mainstream institutional capital.
Why Institutional Capital Is Still Tentative
The memories of the 2012 to 2024 drawdown remain fresh for many portfolio managers who allocated to mining stocks at the prior peak and endured a decade of underperformance. This institutional caution is creating a lagged response to fundamentally improved conditions. Junior explorers are beginning to access capital markets again, exploration budgets are recovering, and royalty companies with diversified portfolios are generating real revenue growth. However, the broad institutional reallocation that typically characterises a full sector re-rating has not yet materialised, suggesting the current phase may still represent early-stage positioning rather than peak positioning.
The next major ASX story will hit our subscribers first
New Demand Channels Reshaping the Physical Gold Market
Central Bank Accumulation as a Structural Floor
Central bank gold demand has emerged as a qualitatively different demand driver compared to prior cycles. Rather than acting as tactical buyers responding to price signals, many central banks have been systematically building gold reserves as a strategic asset allocation decision, partly driven by concerns about dollar-denominated reserve concentration and geopolitical exposure to US financial sanctions. This accumulation continues during price pullbacks, providing a structural demand floor that did not exist during earlier gold bull markets.
Gold-Backed Stablecoins: A New Technology-Native Demand Channel
One of the less widely discussed demand developments is the convergence of cryptocurrency infrastructure and physical gold through gold-backed stablecoins. These digital instruments require issuers to hold physical gold as collateral, creating a technology-native, non-cyclical source of demand for the metal. Critically, this buyer category tends to treat price pullbacks as accumulation opportunities rather than signals to reduce exposure. Both central banks and stablecoin issuers have been accelerating their physical gold acquisition during the current consolidation period, reinforcing the demand floor under the market.
Key Catalysts to Monitor Through the End of 2026
For investors positioning in gold royalty companies or gold equities more broadly, several forward-looking indicators are worth tracking closely:
- Federal Reserve interest rate trajectory and the direction of real rates adjusted for actual inflation
- Resolution or escalation of geopolitical conflicts affecting risk appetite and capital flows
- Quarterly central bank gold reserve disclosures, which provide the clearest window into institutional accumulation trends
- Stablecoin gold demand volumes as a proxy for technology-sector gold interest
- Junior explorer capital raising activity, which historically leads mining production growth by three to five years
- Mining equity valuation multiples relative to 2012 peak levels as a re-rating indicator
Notably, gold M&A activity is also an important signal to monitor, as consolidation patterns amongst producers and royalty holders often foreshadow broader institutional capital reallocation into the sector.
FAQ: Gold Royalties and the Gold Price Outlook for 2026
What is a gold royalty company and how does it generate returns?
A gold royalty company provides financing to mining operations in exchange for a perpetual right to receive a percentage of the mine's gross revenue. Unlike equity stakes in operating miners, royalties are not diluted by cost overruns, operational failures, or management decisions. The return is calculated on top-line revenue, making it structurally defensive while still delivering leveraged exposure to rising gold prices. You can track live gold prices to monitor how these returns are influenced in real time.
Why might gold royalty companies outperform physical gold during a bull market?
Royalty companies benefit from multiple simultaneous growth vectors: the gold price itself, volume growth as royalty assets enter production, and the activation of previously sub-economic deposits as gold prices rise. Physical gold delivers only linear price exposure with no production growth component and no optionality on reserve expansion.
What are the primary structural drivers of gold price new highs and Gold Royalty in 2026?
The main drivers include persistently negative real interest rates when measured against actual inflation rather than official CPI figures, expansion of global money supply, systematic central bank gold accumulation, and emerging demand from gold-backed stablecoin infrastructure. These are structural rather than cyclical forces.
How does inflation affect gold royalty returns differently from operating mining companies?
Because royalties are structured as a percentage of gross revenue, rising operating costs at the mine level do not reduce the royalty holder's income. Operating mining companies absorb cost inflation directly through margin compression. Royalty companies are mathematically insulated from this dynamic, making them superior vehicles for preserving real returns in inflationary environments.
What is the difference between a royalty and a streaming agreement?
A royalty entitles the holder to a percentage of gross revenue from a producing mine. A streaming agreement involves purchasing future metal production at a pre-agreed, below-market price. Both structures provide inflation-insulated, leveraged commodity exposure without operational risk, but they differ in how the economic entitlement is structured and priced.
Are gold mining equities currently cheap relative to historical valuations?
Current mining equity multiples remain significantly below the peak levels recorded during the 2012 cycle, despite gold now trading at materially higher prices. This valuation gap suggests a structural mispricing relative to commodity fundamentals that has not yet been corrected by institutional capital reallocation. According to recent reporting from Mining.com, gold's record rally continues to carry momentum that equity valuations have yet to fully reflect.
Key Takeaways: The Structural Case for Gold Royalties in a $4,000+ Gold Environment
- Gold's record-breaking trajectory in 2026 is underpinned by structural monetary forces including deeply negative real interest rates, global money supply expansion, and fiscal constraints on central bank tightening
- Actual inflation running well above official figures reinforces the debasement trade that has driven gold for over fifty years
- Royalty companies offer exponential leverage to gold price new highs and Gold Royalty through perpetual, top-line contracts that provide complete insulation from mine-site cost inflation
- Current mining equity multiples remain well below 2012 peak levels despite gold trading at all-time highs, representing a potential structural mispricing
- Central bank accumulation and gold-backed stablecoin demand are creating a structural demand floor that treats price pullbacks as accumulation opportunities
- The royalty model's free optionality on operator-funded exploration and expansion means shareholders benefit from reserve growth without committing additional capital
- Canada's mining ecosystem, encompassing technical, legal, and financial expertise, positions it as a global leader in mining sector talent and royalty company development
Readers interested in exploring gold market dynamics and the royalty investment model further can find additional commentary and interviews with senior precious metals sector figures on the Wall Street Bullion YouTube channel.
Want to Capture the Next Major ASX Mineral Discovery Before the Market Does?
Discovery Alert's proprietary Discovery IQ model delivers real-time alerts on significant ASX mineral discoveries, instantly converting complex geological data into actionable investment insights for both short-term traders and long-term investors — explore historic discoveries and their extraordinary returns to understand what's possible, then begin your 14-day free trial at Discovery Alert to position yourself ahead of the broader market.