August 1, 2026
The Dual Force Trap: Why Gold Cannot Break Free in Mid-2026
Precious metals markets rarely move in a single direction for long, but the current environment facing gold in mid-2026 is unusually complex. Rather than responding to one dominant force, the gold price is being pulled in opposite directions simultaneously: upward by geopolitical fear, and downward by the gravitational pull of a Federal Reserve that has made clear tightening remains firmly on the table. Understanding why the hawkish Fed hold caps gold rally potential requires unpacking both forces with equal rigour, because neither is going away soon.
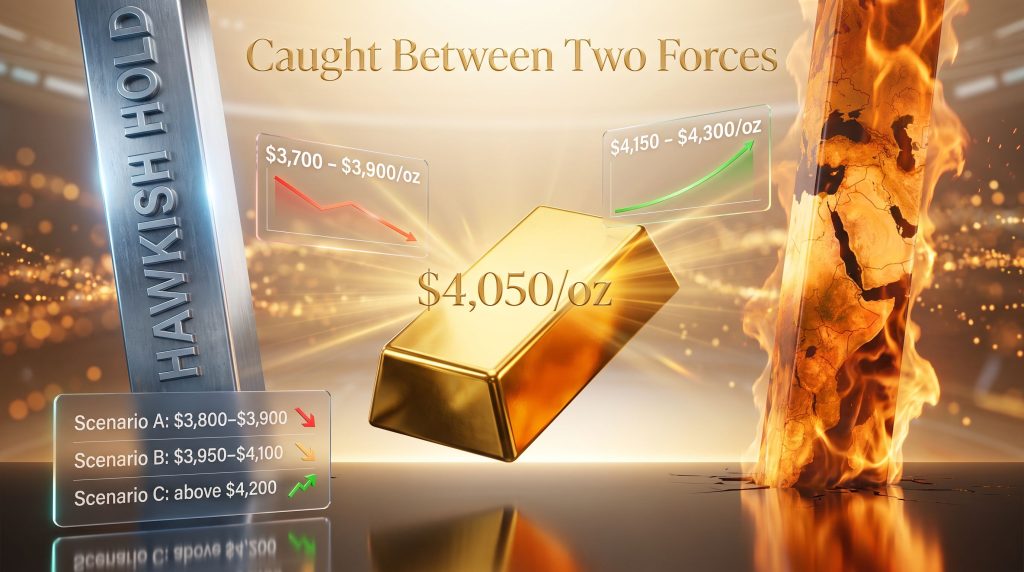
This is not a simple bull or bear story. It is a structural tension that has compressed gold into a contested trading range, where every rally is sold and every dip is bought, leaving the market anchored near the psychologically significant $4,050/oz level as July 2026 draws to a close. For broader context on where prices are heading, the current gold price forecast aligns closely with the range-bound pressures described here.
When big ASX news breaks, our subscribers know first
Understanding the Hawkish Hold Phenomenon
Most market participants understand rate hikes and rate cuts intuitively. The concept that generates more analytical confusion is the hawkish hold, a scenario where a central bank keeps its benchmark rate unchanged but deliberately signals through voting patterns, forward guidance, or rhetorical framing that further tightening remains a credible possibility.
For gold markets, this creates a specific and well-documented ceiling effect:
- Safe-haven demand and geopolitical risk support a price floor, preventing sharp selloffs
- Rate-hike expectations strengthen the US Dollar and lift real Treasury yields, suppressing gold's upside
- Reduced policy visibility forces traders into shorter-duration positioning rather than committing to directional trends
- Futures and ETF markets reprice continuously around every data release, creating elevated short-term volatility within a constrained range
Key Concept: Real interest rates, calculated by subtracting inflation expectations from nominal Treasury yields, are among the most reliable long-term predictors of gold's direction. When real rates rise, the opportunity cost of holding non-yielding gold increases, mechanically suppressing price appreciation even when nominal inflation remains elevated.
The July 2026 FOMC decision crystallised this dynamic perfectly. The Federal Reserve held rates unchanged, consistent with market expectations, but three officials dissented in favour of an immediate 0.25% rate increase. That minority vote was not symbolic. A three-dissent FOMC outcome materially shifts probability models for future policy meetings, embedding a higher-for-longer expectation into market pricing that directly constrains gold's upside trajectory.
Fed Chair Kevin Warsh reinforced the hawkish tone further by declining to offer forward guidance, leaving economists and portfolio managers with visibility of only four to eight weeks at most. His repeated characterisation of elevated inflation as unacceptable has effectively anchored consensus expectations around a rate hike arriving before any rate cut in 2026. According to FX Street's analysis, the hawkish dissent has been a key driver of post-FOMC volatility across precious metals.
Gold's Price Action During the Week of July 28–31, 2026
The week's trading activity illustrated the dual-force dynamic with unusual clarity. When the FOMC announced its hold on Wednesday, gold staged an immediate relief rally exceeding $40/oz, reaching approximately $4,085/oz during the US session before briefly extending above $4,100/oz during Asian trading hours.
That brief excursion above $4,100 is analytically significant. It signals that offshore safe-haven demand, particularly from Asian institutional buyers, remains robust and independent of Western monetary policy concerns. However, the rally's failure to sustain itself told the more important story.
Price Milestone Summary (July 2026):
| Price Point | Level | Context |
|---|---|---|
| FOMC-day rally peak | ~$4,085/oz | US session relief rally post-hold decision |
| Weekly high | Briefly above $4,100/oz | Asian trading hours extension |
| Thursday reversal | Sharp pullback | Market digesting three-dissent hawkish signal |
| Friday settlement | ~$4,050/oz | Technical and psychological support zone |
| Monthly trajectory | First positive month since February | Convergence of war premium and rate-hold relief |
Thursday's spike to the weekly high followed immediately by a steep reversal demonstrated the market's real-time processing of the dissent information. The $4,050 level that emerged as Friday's settlement point is not arbitrary. It represents the equilibrium point where safe-haven demand and rate-hike risk are currently balanced, making it a critical technical reference for the weeks ahead.
Despite the late-week weakness, gold was positioned to close July 2026 with its first positive monthly return since February, breaking a multi-month losing streak driven by oil-shock pressures and repeated tests of the $4,000 support floor. This resilience is broadly consistent with recent gold market outlook assessments, which identified $4,000 as a structurally significant support threshold.
The War Premium: How Middle East Instability Feeds Into Gold
The ongoing US-Iran conflict and its implications for global energy supply remain the dominant geopolitical variable shaping gold's safe-haven demand. The mechanism connecting Middle East instability to gold pricing operates through several reinforcing channels:
- Direct safe-haven flows as investors seek protection from geopolitical uncertainty
- Oil price amplification, where shipping route disruption pushes crude prices higher
- Inflation transmission, where elevated energy costs feed into broader consumer price indices
- Currency and yield market spillover, where inflation uncertainty affects Dollar strength and Treasury yields
The brief weekend ceasefire that preceded the week of July 28 collapsed quickly, as prior pauses in hostilities have done throughout this conflict. Both the US and Iran resumed offensive operations before Tuesday evening, and the conflict's geographic footprint began expanding in ways that caught markets off guard.
A Ukrainian strike against an Iranian vessel during the week introduced a new dimension to the conflict's scope, signalling that third-party actors are now actively involved in operations that intersect with the primary US-Iran confrontation. This expansion of participant actors is a qualitative shift that markets must price separately from the core bilateral conflict.
Furthermore, gold's safe-haven role becomes especially pronounced when geopolitical risks intersect with already-elevated inflationary pressures, as is clearly the case now.
The Inflation Paradox: The same geopolitical forces generating safe-haven demand for gold are simultaneously the primary accelerant of global inflation. An actual, sustained disruption of major shipping lanes rather than merely the threat of disruption would likely push oil back toward $150/bbl, force G7 central banks toward sharper rate increases, and ultimately become a net negative for gold through the monetary policy channel.
The Scenario Matrix: Three Paths Through Q3 2026
Rather than adopting a single directional view, sophisticated market participants are increasingly applying scenario-based frameworks to navigate the current environment. The three most analytically supported pathways through Q3 2026 carry meaningfully different implications for gold.
| Fed Policy Scenario | Likely Gold Range | USD Direction | Treasury Yields | Net Assessment |
|---|---|---|---|---|
| Rate hold with dovish pivot signals | $4,150-$4,300/oz | Weakening | Declining | Bullish |
| Continued hawkish hold (base case) | $3,950-$4,100/oz | Stable to firm | Elevated | Range-bound |
| Confirmed September rate hike | $3,700-$3,900/oz | Strengthening | Rising | Bearish |
| Rate hike plus geopolitical escalation | $3,850-$4,050/oz | Mixed | Volatile | Highly uncertain |
Scenario A: The Hawkish Hike Materialises
If the September 2026 FOMC meeting delivers the hike that three dissenters advocated for in July, the dollar would likely strengthen materially, real yields would rise, and gold could test the $3,800–$3,900/oz range. Even elevated geopolitical risk premium would struggle to fully absorb a confirmed tightening shock. ETF outflows would likely accelerate as institutional investors rotate toward short-duration Treasuries.
Scenario B: The Prolonged Hawkish Hold (Base Case)
The most analytically defensible outcome has the Fed maintaining rates through Q3 while preserving restrictive rhetoric. Gold remains anchored between $3,950 and $4,100/oz, with geopolitical developments providing the floor and rate-hike expectations providing the ceiling. This environment favours tactical short-duration traders over long-term directional investors.
Scenario C: Geopolitical Shock Overrides Monetary Policy
A severe escalation involving simultaneous disruption to multiple shipping corridors could generate safe-haven demand powerful enough to temporarily override rate-hike concerns, pushing gold above $4,200/oz. However, the inflationary consequence of such an event would ultimately force an emergency Fed response, reversing the gold rally over the medium term.
Critical Insight: Across all three scenarios, gold's upside is structurally constrained by the Fed's hawkish posture. The decisive variable is not whether monetary policy or geopolitics dominates, but which force moves first. The sequence of events matters more than the events themselves.
What Competing Forces Are Keeping Gold Anchored Near $4,050?
The case for continued support:
- Persistent and unresolved geopolitical uncertainty provides a structural floor across institutional and retail gold demand
- Central bank gold demand trends in 2026 continue to act as a demand-side anchor that operates independently of rate policy considerations
- Gold's demonstrated ability to hold above $4,000/oz through multiple weeks of rate-hike speculation signals genuine underlying demand resilience rather than speculative froth
- The US Dollar Index and Treasury yield movements have not yet delivered the sustained strength required to decisively break gold below its support zone
The case for a continued ceiling:
- Three FOMC dissents have materially recalibrated futures market pricing toward a higher probability of a September 2026 hike
- A strengthening US Dollar resulting from further Fed tightening would mechanically compress dollar-denominated gold prices
- Historical patterns show gold consistently underperforms during confirmed rate-hike cycles compared to the ambiguous hold-with-uncertainty phases that preceded them
- The absence of forward guidance leaves the market without a reliable anchor other than Warsh's anti-inflation rhetoric
In addition, the interplay between gold and bond dynamics continues to reinforce the ceiling effect, as rising real yields in the Treasury market create consistent headwinds for gold valuation.
The next major ASX story will hit our subscribers first
Key Catalysts to Watch in Early August 2026
Two variables are most likely to resolve the current range-bound stalemate, and both arrive in the first two weeks of August.
July Non-Farm Payrolls (First Friday of August)
- A strong jobs print would validate the hawkish dissents and increase September hike probability, pressuring gold toward $3,950/oz or lower
- A materially weak payrolls number could revive rate-cut speculation, potentially unlocking a sustained move toward $4,150/oz
- Wage growth data carries particular significance given Warsh's stated concern about inflation persistence
- The unemployment rate trajectory will be scrutinised against current Fed reaction function models
Middle East Conflict Developments
Geopolitical headlines are likely to drive more short-term gold volatility than scheduled economic data through early August. Consequently, traders should monitor:
- Any expansion of conflict activity to additional shipping corridors beyond current threat levels
- Involvement of new regional or third-party actors following the Ukrainian vessel strike precedent
- Oil price trajectory, with particular attention to any sustained move above $130/bbl that would accelerate the inflation-to-rate-hike feedback loop
- FOMC member speeches or interviews that clarify individual voting intentions ahead of the September meeting
As Kitco's market commentary notes, the Fed's hawkish hold has effectively left both gold and silver in a state of market limbo, with resolution dependent on the sequencing of the catalysts described above.
Frequently Asked Questions: Gold, the Fed, and Geopolitical Risk
Why does a hawkish Fed hold suppress gold prices even when rates are unchanged?
When the Fed signals that its next move is more likely to be a tightening than an easing, two things happen that are structurally negative for gold. The US Dollar tends to strengthen in anticipation of higher yields, and real Treasury yields rise as rate-hike probability is priced in. Both dynamics increase the opportunity cost of holding non-yielding gold, creating downward valuation pressure even before a single rate increase is delivered.
What made the July 2026 FOMC decision particularly significant for gold markets?
The combination of an unchanged rate decision and three dissenting votes in favour of an immediate hike created an unusual tension. The hold provided short-term relief, producing the $40/oz rally. However, the dissent volume shifted consensus probability models toward a September hike, and the deliberate withdrawal of forward guidance amplified uncertainty rather than reducing it. Gold's inability to hold gains above $4,100/oz was the market's direct response to that combined signal.
How does the US-Iran conflict create a paradox for gold investors?
The war simultaneously creates safe-haven demand for gold and acts as the primary driver of the inflationary pressures that may ultimately force interest rates higher. In the short term, conflict uncertainty is gold-positive. If the conflict escalates to the point where it genuinely disrupts multiple major shipping corridors and pushes oil toward $150/bbl, the resulting inflation surge would compel G7 central banks into aggressive tightening — a scenario that would ultimately be gold-negative through the monetary policy channel.
What is the most important support level for gold right now?
Based on late July 2026 trading patterns, the $4,050/oz level represents the near-term contested equilibrium between safe-haven demand and rate-hike risk. The broader $4,000/oz level functions as a major technical and psychological floor that the market has tested and defended repeatedly over recent months. A decisive close below $4,000 would likely trigger accelerated selling from technically-driven participants. Indeed, the hawkish Fed hold caps gold rally attempts with considerable consistency at this juncture, reinforcing the importance of these key technical levels for traders and investors alike.
Disclaimer: This article is intended for informational purposes only and does not constitute financial advice or a recommendation to buy or sell any asset. All price levels, scenarios, and forecasts discussed are analytical projections and not guarantees of future performance. Readers should conduct their own research and consult qualified financial advisers before making investment decisions. Gold price scenarios and Federal Reserve policy projections involve inherent uncertainty and may differ materially from actual outcomes.
Want To Capitalise On The Next Major Mineral Discovery Before The Broader Market?
While gold navigates the complex interplay of hawkish Fed policy and geopolitical risk, Discovery Alert's proprietary Discovery IQ model delivers real-time alerts on significant ASX mineral discoveries — instantly translating complex mineral data into actionable opportunities for both short-term traders and long-term investors. Explore how historic discoveries have generated substantial returns on Discovery Alert's dedicated discoveries page, and begin your 14-day free trial today to position yourself ahead of the market.