August 1, 2026
Underground Mining Fundamentals Rarely Make Headlines, But They Drive Everything
Most retail investors tracking gold producers focus on quarterly ounce counts and revenue figures. What rarely receives adequate attention is the mechanical architecture underneath those numbers: the equipment availability rates, stope cycling discipline, survey accuracy, and development sequencing that collectively determine whether a production ramp-up is sustainable or fragile. These operational subsystems are invisible in earnings summaries but entirely visible to anyone who understands how underground hard-rock gold mines actually function.
The West Red Lake Gold Mines (TSXV: WRLG | OTCQX: WRLGF) West Red Lake Gold Madsen Mine operational ramp-up in Ontario's Red Lake district offers a technically rich case study in exactly this kind of systematic de-risking. The Q2 2026 results, released July 15, 2026, were not simply a production beat. They represented the convergence of several parallel engineering workstreams that had been running since the mine restart in June 2025, each one resolving a specific constraint that had historically limited throughput, grade predictability, and cash generation at this operation.
When big ASX news breaks, our subscribers know first
What Makes a Mine Restart Structurally Different From a New Build?
When a mining company acquires and restarts a previously operated underground mine, it inherits both infrastructure advantages and embedded liabilities. At Madsen, the advantages included existing underground development, ventilation infrastructure, and a functioning processing plant. The liabilities were less immediately visible: an ageing and poorly maintained mobile equipment fleet, historical survey data of questionable accuracy, and a legacy geological understanding that did not reflect the drilling density required for modern grade prediction.
These inherited conditions fundamentally shaped the West Red Lake Gold Madsen Mine operational ramp-up strategy. Rather than pursuing a production-pull approach, where operators maximise near-term ounce output by targeting the highest-grade stopes available regardless of sequencing consequences, the team prioritised building operational foundations before scaling throughput. This development-first discipline accepts lower early-stage production in exchange for reduced operational risk, more predictable stope availability, and better dilution control as the operation matures.
Key Context: West Red Lake Gold declared commercial production at the Madsen Mine on January 1, 2026, following a phased restart initiated in June 2025. Full-year 2026 guidance targets 35,000 to 45,000 ounces of gold, with approximately 60% of annual output weighted toward the second half of the year.
The Fleet Problem No One Talks About: Equipment Availability as a Production Constraint
Why Mechanical Availability Is the Rate-Limiting Variable
In underground hard-rock mining, equipment availability is not a secondary operational metric. It is the primary gating factor for daily ore movement. Every haul truck or loader that is out of service for mechanical repair creates a cascade effect: development headings stall, stope mucking cycles extend, and ore tonnage to surface drops below plan. In operations attempting to establish steady-state production rhythms, chronic equipment downtime is among the most common causes of persistent throughput underperformance.
Industry benchmarks for well-maintained underground fleets typically target mechanical availability in the range of 75% to 85%. Operations running below 60% availability, particularly those relying on ageing inherited equipment, frequently find that planned daily tonnage targets are structurally unachievable regardless of how well the geological model or mine sequence is designed.
At Madsen, prior operators left behind a mobile fleet characterised by exactly this kind of chronic unreliability. The machines were aged, undermaintained, and insufficient in number to support the haulage cycles required to meet development and production schedules concurrently.
The Capital Deployment Decision and Its Timing Effect
During 2025, West Red Lake Gold directed significant capital toward a complete renewal of the underground mobile fleet, acquiring seven to eight new haul trucks alongside new loaders and auxiliary equipment. This was a deliberate pre-production investment designed to eliminate equipment availability as a bottleneck before production rates were scaled upward.
A detail that is frequently missed in commentary on this investment is the deployment lag effect. Equipment ordered and received in late 2025 does not immediately deliver its full productivity benefit. Operators require familiarisation time with new machines, maintenance protocols must be established, and underground ground conditions require careful management during initial deployment. The operational benefit of this fleet investment materialised progressively through Q2 2026 as the new equipment reached consistent operational availability of 75% to 80%.
Technical Insight: In underground hard-rock operations, each percentage point improvement in mobile equipment availability directly translates into additional daily tonnage capacity. A 10-point availability gain across a fleet of seven to eight trucks can unlock hundreds of additional tonnes of ore movement per shift, making fleet renewal one of the highest-return capital investments available to a restarting underground mine.
The forward capital implication of completing the fleet renewal through 2025 is also significant. With the major equipment investment already absorbed, the incremental capital burden on 2026 operational cash generation is materially reduced, improving the operation's capacity to generate and retain free cash flow as production scales upward.
Q1 to Q2 2026: Reading the Numbers as an Operational System
The production statistics between the two quarters are most informative when read as an interconnected system rather than individual data points.
| Metric | Q1 2026 | Q2 2026 | Change |
|---|---|---|---|
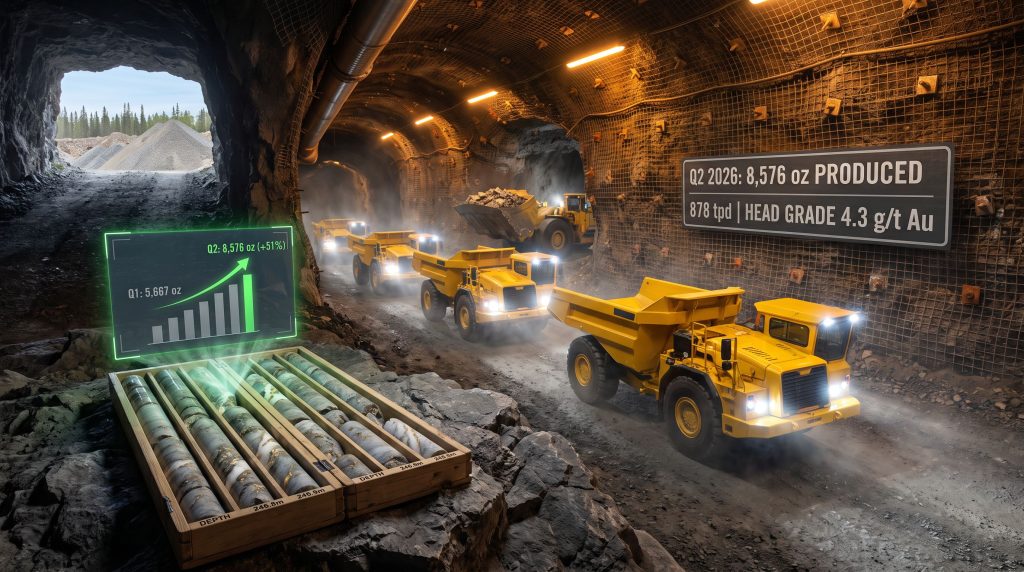
| Gold Produced (oz) | 5,667 | 8,576 | +51% |
| Mined Gold (oz) | ~6,050 (est.) | 10,459 | +73% |
| Underground Ore Mined (t) | 51,616 | 75,524 | +46% |
| Daily Mining Rate (tpd avg.) | 573 | 878 | +53% |
| Head Grade (g/t Au) | 3.5 | 4.3 | +23% |
| Mill Recovery | ~95% | 95% | Stable |
| Cash Flow Position | Breakeven | Positive FCF | Inflection |
The gap between mined ounces (+73%) and produced ounces (+51%) is not a discrepancy. It reflects the deliberate accumulation of a surface ore stockpile as mining rates exceeded mill throughput capacity, which is itself a sign of operational health rather than processing underperformance. The 95% mill recovery rate remaining stable across both quarters confirms that processing performance was not a variable in the quarter-over-quarter improvement; the gains came entirely from the mine side of the operation.
Stope Sequencing: The Underground Rhythm That Determines Everything
How the Longhole Open Stoping Cycle Actually Works
Underground gold mining in narrow-vein, high-grade systems like Madsen relies on carefully managed stope cycling. The longhole open stoping method involves a sequence of distinct phases for each individual stope:
- Definition drilling to confirm the stope boundary geometry and grade continuity at close spacing
- Ring drilling to establish the blasthole pattern across the stope profile
- Blasting to fragment the ore mass in controlled lifts
- Mucking to extract broken ore using loaders and haul trucks
- Backfilling the void to restore ground support before adjacent stopes are mined
- Preparation of the next stope in the sequence before returning to cycle
Running six to seven stopes simultaneously in various stages of this cycle is the operational architecture that enables consistent daily tonnage. If an operation is cycling only two or three stopes, a single stope delay, whether from equipment availability, ground conditions, or drilling scheduling, can cause a significant drop in daily ore movement. Broader stope inventories provide natural redundancy.
Establishing this kind of multi-stope rhythm takes multiple quarters to stabilise. The infrastructure required to access six to seven concurrent stopes, including cross-cuts, drawpoints, and ventilation connections, must be developed in advance. This is precisely why the development-first investment phase through H1 2026 was a prerequisite for the Q2 production acceleration rather than an alternative to it.
Why Mining Rate Exceeding Mill Capacity Is a Strategic Positive
By mid-Q2 2026, underground productivity was consistently exceeding 1,000 tonnes per day. The processing plant at Madsen is currently permitted for 800 tonnes per day, meaning the mine was generating ore faster than the mill could consume it. The resulting surface stockpile reached approximately 10,768 tonnes by quarter-end and was approaching 15,000 tonnes heading into Q3 2026, representing roughly half a month of mill feed.
Scenario Analysis: If underground mining rates sustain above 1,000 tpd while the mill processes at its current 800 tpd permitted rate, the surface stockpile grows by approximately 200 tonnes per day. Over a 90-day quarter, this accumulates to roughly 18,000 additional tonnes of ore inventory, providing a meaningful operational buffer as the company works toward a mill throughput permit expansion toward 1,000 tpd.
This inventory provides insulation against temporary underground disruptions, including stope sequencing delays, equipment maintenance windows, or geotechnical events that might temporarily restrict ore access. Rather than halting mill feed during such events, operators can draw on the stockpile to maintain processing continuity and revenue generation.
The Survey Problem: A Legacy Risk Most Restart Investors Miss
How Survey Inaccuracy Accumulates Over Decades
Underground survey error is one of the least-discussed technical risks in legacy mine restart situations, yet it carries significant operational consequences. In older underground operations, survey control was maintained using optical instruments and physical reference points drilled into rock walls. Over decades of operation, these reference points can be lost, instruments can drift, and documentation practices can become inconsistent.
The practical result is that the spatial positions of historical excavations, stopes, and voids recorded on legacy mine maps may be several metres away from their actual locations. In a modern operation attempting to mine panels adjacent to historical workings, this positional uncertainty forces engineers toward conservative stope designs. Smaller stopes, tighter standoff distances from historical voids, and the use of more labour-intensive cut-and-fill mining methods rather than longhole stoping all become necessary precautions.
Each of these adjustments reduces extraction speed, increases dilution, and raises labour cost per tonne. The net effect on grades and unit economics can be substantial. Furthermore, understanding true width vs apparent width in the context of legacy survey data adds another layer of complexity that engineers must resolve before stope designs can be finalised.
What the Updated Survey Work Revealed at Madsen
The underground survey correction programme at Madsen produced a counterintuitive but highly valuable finding. Updated tight-spaced definition drilling and revised survey control revealed that many planned stope panels were actually positioned further from historical voids than the legacy mine maps had indicated. The risk of mining into unmapped historical excavations was materially lower than the inherited documentation suggested.
This single finding had cascading operational benefits:
- Engineering teams could design larger, independent longhole open stopes without the wall stability compromises required when mining adjacent to unmapped voids
- The transition from cut-and-fill to longhole open stoping across all production areas was accelerated
- Dilution from waste rock inclusion in the ore stream was reduced
- Extraction speed improved as larger stope volumes could be mucked per blast cycle
The transition to 100% longhole open stoping across active production areas during Q2 2026 was a direct consequence of this survey confidence. It is arguably the least-discussed but most operationally significant single development of the quarter.
The next major ASX story will hit our subscribers first
Grade Improvement Explained: Why 4.3 g/t Au Is Not the Ceiling
The head grade improvement from 3.5 g/t Au in Q1 2026 to 4.3 g/t Au in Q2 2026 represents a 23% grade increase. In the context of underground gold mining economics, this magnitude of grade improvement at constant tonnage would alone be sufficient to shift an operation from marginal to comfortably cash-generative.
Understanding why grades improved requires understanding where grades are going. As the mining sequence advances into intact, well-defined panels rather than remnant or mixed panels adjacent to historical workings, grade consistency improves. Properly interpreting drill results from the 4447 complex in South Austin and the deeper 904-level panels reveals that both areas are targeting mined grades in the 6 to 8 g/t Au range through H2 2026.
| Mining Area | Target Grade Range | Mining Method | Status |
|---|---|---|---|
| Upper-level panels (current) | 4.3 g/t Au (Q2 avg.) | Longhole open stoping | Active |
| 4447 Complex (South Austin) | 6 to 8 g/t Au (target) | Longhole open stoping | Advancing |
| 904-level complex | 6 to 8 g/t Au (target) | Longhole open stoping | Development phase |
The reliability of these grade targets rests on the geological block model, which was constructed from more than 200,000 metres of underground definition drilling at 6 to 7-metre hole spacing. For reference, this drill spacing exceeds the density typically required for Measured Resource classification under NI 43-101 standards, Canada's national instrument governing mineral resource and reserve reporting. The implication is that the block model carries above-standard confidence in grade continuity between drillholes, providing a more reliable basis for stope-by-stope grade prediction than is typical for underground mines at this stage of development.
Q2 2026 reconciliation between block model-predicted grades and actual mill feed confirmed that the geological model was performing with the predictive accuracy expected in upper-level panels. Consequently, drill results interpretation validated at this level provides a strong foundation for confidence in the deeper grade targets being pursued through H2 2026.
From Breakeven to Positive Free Cash Flow: The Financial Mechanics
The three operational variables that drove the cash flow inflection in Q2 2026 were not independent events. They were interconnected consequences of the infrastructure investment cycle that had been running since mid-2025:
- Tonnage: Underground ore mined increased 46% to 75,524 tonnes as fleet reliability and stope availability both improved
- Grade: Head grade rose 23% to 4.3 g/t Au as mining advanced into intact, lower-dilution panels enabled by survey corrections
- Recovery: Mill recovery held stable at 95%, confirming processing performance was consistent across the grade increase
The combination of these three variables moved the operation from approximately 2,000 to 2,500 ounces per month cash breakeven in Q1 2026 to a position of net cash accumulation and voluntary debt repayment in Q2 2026. The significance of voluntary debt repayment as a signal should not be underestimated. It indicates operational cash generation was exceeding both sustaining capital requirements and mandatory debt service obligations, representing genuine surplus cash generation from the mine itself.
Understanding the cut-off grade economics underpinning these decisions is essential context. With approximately 60% of full-year guidance weighted toward H2 2026 and grade targets advancing toward 6 to 8 g/t Au in deeper complexes, the cash generation profile is positioned to strengthen further as the year progresses.
Key Risks Investors Should Monitor Through H2 2026
The West Red Lake Gold Madsen Mine operational ramp-up has demonstrated clear de-risking progress, however several variables remain critical to achieving full-year guidance of 35,000 to 45,000 ounces.
| Risk Factor | What to Watch | Why It Matters |
|---|---|---|
| Daily mining rate sustainability | Whether rates above 1,000 tpd are maintained without sequencing gaps | Determines stockpile build rate and H2 production volumes |
| Grade continuity at depth | Block model reconciliation in 4447 and 904 complexes | 6 to 8 g/t Au targets require continuous definition drilling at 6 to 7m spacing |
| Mill throughput permit expansion | Progress toward 1,000 tpd permitted processing rate | Determines how quickly stockpile inventory converts to produced ounces |
| Stope cycle stability in lower levels | Geotechnical performance in deeper mining areas | Ground conditions may differ from upper-level panels and require proactive management |
Disclaimer: This article contains forward-looking operational scenarios and production targets sourced from company guidance and operational reports. These projections involve significant uncertainty and should not be construed as financial advice. Readers should conduct their own due diligence before making any investment decisions.
Scenario Modelling: Production Outcomes Under Different Operating Assumptions
| Scenario | Daily Mining Rate | Head Grade | Implied Annualised Output |
|---|---|---|---|
| Conservative (current rate) | 878 tpd | 4.3 g/t Au | ~35,000 oz/year |
| Base Case (H2 target) | 1,000 tpd | 5.5 g/t Au | ~42,000 to 45,000 oz/year |
| Upside (grade + rate) | 1,000+ tpd | 6 to 8 g/t Au | ~50,000+ oz/year |
Note: Scenarios are illustrative and assume 95% mill recovery and 800 to 1,000 tpd mill throughput. Not financial advice.
FAQ: West Red Lake Gold Madsen Mine Operational Ramp-Up
What Is the West Red Lake Gold Madsen Mine Ramp-Up Timeline?
West Red Lake Gold restarted the Madsen Mine in June 2025 and declared commercial production on January 1, 2026. The operation entered a structured ramp-up phase through H1 2026, with full-year 2026 guidance of 35,000 to 45,000 ounces and approximately 60% of annual production expected in H2 2026.
Why Did Madsen's Gold Production Increase So Sharply in Q2 2026?
The 51% quarter-over-quarter production increase to 8,576 ounces was driven by three interconnected operational improvements: new underground fleet deployment raising equipment availability to 75% to 80%, expanded stope cycling across six to seven active panels, and survey corrections enabling larger longhole stopes with lower dilution and a 23% grade improvement.
What Is the Significance of the Surface Ore Stockpile?
The approximately 15,000-tonne surface stockpile heading into Q3 2026 represents roughly half a month of mill feed at current processing rates. This inventory buffer insulates the processing plant from temporary underground disruptions and provides operational flexibility as the company works toward higher permitted mill throughput rates.
How Does the Geological Block Model Support Grade Prediction?
The block model is constructed from more than 200,000 metres of underground definition drilling at 6 to 7-metre hole spacing, exceeding the density typically required for Measured Resource classification under NI 43-101 standards. Q2 2026 reconciliation between predicted and actual grades validated the model's reliability in active upper-level mining areas. In addition, a definitive feasibility study framework underpins the confidence placed in these geological estimates as the operation matures.
What Grade Targets Is West Red Lake Gold Pursuing in H2 2026?
As mining advances into the 4447 complex in South Austin and the 904-level panels, management is targeting mined grades of 6 to 8 g/t Au through the second half of 2026, compared to the 4.3 g/t Au average achieved in Q2 2026.
What Operational Risks Could Affect Madsen's H2 2026 Production Guidance?
Key risks include sustaining underground mining rates above 1,000 tpd, maintaining grade continuity in deeper mining complexes through continuous definition drilling at close spacing, progressing the mill throughput permit toward 1,000 tpd, and managing geotechnical conditions in lower-level complexes that may differ from the upper panels mined to date.
Want To Stay Ahead of the Next Major ASX Mineral Discovery?
Discovery Alert's proprietary Discovery IQ model scans ASX announcements in real time, instantly converting complex geological data into actionable insights for both short-term traders and long-term investors — the same rigorous approach that informed early positions in transformative discoveries like De Grey Mining and WA1 Resources. Explore Discovery Alert's discoveries page to understand the historic returns major mineral discoveries can generate, and begin your 14-day free trial at Discovery Alert to position yourself ahead of the broader market.