August 1, 2026

When the Smartest Money Disagrees: Gold's Two-Speed Market in 2026
Every generation or so, a single asset class becomes the focal point for a fundamental disagreement about how the global monetary system actually works. Gold has occupied that position for centuries, but the divergence visible in mid-2026 is particularly instructive. Gold ETF outflows and central bank buying represent the same metal, at the same price, simultaneously triggering large-scale selling from one category of sophisticated investor and record-breaking accumulation from another. Understanding why requires looking past the price ticker and into the radically different frameworks each group uses to evaluate risk.
The World Gold Council's Gold Demand Trends Q2 2026 report, published July 30, 2026, provides the clearest data snapshot of this structural split. The numbers tell a story that aggregate price charts simply cannot.
When big ASX news breaks, our subscribers know first
Q2 2026 Gold Demand: The Full Picture at a Glance
Before examining what is driving each buyer group, it is worth reviewing the complete demand landscape for the quarter.
| Demand Category | Q2 2026 Volume | Year-on-Year Change |
|---|---|---|
| Gold ETF Net Flows | -45 tonnes | Negative shift |
| Central Bank Net Purchases | +289 tonnes | +62% YoY |
| OTC and Other Investment | +327 tonnes | Stable/elevated |
| Physical Bar and Coin | +307 tonnes | -3% YoY |
| Jewellery Fabrication | 278 tonnes | Lowest since pandemic |
| Total Demand (incl. OTC) | 1,269 tonnes | Broadly flat YoY |
| H1 2026 Demand Value | $380 billion | Record high |
Source: World Gold Council, Gold Demand Trends Q2 2026, published July 30, 2026.
What is immediately apparent is that the headline ETF outflow figure, while directionally meaningful for short-term price discovery, sits within a demand environment that is far more nuanced. Total demand held broadly flat year-on-year, and the first-half value of $380 billion represented a record high, according to the World Gold Council. Furthermore, gold ETF flows alone do not capture the full picture of investor sentiment across global markets.
Why Gold ETF Investors Were Sellers in Q2 2026
The Rate-Expectation Transmission Mechanism
Gold-backed exchange-traded funds recorded net outflows of 45 tonnes across the second quarter, a figure concentrated particularly in North American markets. To understand why, it helps to trace the transmission mechanism through which monetary policy expectations reach paper gold markets.
When inflation readings remain elevated, bond markets begin pricing in a more aggressive Federal Reserve tightening path. Rising rate expectations push real yields higher, which in turn increases the opportunity cost of holding a non-yielding asset. For ETF investors managing against quarterly benchmarks, the calculus becomes straightforward: higher real yields make gold comparatively less attractive than fixed-income instruments, prompting redemptions. Indeed, gold and bond dynamics have long shaped how rate-sensitive investors position themselves around monetary policy shifts.
This is precisely what unfolded in Q2 2026. The average LBMA gold price for the quarter settled at $4,506 per ounce, already meaningfully below January 2026's peak, with prices declining approximately 14% over the quarter. ETF outflows accelerated alongside that price weakness, with May 2026 alone seeing 16 tonnes of net redemptions before brief inflows returned early in June, only to be followed by renewed selling pressure.
According to investor sentiment data, Western ETF demand remains closely tied to real yields, US monetary policy expectations, and dollar strength, effectively making these flows a proxy for Fed rate-bet positioning rather than long-term monetary conviction.
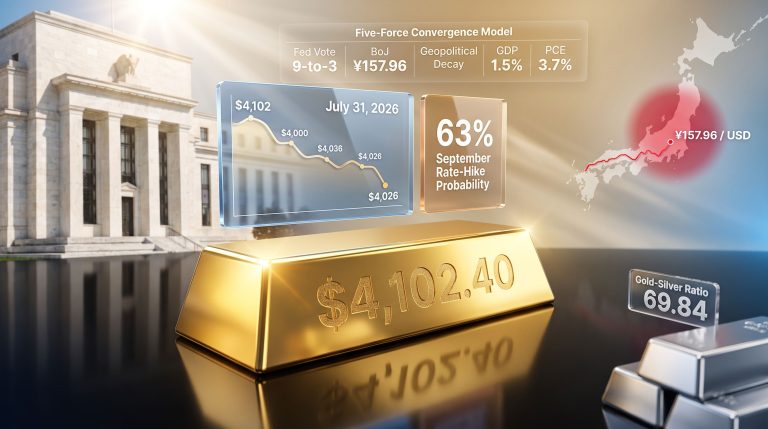
The policy backdrop added further complexity. The Federal Reserve's Q2 2026 rate decision produced a 9-to-3 vote to hold, with three regional Federal Reserve presidents actively pushing for immediate hikes. That dissent signal amplified rate-hike fears among performance-sensitive investors and contributed to sustained ETF selling pressure throughout the quarter.
Is the Regional ETF Picture Uniform?
One dimension that aggregate outflow figures obscure is the significant regional divergence within global ETF markets. While Western funds, particularly in North America, drove the headline redemption numbers, Asian ETF markets recorded net inflows over the same period. This reflects a fundamentally different investor psychology: across much of Asia, gold ETFs function primarily as savings vehicles and currency hedges rather than as tactical rate-bet instruments.
The holding periods are longer, the sensitivity to Fed policy cycles is lower, and the motivation for ownership is structurally different. This geographic split matters because it confirms that ETF outflows in 2026 are not a universal verdict on gold's value proposition. They represent the behaviour of a specific cohort of investors with a specific time horizon responding to a specific policy signal.
Central Bank Gold Buying: A Record Quarter Driven by Entirely Different Logic
The Scale of Sovereign Accumulation
While ETF investors were exiting, the world's central banks were buying gold at the fastest pace ever recorded for any second quarter in the World Gold Council's historical data series. Net central bank gold demand reached 289 tonnes in Q2 2026, a 62% increase compared to Q2 2025. This followed 244 tonnes purchased in Q1 2026, meaning combined first-half sovereign accumulation exceeded 530 tonnes, a pace that, if sustained through year-end, would set a full-year record.
The leading buyers for the quarter included:
- Poland: The single largest sovereign buyer, adding 51 tonnes to national reserves during the quarter
- China (People's Bank of China): Added 33 tonnes in Q2 2026, the largest single-quarter purchase from Beijing since late 2023
- Broader participation: The World Gold Council characterises central bank sentiment toward gold in 2026 as exceptionally strong, with accumulation distributed across multiple reserve managers rather than concentrated in one or two dominant buyers
Why Do Reserve Managers Buy Into Price Declines?
The behaviour of central banks during a 14% price decline is counterintuitive only if you apply the time horizon of a quarterly performance fund to an institution managing a 30-year reserve strategy. For sovereign reserve managers, a quarterly price correction is statistically insignificant against the backdrop of multi-decade monetary trends.
The structural conviction driving central bank accumulation rests on three pillars:
- Currency debasement risk: Over long periods, fiat currencies lose purchasing power. Gold has historically preserved real value across monetary cycles in ways that paper instruments cannot.
- Dollar concentration risk: A substantial share of global reserves is held in US dollar-denominated assets. Accumulating gold reduces exposure to any single sovereign currency and the political decisions of any single central bank.
- Geopolitical monetary disruption: The freezing of Russian central bank assets in 2022 accelerated a structural reassessment among reserve managers globally about the counterparty risk embedded in dollar reserve holdings. Gold held in sovereign vaults carries no such counterparty risk.
None of these structural concerns are resolved, or even materially altered, by a single quarterly Fed rate-hike cycle. Reserve managers in Warsaw or Beijing are not asking what gold will return over the next six months. They are asking what the purchasing power of dollar-denominated reserves will look like in 2040 or 2050. Furthermore, gold in the monetary system continues to evolve as a core instrument of sovereign financial strategy precisely because of these long-run considerations.
The 6-to-1 Ratio: What It Reveals About Price Discovery
Central banks purchased more than six times the volume that ETF investors redeemed in Q2 2026 (289 tonnes versus 45 tonnes). This ratio carries important implications for how the gold market actually functions at a structural level.
Short-term price discovery in gold is disproportionately influenced by paper-market participants because futures and ETF trading volumes are large, liquid, and fast-moving. Central bank purchases, by contrast, are often executed gradually and disclosed with a lag. The result is a pricing mechanism that can temporarily diverge from the underlying supply-demand reality of the physical market.
Historical precedent supports this interpretation. Prior periods of sustained ETF outflows have not prevented gold from reaching new price highs when sovereign and OTC physical demand remained elevated. The paper-market signal is real but time-limited. The physical accumulation signal operates over a longer arc.
| Buyer Type | Primary Motivation | Time Horizon | Price Sensitivity | Q2 2026 Action |
|---|---|---|---|---|
| Western ETF Investors | Rate-bet / yield optimisation | Quarterly to annual | High | Net sellers (-45t) |
| Asian ETF Investors | Savings / currency hedge | Medium-term | Moderate | Net buyers |
| Central Banks | Reserve diversification / debasement hedge | Decadal | Very low | Net buyers (+289t) |
| OTC Physical Buyers | Wealth preservation / geopolitical hedge | Long-term | Low to moderate | Net buyers (+327t) |
| Retail Bar and Coin | Inflation hedge / savings | Medium to long-term | Moderate | Stable (+307t) |
Beyond ETFs and Central Banks: The Full Physical Demand Picture
OTC Markets: The Underreported Demand Engine
Over-the-counter physical gold demand reached 327 tonnes in Q2 2026, making it the largest single demand category for the quarter and exceeding ETF outflows by a factor of more than seven. OTC transactions involve direct physical gold purchases conducted outside of exchange-traded products, typically by institutional buyers, high-net-worth individuals, family offices, and sovereign entities.
The World Gold Council attributes a significant portion of Q2 2026 OTC demand to Asian private investors who prefer direct physical ownership over exchange-traded exposure. This channel receives considerably less mainstream financial media coverage than ETF flows, despite representing a substantially larger and more consistent source of physical gold absorption.
Physical Bar and Coin: Retail Conviction Holds Firm
Retail physical demand came in at 307 tonnes, a decline of just 3% year-on-year despite the significant price correction during the quarter. The relative stability of bar and coin purchasing during a 14% price decline suggests retail physical buyers are operating with a time horizon considerably longer than their ETF counterparts.
In many markets, price declines actually stimulate retail physical buying as consumers recognise an opportunity to accumulate at lower cost. This behaviour pattern mirrors central bank reserve manager logic at the individual investor level, and it further reinforces gold's safe-haven role as a preferred store of value during periods of financial uncertainty.
Jewellery: Price Elasticity in Action
Jewellery fabrication fell to 278 tonnes, the lowest quarterly volume recorded since the pandemic period. The mechanism here is straightforward price elasticity: at elevated gold prices, jewellery becomes less accessible for price-sensitive consumers across major markets including India and China.
However, the total value of jewellery spending rose 14% year-on-year, as buyers shifted purchasing toward higher-quality, higher-value items. Demand contracted in volume but not in economic commitment, a distinction worth preserving in any analysis of the jewellery category.
The next major ASX story will hit our subscribers first
Gold's Monetary Architecture: Why Industrial Demand Is Almost Irrelevant to Price
Unlike silver or copper, where industrial applications can account for 50% or more of annual consumption, industrial uses represent approximately 10% of annual gold demand, according to World Gold Council data. This means gold prices are driven almost entirely by two competing forces operating on different time horizons: monetary conviction and the opportunity cost of holding a non-yielding asset.
When these two forces align, as they did during gold's multi-year bull run through the early 2020s, price appreciation can be sustained and substantial. When they diverge, as in Q2 2026, the resulting price action reflects a genuine tug-of-war between short-duration rate traders and long-duration monetary strategists.
The Q2 2026 price decline to an average of $4,506 per ounce, with spot reaching $4,047 as of July 31, 2026, represents the paper market winning that tug-of-war in the short term. According to analysis from the Brookings Institution, central bank holdings of gold serve a strategic function that transcends short-term price movements entirely.
The more analytically productive question is not which force is winning this quarter, but which group's assessment of gold's monetary role tends to be validated over a five-to-ten-year investment horizon.
Frequently Asked Questions: Gold ETF Outflows and Central Bank Buying
What caused gold ETF outflows in Q2 2026?
Gold-backed ETFs recorded net outflows of 45 tonnes in Q2 2026, driven primarily by rising inflation and rate-hike expectations in North America, a strengthening US dollar, and increasing real yield expectations. When real yields rise, the opportunity cost of holding non-yielding gold increases, prompting performance-focused ETF investors to reduce positions.
How much gold did central banks buy in Q2 2026?
Central banks purchased a net 289 tonnes in Q2 2026, a 62% increase compared to Q2 2025 and the highest volume ever recorded for any second quarter in the World Gold Council's historical data series. Poland was the largest single buyer at 51 tonnes, followed by China at 33 tonnes.
Why are central banks buying gold when prices are falling?
Reserve managers operate under multi-decade mandates rather than quarterly performance targets. Price declines represent accumulation opportunities. Sovereign buying is driven by structural concerns around reserve diversification, long-run currency debasement risk, and reduced dependence on dollar-denominated assets — concerns that are not meaningfully altered by short-term monetary policy cycles.
Is the divergence between gold ETF outflows and central bank buying unusual?
The magnitude of the divergence in Q2 2026 is historically significant. Central banks purchased more than six times the volume that ETF investors redeemed. While periods of ETF outflows alongside continued central bank buying have occurred previously, the scale of sovereign accumulation in 2026 is exceptional by historical standards.
What is OTC gold demand and why does it matter?
Over-the-counter gold demand refers to direct physical gold transactions conducted outside exchange-traded products, typically between institutional buyers, high-net-worth individuals, and sovereign entities. In Q2 2026, OTC and other investment demand reached 327 tonnes, exceeding ETF outflows by a factor of more than seven and representing one of the largest demand categories for the quarter.
Key Structural Takeaways for Investors
- The divergence reflects different mandates, not different information. ETF participants and central bank reserve managers have access to the same macro data. Their opposite conclusions reflect fundamentally different investment mandates, performance horizons, and risk frameworks.
- Volume context reframes the narrative. Central banks purchased 6.4 times more gold than ETF investors sold in Q2 2026. The ETF outflow figure dominates financial headlines but represents a fraction of total physical market activity.
- Price declines do not equal demand declines. Total gold demand including OTC held broadly flat at 1,269 tonnes in Q2 2026, and H1 2026 demand value reached a record $380 billion despite significant price weakness.
- Fed tightening cycles have historically created tactical entry points. Prior rate-hike driven gold corrections have been recovered and exceeded as policy cycles turned. The Q2 2026 decline may follow that historical pattern, though past performance carries no guarantee of future results.
- Regional ETF dynamics add a geographic layer to the analysis. Asian ETF inflows partially offset Western redemptions, indicating the headline outflow figure masks meaningful divergence within the ETF category itself.
Disclaimer: This article is for informational and educational purposes only and does not constitute financial or investment advice. Gold and precious metals investments involve risk, including the potential loss of principal. Past performance is not indicative of future results. Readers should consult a qualified financial adviser before making any investment decisions. Data cited is sourced from the World Gold Council's Gold Demand Trends Q2 2026 report, published July 30, 2026, and reflects conditions as of that date.
Want to Know Which ASX Mineral Discoveries Could Deliver the Next Major Return?
While savvy investors debate gold's monetary role across different time horizons, Discovery Alert's proprietary Discovery IQ model cuts through the noise by delivering real-time alerts on significant ASX mineral discoveries the moment they are announced — explore historic discoveries and their exceptional returns to see what early positioning can mean, then begin your 14-day free trial at Discovery Alert to secure your market-leading advantage.