July 31, 2026
When Good News Isn't Enough: The Multi-Force Framework Behind Gold's July 2026 Pullback
There is a recurring pattern in commodity markets that confounds investors who rely on single-variable analysis: assets falling on objectively bullish data. It happens with enough regularity that experienced traders have a name for it — buying the rumour, selling the fact — but July 31, 2026 presented something more structurally complex than that familiar dynamic. Gold did not simply fail to rally on good news. It opened at a month-high, briefly validated a breakout, and then surrendered those gains in hours while every fundamental indicator pointed in its favour.
Understanding why is gold falling today requires moving beyond headline reactions and into the architecture of competing macro forces. Five distinct pressures converged simultaneously on July 31, 2026, and their interaction explains not just the intraday retreat but what gold's behaviour at the $4,100 level reveals about the dominant force shaping precious metals pricing right now.
When big ASX news breaks, our subscribers know first
Force One: The Federal Reserve's Fractured Consensus
The 9-to-3 Vote and What It Actually Signals
On July 29, 2026, the Federal Reserve voted to hold interest rates unchanged. That headline, taken in isolation, would normally provide a supportive backdrop for gold. The architecture of the decision, however, told a different story entirely.
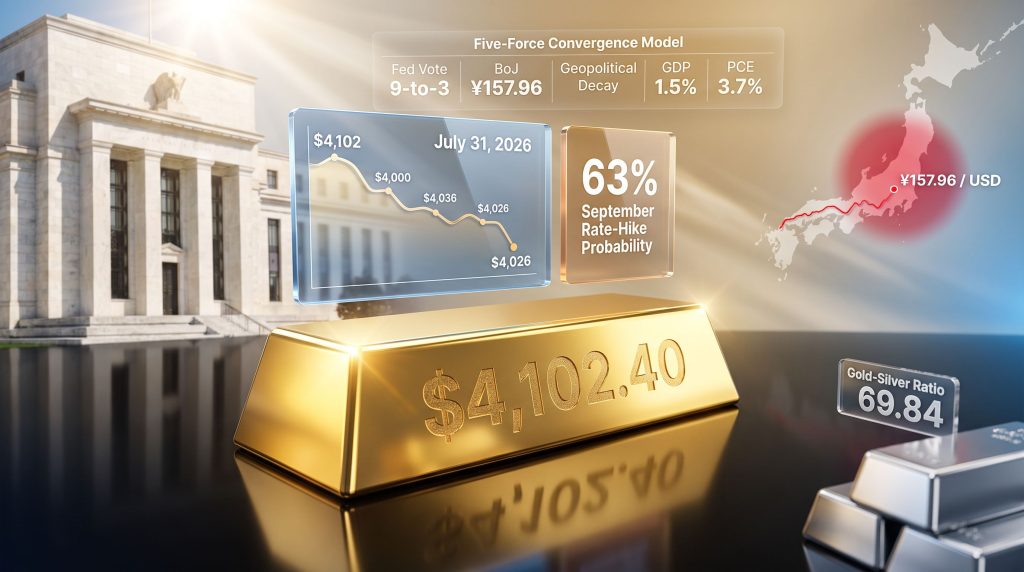
Three regional Federal Reserve presidents — Hammack, Kashkari, and Logan — dissented from the majority position and voted for an immediate rate increase. The resulting 9-to-3 split was the most divided FOMC decision since September 2016, according to CNBC reporting on the outcome. In committee voting terms, that is not a dovish hold. It is a hold that is one or two unfavourable data prints away from becoming a hike.
When the Fed holds rates but three of twelve voting members push for immediate tightening, the market is not reading the outcome — it is reading the direction. Gold trades on forward probability, not the headline decision, and forward probability on July 31 pointed hawkish.
The Real Yield Mechanism and Why It Functions as a Price Ceiling
By mid-morning on July 31, 2026, CME FedWatch data showed approximately 63% probability of a September rate hike, according to TradingEconomics. This figure is not static — it moves intraday with every economic release, employment print, and Fed communication. That dynamic quality is what makes it particularly effective at capping gold rallies.
The transmission mechanism works through real yields. When rate-hike probability rises, expected real yields on US Treasury bonds increase. Since gold produces no income, the opportunity cost of holding it rises in direct proportion. Institutional allocators running yield-sensitive portfolios will reduce gold exposure mechanically as that calculus shifts.
| September Hike Probability | Market Interpretation | Typical Gold Response |
|---|---|---|
| Below 30% | Dovish — rate cuts likely | Strong upward momentum |
| 30%–50% | Neutral — data-dependent | Range-bound with upside bias |
| 50%–70% | Hawkish lean — hike possible | Ceiling forms; rallies fade |
| Above 70% | Hike near-certain | Sustained downward pressure |
Fed Chair Warsh's public commentary following the decision was characterised as relatively measured in tone, per US News reporting from July 30, 2026. Crucially, however, institutional trading desks responded to the vote structure rather than the verbal framing. Verbal guidance is discounted sharply when the voting record contradicts it — a pattern well-established across multiple Fed cycles.
Force Two: Japan's Currency Fault Line
Why a Bank of Japan Decision Moves Gold Priced in Dollars
The Bank of Japan voted 8-to-1 on July 31, 2026 to hold its benchmark rate at 1.0%, with board member Hajime Takata dissenting in favour of an immediate increase to 1.25%, according to The Japan Times. The headline decision was expected. The context surrounding it was not.
Prior to the decision, the Japanese yen had weakened to approximately 163 per US dollar — approaching a four-decade low. A sharp subsequent move to 157.96 was consistent with government intervention, according to CNBC coverage of the event. Governor Ueda separately warned that core inflation was on track to accelerate meaningfully above the 2% target from the second half of fiscal 2026, citing three primary drivers: sustained wage growth, rising crude oil import costs, and the cumulative depreciation of the yen itself.
The significance for gold investors lies in the yen carry trade. This mechanism involves borrowing funds in low-interest-rate yen and deploying those proceeds into higher-yielding assets globally — including dollar-denominated commodities and equities. As long as Japanese rates remain suppressed, the carry trade remains intact and the dollar retains structural support against the yen. Dollar strength, in turn, makes gold more expensive for non-dollar buyers and suppresses demand.
The Tail Risk Embedded in Current Positioning: If the Bank of Japan were forced into a surprise rate increase — whether by accelerating inflation or an uncontrolled yen decline — the carry trade unwind would be rapid and disorderly. Leveraged yen-funded positions would be liquidated simultaneously, weakening the US dollar and releasing significant latent upward pressure on gold. This scenario has not materialised, but the structural conditions that would trigger it are present and growing.
The current BoJ posture creates an asymmetric setup for gold: continued inaction caps prices through dollar support, while a policy surprise could produce the opposite outcome at speed. Consequently, institutional positioning in gold has remained elevated even during a period of price consolidation.
Force Three: Geopolitical Premium Decay
How the US-Iran Pause Created a Ceiling Rather Than a Floor
Gold opened on July 31, 2026 at $4,102.40 — the first open above the $4,100 threshold since late June, according to Yahoo Finance. That opening level was partially a function of residual gold safe-haven demand following the US-Iran airstrike pause, which had held for four days. Within hours, gold retreated to near $4,026, erasing the gains entirely.
This was not an isolated occurrence. July 31 marked the third consecutive occasion in July where gold briefly reclaimed $4,100 intraday only to give back those gains before the session closed. The pattern illustrates a principle of geopolitical risk pricing that is frequently misunderstood by retail participants: geopolitical events create temporary fear premiums, not permanent price floors.
The risk premium lifecycle follows a consistent trajectory. An escalation event injects demand into gold as investors seek safety. As the situation stabilises or de-escalates, that demand recedes and the premium decays. Furthermore, when this decay coincides with an elevated rate-hike probability environment — as it did on July 31 — the two forces compound each other, accelerating the retreat from crisis-driven highs.
| Scenario | Geopolitical Condition | Fed Environment | Gold Outcome |
|---|---|---|---|
| Maximum upside | Escalation | Dovish / cutting | Sustained rally |
| Partial upside | Escalation | Hawkish / hiking | Spike then fade |
| Current scenario | De-escalation | Hawkish lean (63% hike odds) | Open high, intraday retreat |
| Maximum pressure | De-escalation | Active hiking cycle | Sustained decline |
Gold's most sustained rallies historically occur when geopolitical risk and monetary conditions align — when fear-based buying is not offset by rising opportunity costs from rate expectations. That alignment did not exist on July 31, 2026.
Force Four: The Data-Expectations Disconnect
Why a GDP Miss and PCE Drop Couldn't Override Rate Probability
Thursday's economic releases presented a genuinely supportive fundamental picture for gold. US Q2 2026 GDP grew at an annualised rate of just 1.5%, falling well short of the consensus forecast of approximately 2.1%, per Bureau of Economic Analysis data. June PCE inflation — the Federal Reserve's preferred inflation gauge — decelerated to 3.7% year-over-year, down from 4.1% in May, according to US News reporting from July 30, 2026.
Under a conventional analytical framework, both data points would be unambiguously positive for gold. Slower growth reduces the urgency for monetary tightening. Cooling inflation suggests the existing policy stance is producing results. However, gold still could not sustain a break above $4,100.
The explanation lies in what the data did not change: September rate-hike probability remained sticky near 63% despite the cooler prints. This stickiness reflects the information content of the FOMC vote. When three committee members dissent in favour of immediate hikes despite slowing growth and cooling inflation, markets reinterpret the committee's reaction function. The implication is that the hawks are responding to something beyond standard data — potentially dollar weakness, labour market resilience, or structural inflation concerns — and that the bar for removing the September hike from the table is higher than the economic data alone can clear.
A useful historical parallel exists in the 2015–2016 Federal Reserve cycle. During that period, gold began recovering meaningfully before the Fed actually paused its hiking trajectory — because forward rate-hike expectations peaked before the actual rate decisions did. The relationship between recession and gold prices during that era reinforced how macro sentiment, rather than confirmed data, tends to drive the turning points.
Force Five: The Demand Structure Divergence
What Jewellery Weakness and Physical Conviction Tell Different Stories
The World Gold Council's Gold Demand Trends Q2 2026 report reveals a demand landscape that appears contradictory on the surface but contains a clear underlying logic.
| Demand Category | Q2 2026 Volume | Year-over-Year Change | Key Driver |
|---|---|---|---|
| Jewellery consumption | 278 tonnes | Significant decline | Price sensitivity at $4,500+ average |
| Bar and coin investment | 307 tonnes | Down ~3% | Essentially stable — conviction buying |
| China H1 bar and coin demand | 314 tonnes (H1 total) | Record high | Monetary hedge positioning |
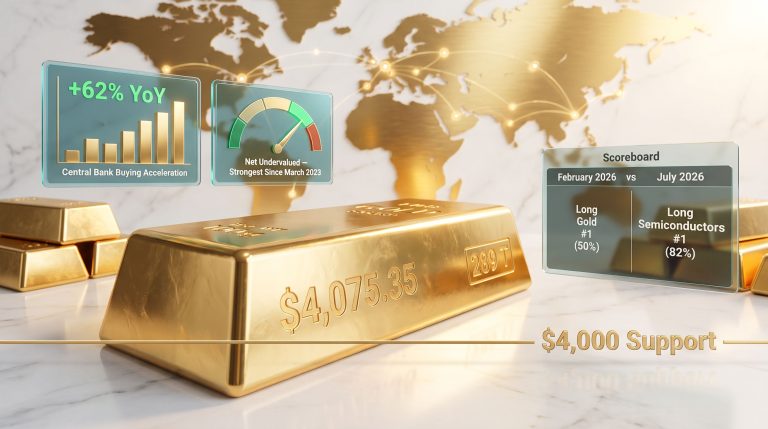
| Central bank purchases | 289 tonnes (Q2 record) | Record | Reserve diversification from USD |
Jewellery demand falling to 278 tonnes — the lowest reading since the pandemic period — sounds alarming until the price context is applied. With gold averaging above $4,500 throughout Q2 2026, consumers in India and Southeast Asia, who collectively represent the world's largest jewellery markets, responded rationally. Jewellery demand is price-elastic: it contracts predictably when gold becomes expensive relative to disposable incomes.
Physical investment demand is not governed by the same logic. Bar and coin investment held near 307 tonnes at those same elevated prices, declining only around 3% year-over-year. The buyer cohort purchasing gold bars at $4,500 per ounce is not making discretionary consumer decisions — they are making explicit monetary hedging decisions. These are investors who have concluded that the long-term risk of holding cash or sovereign bonds outweighs the short-term price risk of buying gold at elevated levels.
China's 314-tonne H1 bar and coin demand figure — a historical record — is particularly instructive in this context. Chinese retail investors have historically been price-sensitive gold buyers, pulling back when prices rise sharply. The fact that H1 2026 produced a record at prices that have historically suppressed retail buying indicates a structural shift in how gold is being categorised within Chinese household savings allocation. This aligns with the broader de-dollarisation narrative and the record central bank gold demand confirmed in the same report.
The next major ASX story will hit our subscribers first
The Silver Dimension: A Two-Engine Underperformance Problem
Why the Gold-Silver Ratio Near 70 Is Analytically Significant
Silver declined approximately 3% on July 31, 2026, reaching near $57.18, bringing its year-to-date decline to approximately 18%, per FXStreet data. The gold-silver ratio at 69.84 sits materially above the long-run average of approximately 65:1, reflecting silver's persistent underperformance relative to gold throughout the current cycle.
| Ratio Level | Historical Interpretation | Implication |
|---|---|---|
| Below 50:1 | Silver significantly outperforming | Silver in industrial/monetary bull phase |
| ~65:1 | Long-run average | Neutral relative value |
| 69–75:1 | Silver underperforming | Industrial demand concerns dominant |
| Above 80:1 | Extreme silver underperformance | Recession fears or monetary contraction |
Silver's underperformance in this environment is structurally explicable through what can be described as a two-engine problem. According to the Silver Institute's World Silver Survey 2026, approximately 58% of silver demand is industrial in nature — spanning solar panel manufacturing, semiconductor production, and electric vehicle components. When rate-hike odds are elevated and Q2 GDP prints at just 1.5%, forward industrial demand expectations soften simultaneously with the monetary headwinds that gold also faces.
Gold has one primary market role — monetary store of value. Silver has two: industrial commodity and monetary metal. When macro conditions pressurise both of those roles simultaneously, silver underperforms gold structurally. The elevated ratio is not a random fluctuation — it is a precise expression of this dual headwind. These broader precious metals market pressures have been building across multiple quarters, amplifying the divergence between the two metals.
Historically, when the ratio compresses from elevated levels, silver's recovery has tended to be sharper and faster than gold's. Mean reversion in the gold-silver ratio requires either a Fed pivot that reduces real-yield pressure, a stabilisation in industrial demand expectations, or a geopolitical development significant enough to drive monetary safe-haven buying at scale. None of those conditions were present on July 31, 2026 — but the forward-looking significance of an elevated ratio should not be dismissed.
Three Scenarios for Gold's Path Through September 2026
How the Five Forces Resolve From Here
The five forces operating simultaneously on July 31 create three distinct possible trajectories:
Scenario 1 — The Ceiling Breaks (Bullish)
- September rate-hike probability falls below 40% on deteriorating employment or inflation data
- The Bank of Japan delivers a surprise rate increase, triggering carry trade unwind and dollar weakness
- Gold reclaims $4,100 with sufficient conviction to clear the triple rejection pattern and targets the prior high near $4,500
Scenario 2 — Range-Bound Consolidation (Neutral)
- September hike probability oscillates between 55–65% without a decisive directional break
- The US-Iran situation stays de-escalated but unresolved, providing intermittent safe-haven bids without sustained momentum
- Gold trades between $3,950 and $4,100 as structurally bullish buyers and rate-sensitive sellers reach temporary equilibrium
Scenario 3 — Extended Near-Term Correction (Bearish)
- The Fed delivers a September hike; real yields rise further and dollar strengthens materially
- The yen carry trade remains intact, removing the tail risk of a sudden gold surge
- Gold tests support below $3,900; the gold-silver ratio widens toward 75:1
The Structural Floor That Distinguishes This Cycle: Central banks purchased a record 289 tonnes of gold in Q2 2026 while prices were declining throughout the quarter, per the World Gold Council. This pattern — the world's largest institutional buyers accumulating at falling prices — creates a demand floor that has not been present in prior gold bear markets. It does not prevent corrections, but it does compress their magnitude.
The $4,100 level has now produced three intraday rejections in July 2026. In technical trading frameworks, a triple rejection at a resistance level is a pattern that momentum and algorithmic traders recognise as a potential signal to accelerate selling if the level is not cleared convincingly. The nuance is that the structural buyers driving central bank and physical investment demand are fundamentally non-technical. They are not exiting positions because a chart pattern has formed. They are accumulating because their long-term analysis of monetary risk has not changed.
Frequently Asked Questions: Why Is Gold Falling Today?
Why did gold fall even though GDP missed expectations?
The Q2 2026 GDP miss of 1.5% against a 2.1% consensus forecast was genuinely bullish in isolation. However, the Federal Reserve's internal voting record — three dissents calling for immediate rate hikes — kept September rate-hike probability near 63% on CME FedWatch, maintaining the ceiling on gold regardless of what the economic data suggested. For broader context on how these dynamics unfold, Reuters market coverage provides ongoing analysis of gold's response to macro shifts.
Does a stronger US dollar always suppress gold prices?
Dollar strength raises the effective purchase cost of gold for buyers using other currencies, which typically reduces international demand and creates downward price pressure. This relationship can break down under conditions of severe systemic financial stress or when central bank demand is large enough to absorb the currency impact — but those conditions were not dominant on July 31, 2026.
What does the gold-silver ratio of 69.84 mean?
The gold-silver ratio measures how many ounces of silver are required to purchase one ounce of gold. A reading near 70 indicates silver is historically undervalued relative to gold. Periods of elevated ratio readings have historically preceded sharp silver outperformance when macro conditions shift — particularly when industrial demand stabilises and monetary conditions ease simultaneously.
What would cause gold to rally sharply from current levels?
The most analytically credible upside catalysts include: a material decline in September Fed rate-hike probability driven by labour market or inflation data, an unexpected Bank of Japan rate increase that triggers yen carry trade liquidation and dollar weakness, or a renewed geopolitical escalation that re-injects safe-haven premium at scale. Understanding why is gold falling today ultimately requires tracking how these catalysts evolve across the coming weeks.
This article is provided for informational and educational purposes only. It does not constitute financial or investment advice. Precious metals markets involve significant risk, and past performance is not indicative of future results. Readers should consult a qualified financial adviser before making any investment decisions.
Want to Know When the Next Major ASX Mineral Discovery Hits the Market?
Discovery Alert's proprietary Discovery IQ model scans ASX announcements in real time, instantly converting complex mineral data across 30+ commodities into clear, actionable insights — so subscribers are positioned ahead of the broader market the moment a significant discovery is announced. Explore historic discoveries and the substantial returns they've generated, then begin your 14-day free trial at Discovery Alert to secure your market-leading advantage.