
July 21, 2026
When the Inflation Hedge Fails: Understanding Gold's Paradox in a Rising-Rate World
Every generation of investors rediscovers the same uncomfortable truth: the assets most trusted during crises do not always behave predictably when those crises arrive. Gold occupies a unique psychological space in the investment landscape, revered as a monetary anchor across thousands of years of civilisation, yet consistently misunderstood in the short-term mechanics of how it actually responds to economic stress. The gold price breakout and inflation fears narrative dominating mid-2026 markets is a textbook demonstration of this paradox, where the very conditions expected to propel gold higher have instead, at least temporarily, worked against it.
Understanding why requires moving beyond the simple inflation-equals-higher-gold equation and into the deeper architecture of real interest rates, sovereign debt dynamics, and the structural limits of central bank credibility.
When big ASX news breaks, our subscribers know first
Why the Relationship Between Inflation and Gold Is More Complex Than Most Investors Assume
The Critical Variable Most Investors Ignore
The conventional wisdom that gold rises with inflation is not wrong, but it is dangerously incomplete. The metal's price behaviour is far more sensitive to real interest rates than to inflation in isolation. Real rates, defined as nominal interest rates minus the prevailing inflation rate, determine the true opportunity cost of holding a non-yielding asset like gold.
When inflation rises but central banks respond aggressively with rate hikes, nominal yields can outpace inflation expectations, pushing real rates higher and making gold less attractive relative to interest-bearing alternatives. This is the mechanism that has driven gold lower even as consumer prices remain elevated in 2026.
The key distinction investors must internalise is the difference between:
- Inflation rising in an environment where real rates remain negative (structurally bullish for gold)
- Inflation rising alongside aggressive monetary tightening that pushes real rates toward positive territory (short-term bearish for gold)
- Inflation persisting at levels that the central bank cannot sustainably address without triggering a debt crisis (the most powerful long-term gold catalyst of all)
The 2026 Macro Backdrop: Competing Forces
The macro environment shaping the gold price breakout and inflation fears debate in 2026 is defined by several powerful forces pulling in opposite directions.
| Macro Force | Direction | Impact on Gold |
|---|---|---|
| U.S. Consumer Inflation (fastest pace in 3 years by May 2026) | Rising | Mixed: initially supportive, then negative |
| Federal Reserve Rate Hike Probability (~60% by year-end) | Rising | Bearish: increases opportunity cost of holding gold |
| Geopolitical Conflict (Strait of Hormuz, fourth month of closure) | Escalating | Bullish short-term, inflationary medium-term |
| U.S. Dollar Strength | Elevated | Bearish for USD-priced gold |
| Sovereign Debt Deterioration | Worsening | Long-term structurally bullish |
The Strait of Hormuz closure deserves specific attention. Supply-side inflationary shocks, driven by energy disruptions rather than demand excess, are historically among the most persistent and difficult for central banks to address. Rate hikes can suppress demand but cannot reopen a blocked waterway. This type of inflation feeds through virtually every sector of the economy and, furthermore, has historically served as one of the most durable catalysts for precious metals over multi-year timeframes. As analysed in research on inflation pressures and gold markets, supply-driven inflation consistently creates complex dynamics that make straightforward monetary responses inadequate.
What Actually Happened to Gold Prices: Setting the Record Straight
From Record Highs to Six-Month Lows
Gold's 2025 surge past $4,000 was driven by a confluence of currency debasement fears, accelerating central bank accumulation, and geopolitical instability. The gold record highs of 2025 were underpinned by a unique combination of structural and cyclical tailwinds that proved difficult to sustain. By June 2026, however, the picture had changed dramatically.
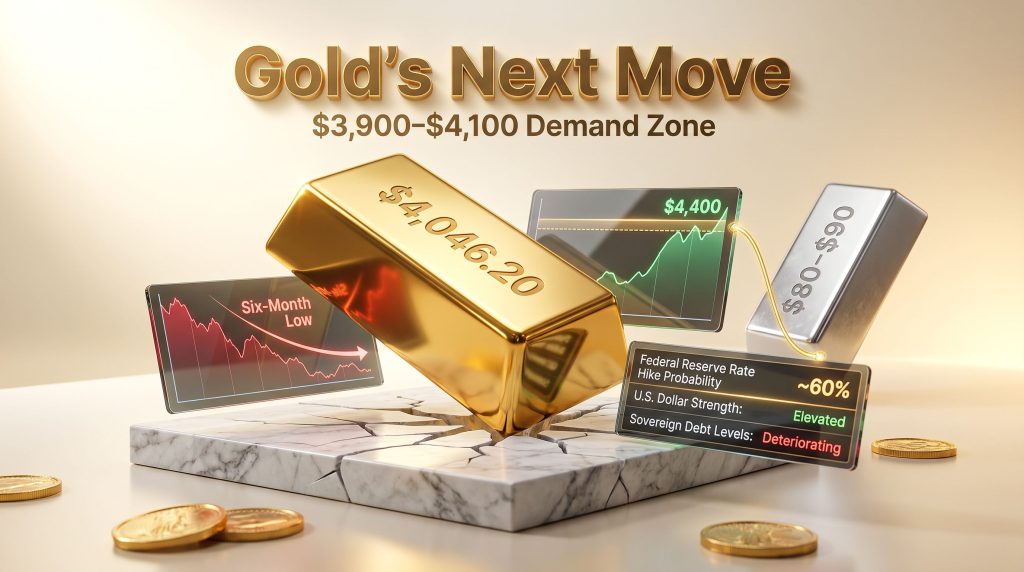
Gold fell to a six-month low of approximately $4,046, recording its worst weekly performance since 1983, with the decline erasing all year-to-date gains and representing a drawdown of roughly 15 to 20% from peak levels. A modest recovery to approximately $4,182 in early July reflected some recalibration of rate-hike expectations, but the trend remained under pressure.
Why Some Analysts Still Reference a Breakout Narrative
Confusion in the market stems partly from technical price targets established during the 2025 bull run — projections toward ranges of $3,450 to $5,170 — that were either surpassed or subsequently invalidated by the rate environment. Pattern recognition borrowed from prior precious metals bull cycles is being applied to a fundamentally different monetary backdrop.
The current technical structure in mid-2026 is not a classic breakout. It is a corrective phase following an extraordinary advance, and conflating the two creates dangerous misalignments in position sizing and risk management.
According to analysis published at Gold-Eagle.com, the $4,100 to $3,900 price zone represents approximately a 30% discount from recent highs, a rare occurrence in secular bull markets, and one that value-oriented investors have historically treated as a high-conviction accumulation window. (Gold-Eagle.com, Stewart Thomson, July 2026)
The Sovereign Debt Crisis Framework: Gold's Structural Long-Term Case
The Arithmetic That Changes Everything
The most compelling long-term argument for gold as a strategic investment in the current environment has nothing to do with inflation psychology and everything to do with fiscal mathematics. At a 10% interest rate, U.S. government interest payments would consume approximately 80% of federal revenues, according to analysis by Stewart Thomson of Graceland Investment Management, published at Gold-Eagle.com.
This arithmetic creates a structural ceiling on how aggressively the Federal Reserve can tighten monetary policy without triggering a sovereign debt spiral. This is the critical insight that separates a sophisticated gold bull thesis from a simplistic inflation hedge argument. The United States does not need to experience Venezuelan-style hyperinflation for gold to perform extraordinarily well.
The Free Market Rate Risk: A Scenario Most Investors Aren't Pricing
A largely overlooked dimension of the current gold thesis is the distinction between Fed-managed interest rates and free-market interest rates. Sophisticated investors understand that in a debt-saturated economy, it is ultimately the bond market — not the central bank — that sets the effective ceiling on sustainable borrowing costs. Furthermore, understanding gold and bond dynamics is essential to appreciating how these forces interact across different economic cycles.
| Scenario | Rate Level | Estimated Gold Response | Historical Parallel |
|---|---|---|---|
| Base Case (Fed-managed tightening) | 5.5 to 7% | Moderate pressure, range-bound | 2022 to 2023 cycle |
| Elevated Inflation Persistence | 8 to 10% | Potential re-rating higher as real rates peak | 1979 to 1980 |
| Sovereign Debt Crisis / Bond Market Revolt | 10 to 15% | Parabolic upside potential | Venezuela, Zimbabwe |
| Hyperinflationary Spiral | 15%+ | Extreme gold revaluation | Emerging market precedents |
Venezuela's government did not choose to push interest rates above 50%. It was forced there by inflation exceeding 500%. Analysis from Graceland Investment Management, published at Gold-Eagle.com, suggests the directional dynamics of fiscal excess in the United States share structural similarities with these historical precedents, however, they operate from a fundamentally different starting point.
Important Disclaimer: The scenarios outlined above represent tail-risk analysis and speculative modelling, not base-case forecasting. Investors should seek advice from multiple qualified financial advisors before making allocation decisions based on extreme scenario analysis.
QE's Regime Change: From Deflationary Tool to Inflationary Risk
One of the most consequential and underappreciated shifts in the current macro environment is the changed nature of quantitative easing as a policy instrument. During the 2008 to 2020 deflationary period, QE primarily inflated financial asset prices with limited transmission to consumer prices. The mechanism worked because excess money creation was absorbed by financial markets rather than flowing directly into the real economy.
In the current inflationary environment, additional monetary stimulus would operate as an accelerant on consumer prices already running hot. This regime change fundamentally alters the policy toolkit available to central banks and significantly increases the probability of sustained above-target inflation over a multi-year horizon. For gold investors, this represents a structural shift in the macro backdrop, not a temporary cyclical fluctuation.
Is the Current Gold Pullback a Buying Opportunity or a Structural Breakdown?
Technical Analysis: Reading the $3,900 to $4,400 Range
From a technical standpoint, gold's corrective structure in mid-2026 has followed a recognisable pattern across three distinct downward waves affecting gold, silver, and gold mining equities simultaneously. According to analysis published at Gold-Eagle.com, the penetration of the primary downtrend line is technically significant, with the next meaningful resistance level sitting near $4,400.
Step-by-Step: Interpreting the Three-Wave Correction in Gold (2026)
- Wave 1 Down: Initial rejection from all-time highs as Federal Reserve rate hike rhetoric intensified through early 2026
- Wave 2 Down: Price acceleration lower as successive inflation data prints confirmed hawkish Fed positioning
- Wave 3 Down: Capitulation selling as geopolitical risk from the Strait of Hormuz conflict failed to sustain a traditional safe-haven bid
- Current Position: Potential base formation developing within the $3,900 to $4,100 demand zone
- Recovery Target: A sustained close above $4,400 would constitute trend reversal confirmation and attract momentum capital
Value Investors vs. Momentum Investors: Different Entry Strategies
The corrective phase has created a divergence in optimal entry strategies depending on investor type and time horizon.
| Investor Type | Preferred Entry Zone | Risk Profile | Time Horizon |
|---|---|---|---|
| Value / Contrarian | $3,900 to $4,100 (current demand zone) | Higher short-term volatility tolerance | 12 to 36 months |
| Momentum / Technical | Above $4,400 (trend confirmation) | Lower drawdown tolerance | 6 to 18 months |
| Macro / Structural | Any level, staged accumulation | Long-duration, high conviction | 3 to 10 years |
The staged accumulation approach — systematically buying into price weakness across multiple tranches — reduces timing risk in volatile markets and aligns with how institutional capital typically builds precious metals positions. Position sizing within diversified portfolios for precious metals exposure typically ranges from 5 to 20%, weighted according to individual risk tolerance, investment horizon, and existing portfolio construction.
Silver and Gold Mining Equities: Are the Leveraged Plays Signalling a Broader Recovery?
Silver's Technical Setup
Silver's daily chart structure turned constructive following the accumulation phase at the gold demand zone, with technical momentum pointing toward an initial target near $80 and extended potential toward $90, based on analysis published at Gold-Eagle.com. Silver's dual role as both a monetary metal and a critical industrial input for solar panels, electric vehicles, and electronics provides an additional demand support layer that gold does not possess.
The gold-silver ratio remains one of the most useful tools for relative value positioning between the two metals. When silver begins outperforming gold on a ratio basis, it historically signals that speculative and momentum capital is returning to the broader precious metals complex.
Gold Mining Equities: Three Technical Signals to Watch
- CDNX Index (Canadian Venture Exchange): All primary technical indicators shifted to constructive readings, suggesting junior mining sentiment has turned
- GDX (Gold Miners ETF): Key buy zones have been identified with historical patterns suggesting 20%+ gains achievable from current levels in recovery scenarios, according to Gold-Eagle.com commentary
- GDX vs. All-Time Highs: A challenge or breach of prior GDX all-time highs is a plausible outcome if gold sustains above $4,400
Mining equities typically exhibit two to four times leverage to the underlying gold price in trending markets, amplifying both upside and downside. A critical and often underappreciated dynamic is that gold mining stocks frequently bottom and begin recovering ahead of the spot gold price, because equity markets discount future cash flows rather than current prices. When miners begin systematically outperforming gold on a relative basis, it is often an early signal that institutional capital is pre-positioning for a broader precious metals recovery.
The next major ASX story will hit our subscribers first
What Would It Take for Gold to Reach $5,000, $9,000, or Beyond?
Scenario Modelling: Conditions Required for Each Price Level
| Gold Price Target | Required Macro Conditions | Probability Assessment | Timeline |
|---|---|---|---|
| $4,400 | Downtrend line break, Fed pivot signals | Moderate to High | 3 to 9 months |
| $5,000 | Rate hike cycle peaks, real rates turn negative | Moderate | 12 to 24 months |
| $7,000 | Sovereign debt crisis materialises, dollar confidence erodes | Low to Moderate | 3 to 7 years |
| $9,000 | Systemic monetary disorder, rates at 9%+ with inflation exceeding that level | Low (tail risk) | 5 to 15 years |
| $15,000 | Hyperinflationary spiral, bond market revolt, sustained fiat credibility collapse | Very Low (extreme tail) | Generational |
The $9,000 scenario is particularly instructive. It does not require rates to be low. It requires inflation to be higher than rates, meaning real rates remain deeply negative even as nominal rates reach historically elevated levels. This is precisely the dynamic that defined the late 1970s gold bull market, when gold rose from under $200 to over $800 between 1977 and 1980 despite nominal interest rates climbing sharply throughout the period.
The Rate-Inflation Paradox Explained
The conceptual key to understanding gold's long-term trajectory rests on a single inflection point: the moment when markets conclude the Federal Reserve cannot raise rates sufficiently to control inflation without simultaneously triggering a fiscal or financial crisis. Before that inflection, rate hikes suppress gold. After it, gold becomes the primary monetary anchor in a system where fiat credibility has been structurally compromised. In-depth market commentary consistently highlights this tension as the defining variable for gold price direction in the current cycle.
Frequently Asked Questions: Gold Price Breakout and Inflation Fears
Is gold a reliable inflation hedge in 2026?
Gold's effectiveness as an inflation hedge depends heavily on the real interest rate environment. The metal works best when real rates are negative, meaning inflation exceeds the nominal yield available on competing assets. When inflation triggers rate hike expectations that outpace inflation itself, gold faces structural headwinds regardless of the absolute inflation level.
Why did gold fall to a six-month low despite high inflation?
The primary driver was a sharp increase in Federal Reserve rate hike expectations reaching approximately 60% probability by year-end 2026. Rate hike expectations strengthen the U.S. dollar and increase the opportunity cost of holding non-yielding gold, creating downward price pressure irrespective of the prevailing inflation backdrop.
What is the key technical level to watch for gold's recovery?
The $4,400 level represents the next significant resistance zone. A sustained close above this level would signal a potential trend reversal. The $3,900 to $4,100 range functions as the primary demand zone for value-oriented accumulation strategies.
How does U.S. sovereign debt affect the long-term gold outlook?
At a 10% interest rate, U.S. government interest payments would consume approximately 80% of federal revenues, creating a structural ceiling on how aggressively rates can rise without triggering a debt spiral. This fiscal constraint represents one of the most powerful structural arguments for gold over multi-year and multi-decade timeframes.
Should investors buy gold mining stocks or physical gold?
Both serve fundamentally different purposes within a portfolio. Physical gold provides direct monetary insurance with no counterparty risk. Mining equities offer leveraged exposure, typically two to four times the gold price movement, but carry operational, geopolitical, jurisdictional, and management execution risks. A balanced approach incorporating both, weighted according to risk tolerance and investment horizon, is the framework most consistent with long-term capital preservation objectives.
The Bigger Picture: Fiscal Excess, Monetary Disorder, and Gold's Enduring Role
Why Sovereign Debt Dynamics Dwarf All Other Variables
The short-term noise around rate hike probabilities and monthly inflation prints obscures what is arguably the most important structural variable in the precious metals market: the trajectory of sovereign debt and its implications for long-term monetary credibility.
Across historical precedents spanning centuries of monetary history — from the debasement of Roman currency through to modern emerging market currency crises — the pattern is consistent. Fiscal excess is ultimately resolved through one of two mechanisms: currency debasement or outright default. Gold has retained value across every one of these episodes precisely because it exists outside the liability structure of any government.
The current macro environment, characterised by historically elevated sovereign debt levels, persistent inflation, geopolitical instability, and the structural limits of central bank policy, represents a backdrop that is fundamentally supportive of gold over multi-year timeframes. This holds true even if the gold price breakout and inflation fears dynamic continues to generate short-term price volatility driven by competing rate expectations.
The 2026 gold price correction is best understood not as a failure of the inflation hedge thesis, but as a temporary dislocation caused by the lag between inflation recognition and the monetary policy response cycle. The structural case for gold, rooted in sovereign debt arithmetic, fiscal deterioration, and the limits of central bank credibility, remains intact over a multi-year horizon. The question for serious investors is not whether to hold gold, but at what price levels and in what form to build that exposure.
This article is intended for informational and educational purposes only and does not constitute financial advice. All price forecasts, scenario analyses, and technical projections involve significant uncertainty. Past performance of any asset class does not guarantee future results. Investors should consult qualified financial advisors before making any investment decisions. Readers seeking ongoing precious metals market analysis may find value in the commentary published at Gold-Eagle.com.
Want to Stay Ahead of the Next Major Mineral Discovery Before the Market Moves?
While gold's macro dynamics reward patience and structural thinking, the real asymmetric opportunity often lies in identifying significant ASX mineral discoveries the moment they are announced — and that is precisely what Discovery Alert delivers, powered by its proprietary Discovery IQ model, which instantly transforms complex mineral data into actionable insights for both traders and long-term investors. Explore Discovery Alert's dedicated discoveries page to understand how historic mineral discoveries have generated extraordinary market returns, and begin your 14-day free trial today to position yourself ahead of the broader market.