June 13, 2026
The Hidden Paradox at the Heart of Every Inflation Trade
Precious metals markets operate on a logic that confounds casual observers: the very economic condition that gold is supposed to protect against can, in the short run, become its most dangerous adversary. Inflation, in isolation, is a tailwind for gold. Inflation filtered through the Federal Reserve's reaction function is an entirely different beast. When rising price data forces policymakers toward a more restrictive stance, the transmission mechanism reverses, and traders who entered gold as an inflation hedge case find themselves selling into a rate-driven correction. This is the environment gold navigated during the week of June 12, 2026, and understanding why it unfolded this way reveals far more than any single price chart.
When big ASX news breaks, our subscribers know first
Gold Pulls Back as Inflation Pressure Reprices the Fed Path: The Week in Context
Where Prices Stood and How the Week Shaped Up
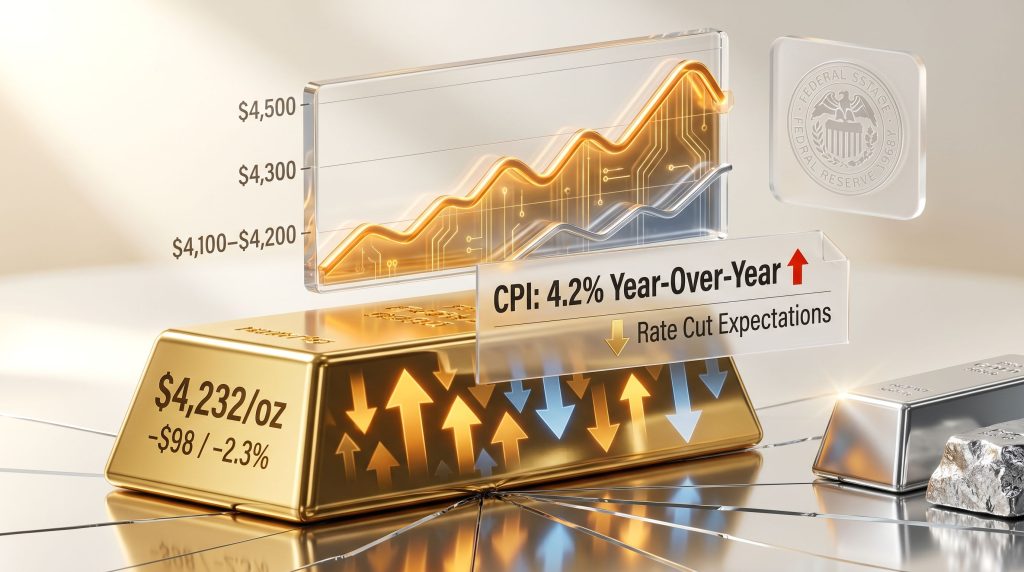
Spot gold entered the week already carrying the bruises of the prior Friday's stronger-than-expected employment report. By Friday morning, the damage deepened, with the metal trading near $4,232/oz, representing a decline of approximately $98/oz from the prior week's close near $4,330. That marks a weekly loss of roughly 2.3%, meaningful in context because it confirmed that the $4,500 zone, which had served as a consolidation area through much of June, was now behaving more like overhead resistance than a floor.
| Metric | Value (Week of June 12, 2026) |
|---|---|
| Spot Gold (Friday Morning) | ~$4,232/oz |
| Prior Week's Close | ~$4,330/oz |
| Weekly Change | ~–$98/oz (approx. –2.3%) |
| Recent Resistance Zone | ~$4,500/oz |
| Spot Silver | ~$68.57/oz |
| Silver Weekly Change | +$0.75/oz |
| Platinum Weekly Change | ~–4% |
| Palladium Weekly Change | ~+6% |
The decline was not disorderly. Buyers re-entered below the midweek lows, providing some late-session repair. However, that rebound was insufficient to reverse the broader week's direction, which was set early when inflation data landed hotter than the market was positioned for.
The May CPI Print: More Than Just a Headline Number
Why 4.2% Year-Over-Year Matters Beyond the Data Point Itself
The May Consumer Price Index confirmed annual inflation running at 4.2% year-over-year, the highest reading since 2023. Energy prices were the primary contributor to the headline acceleration. For gold traders, however, the significance of this number extended well beyond the data itself. What mattered was the policy inference the market was forced to draw from it.
A critical distinction often overlooked by newer market participants is that sticky inflation has a different effect on gold depending on where policymakers are in their reaction cycle. When a central bank has already pivoted toward easing, inflation can reinforce gold's appeal as a hard asset. When a central bank is on hold and inflation surprises to the upside, the calculus flips: rate cut expectations get pushed further out, real yields move higher, and the opportunity cost of holding a non-yielding asset like gold rises accordingly. Furthermore, the relationship between gold and bond yields plays a critical role in shaping how this pressure transmits through the market.
The relationship between inflation and gold is not linear. It is mediated entirely by the Federal Reserve's response, and that response depends on the cumulative weight of data, not any single print.
This week, the CPI print combined with the prior week's strong jobs report to create a compounding effect. The labor market was already telling the Fed it had no urgent reason to cut. Then inflation confirmed it had no comfortable room to do so either.
The Two Channels Through Which Rate Expectations Punish Gold
When inflation data forces a hawkish repricing of the Fed path, gold faces pressure through two interlocking mechanisms:
- The real yield channel: Nominal Treasury yields move higher in anticipation of a prolonged hold or potential tightening. Adjusted for inflation expectations, real yields rise, directly increasing the cost of holding zero-coupon assets like gold relative to interest-bearing Treasuries.
- The dollar channel: A more hawkish Fed outlook strengthens the US Dollar. Since gold is priced globally in dollars, a stronger greenback raises the effective cost for international buyers, compressing demand and applying downward price pressure across commodity markets more broadly.
Both channels were active this week, though the dollar's impact moderated somewhat toward the latter half as geopolitical headlines shifted and yields eased late in the trading period. For a broader look at how higher yields raise holding costs, this dynamic is well documented across multiple market cycles.
The Fed's Blackout Period: When Data Speaks Louder Than Guidance
Institutional Silence and Its Amplifying Effect on Price Sensitivity
One underappreciated structural factor this week was the Federal Reserve's pre-meeting quiet period. During the blackout window preceding a scheduled FOMC decision, policymakers are restricted from making public statements on policy. This institutional silence eliminates a key moderating force in markets: the Fed's ability to jawbone rates or contextualise data in a way that softens market reactions.
Without official guidance available, traders defaulted to the most direct interpretation of incoming data. A 4.2% CPI print, viewed through that unmediated lens, pointed clearly toward a prolonged hold at minimum. The market had to price that interpretation without any countervailing commentary from policymakers, which amplified the data's downward impact on gold.
The June FOMC meeting, falling on Wednesday of the following week, represents Fed Chair Kevin Warsh's first decision in the chair role. Traders are not anticipating a rate change. What the market is scrutinising is the rhetorical architecture of the accompanying statement and press conference, specifically how new leadership frames the balance between persistent inflation and labor market resilience.
Key questions traders will be watching at the June FOMC:
- How does the Warsh-led Fed characterise the durability of the energy-driven inflation component?
- Does the statement signal increased tolerance for above-target inflation, or does it lean toward a more restrictive forward bias?
- What language, if any, frames the timing of future rate adjustments?
- Is there any signal that the new leadership views the current rate stance as sufficiently restrictive?
Geopolitics: A Competing and Complicating Force
The US-Iran Situation and Its Dual Impact on Gold's Price Structure
Geopolitical risk added a second and deeply contradictory layer to this week's price action. Developments around the US-Iran relationship, including reports of a ceasefire framework and the cancellation of planned military strikes, created a cross-current dynamic that made directional trading more complex throughout the week.
The dual-impact mechanism works as follows:
- Reduced risk premium: Any easing of tensions in the Strait of Hormuz region strips out the geopolitical safe-haven demand premium that had been embedded in gold prices above $4,400. This applies direct downward pressure.
- Indirect macro relief: Lower geopolitical risk reduces upward pressure on crude oil prices, which in turn moderates energy-driven inflation expectations. If oil subsides, the inflation impulse weakens, and the case for a more aggressive Fed posture softens slightly.
| Force | Effect on Gold | Direction |
|---|---|---|
| 4.2% CPI print | Raises hawkishness expectations | Bearish short-term |
| Strong prior-week jobs data | Reduces urgency for rate cuts | Bearish short-term |
| US-Iran de-escalation | Removes geopolitical risk premium | Bearish short-term |
| Lower crude oil prices | Reduces inflation impulse | Mixed |
| USD softening late in week | Reduces currency headwind | Mildly bullish |
| Treasury yield easing (late week) | Reduces real-rate pressure | Mildly bullish |
| Structural central bank demand | Supports long-term floor | Bullish long-term |
The table above illustrates why this was not a straightforward trading week. Multiple forces were pulling in opposing directions, and the market's resolution — net lower for gold — reflected the dominance of the rate repricing narrative over the geopolitical and currency dynamics.
Silver's Resilience and the PGM Divergence: Reading the Signals
Why Silver Outperformed Gold During a Precious Metals Selloff
While gold fell approximately 2.3% on the week, spot silver closed marginally higher at around $68.57/oz, gaining roughly $0.75/oz from the prior Friday. This divergence is not accidental. It reflects silver's structural advantage in an environment where the primary headwind is monetary rather than growth-driven. In addition, tracking the gold-silver ratio during periods like this can reveal important signals about relative value and investor sentiment across the precious metals complex.
Silver's dual identity as both a monetary metal and an industrial commodity provides a partial buffer against rate-driven gold selloffs. Unlike gold, silver draws demand from:
- Solar panel manufacturing and photovoltaic installations, where silver demand has grown substantially as renewable energy infrastructure expands globally.
- Electronics and semiconductor applications, where silver's exceptional electrical conductivity makes it irreplaceable.
- Physical investment demand from retail participants who view silver as a more accessible entry point into precious metals.
- Industrial hedging by manufacturers who require physical silver in production processes.
This industrial underpinning means silver prices do not respond purely to monetary conditions. Even when the rate environment pressures monetary metals, robust manufacturing expectations or supply constraints in industrial channels can provide a demand floor that gold simply does not possess.
What the Platinum-Palladium Split Tells Macro Investors
The divergence within the platinum group metals was equally instructive. Platinum fell roughly 4% on the week while palladium surged more than 6%, a split that underscores a critical analytical point: this was not a broad precious metals selloff. It was a targeted macro repricing concentrated in monetary metals, while PGMs continued to trade primarily on their individual supply-demand fundamentals and industrial end-use dynamics.
Palladium's outperformance, for instance, reflects persistent tightness in its primary supply sources and ongoing automotive catalyst demand, factors largely decoupled from the Federal Reserve's rate path. Treating the entire precious metals complex as a monolithic macro trade is one of the most common errors retail investors make.
The next major ASX story will hit our subscribers first
Three Scenarios for Gold After the June FOMC Decision
How Different Fed Outcomes Could Shape the Price Path
With the June FOMC decision serving as the near-term catalyst, the range of outcomes for gold is meaningfully wide. The following scenario framework captures the most probable paths:
Scenario 1: Hawkish Hold (Most Likely)
The Fed maintains rates, explicitly acknowledges persistent inflation, and provides no forward guidance suggesting imminent easing. Real yields remain elevated, the dollar finds renewed support, and gold faces continued pressure toward the $4,100 to $4,200 range.
Scenario 2: Neutral Hold with Balanced Language
The Fed holds rates but characterises the inflation acceleration as energy-driven rather than broad-based, preserving optionality for future easing. Rate cut expectations are partially restored, and gold stabilises, potentially recovering into the lower $4,300s.
Scenario 3: Unexpected Dovish Signal (Low Probability)
Despite the CPI print, the new Fed leadership signals openness to easing later in the year. Gold stages a more aggressive recovery attempt toward the $4,400 to $4,500 resistance zone, though this outcome would require either a major shift in tone or a substantially weaker set of subsequent economic data.
Is This Correction Structural or Cyclical? The Long-Term Case for Gold
Structural Demand Forces That Remain Intact Beneath the Short-Term Noise
The week's price action, while notable, does not in isolation challenge the longer-term structural thesis that has underpinned gold's multi-year ascent. Several demand foundations remain firmly in place:
- Central bank accumulation: Emerging market central bank buying has been consistently net positive for gold reserves, driven by a deliberate strategy of reducing US dollar concentration risk. This institutional demand provides a persistent bid that is relatively insensitive to short-term rate movements.
- Sovereign debt concerns: Elevated and rising debt levels across major developed economies sustain the case for hard asset allocation as a hedge against long-run currency debasement risk.
- Geopolitical fragmentation: Multi-polar tensions across multiple regions maintain a structural baseline of safe-haven demand that does not evaporate during temporary de-escalation episodes.
- Practical limits on real yield expansion: There is a ceiling to how high real yields can realistically rise before economic growth deteriorates to a degree that compels a policy pivot, which would consequently reverse the pressure on gold.
Several macro strategists have distinguished between cyclical rate-driven corrections and longer-term structural bull markets in gold. The pattern observed this week — a short-term selloff driven by Fed repricing rather than a collapse in physical demand or central bank accumulation — fits more closely with the former than the latter.
The $4,300 Level: Technical Battleground With Macro Implications
From a price structure perspective, the $4,300 area has emerged as the critical near-term decision point. A recovery and sustained hold above this level following the FOMC decision would suggest the current decline represents a corrective reset within an intact longer-term uptrend. Failure to defend this zone would shift attention toward how aggressively real-rate expectations continue to expand and at what price level physical and institutional buying re-enters the market with sufficient scale to stabilise the trend. According to what drives the price of gold, these technical thresholds interact closely with underlying macro forces rather than existing independently of them.
Key Risk Factors That Could Extend or Reverse the Correction
Upside Inflation Risks That Could Force a More Aggressive Fed Posture
- Renewed escalation in Middle East energy supply routes pushing crude materially higher.
- Persistent services inflation remaining above the Fed's long-run comfort zone.
- Second-round wage effects flowing from a resilient labor market.
- Supply chain disruptions re-emerging from geopolitical fragmentation across trade corridors.
Downside Risks to Gold's Short-Term Price Outlook
- Additional strong employment or inflation data prints before the subsequent FOMC meeting.
- A more hawkish-than-anticipated press conference from Chair Warsh.
- Continued de-escalation in geopolitical hotspots diminishing safe-haven demand.
- Sustained dollar strength compressing commodity prices across the board.
Frequently Asked Questions: Gold, Inflation, and the Fed Rate Path
Why does gold fall when inflation data is released?
Higher-than-expected inflation data reduces the probability of near-term rate cuts. When rate cut expectations diminish, real Treasury yields tend to rise and the dollar often strengthens. Both dynamics increase the opportunity cost of holding gold, applying short-term downward pressure even though the longer-term inflation hedge case remains structurally intact.
What is the relationship between real yields and gold prices?
Real yields represent nominal interest rates adjusted for inflation expectations. When real yields rise, interest-bearing assets like Treasury bonds become comparatively more attractive than a non-yielding asset like gold. This inverse relationship is one of the most consistent and well-documented dynamics in precious metals markets.
How does the US dollar affect gold prices?
Gold is globally priced in US dollars. When the dollar strengthens, gold becomes more expensive for buyers holding other currencies, reducing international purchasing power and suppressing demand. Dollar weakness has the opposite effect, making gold more affordable globally and consequently supporting prices.
Is silver a safer bet than gold during Fed tightening cycles?
Silver's industrial demand component can provide relative resilience during periods when monetary headwinds dominate gold. However, silver also carries greater volatility than gold and is more sensitive to global growth expectations, making it a higher-risk alternative rather than a straightforward safe harbour during macro uncertainty.
Key Takeaways for the Week
- May CPI at 4.2% year-over-year was the primary catalyst for the week's gold decline, forcing a hawkish repricing of Fed rate path expectations.
- Gold fell approximately $98/oz to trade near $4,232/oz, representing a weekly loss of roughly 2.3%, even after late-session buyers provided partial repair.
- The $4,500 zone has transitioned from consolidation support to overhead resistance, with near-term focus now on whether $4,300 can be defended following the FOMC decision.
- Silver's modest outperformance reflects its industrial demand component buffering against purely monetary metal headwinds.
- The June FOMC meeting under Chair Kevin Warsh is the next major directional catalyst, with markets more focused on policy language than the rate decision itself.
- Structural long-term support from central bank buying, fiscal dynamics, and geopolitical fragmentation remains intact, positioning this correction as more likely cyclical than a fundamental trend reversal. Gold pulls back as inflation pressure reprices the Fed path, yet the underlying demand architecture that has defined this multi-year bull market has not materially changed.
This article is intended for informational and educational purposes only and does not constitute financial advice. Precious metals markets involve significant risk, and past price behaviour is not indicative of future results. Readers should conduct independent research and consult a qualified financial professional before making investment decisions. Price data referenced reflects conditions during the week of June 12, 2026.
Want To Stay Ahead of the Next Major ASX Mineral Discovery?
While gold navigates complex macro headwinds, Discovery Alert's proprietary Discovery IQ model scans ASX announcements in real time, delivering instant alerts on significant mineral discoveries so subscribers can identify actionable opportunities before the broader market reacts — explore historic discovery returns to see what's possible, then begin a 14-day free trial at Discovery Alert to secure a market-leading edge.