June 9, 2026
When Rate Expectations Trump Everything: Understanding Gold's Vulnerability to Labour Market Data
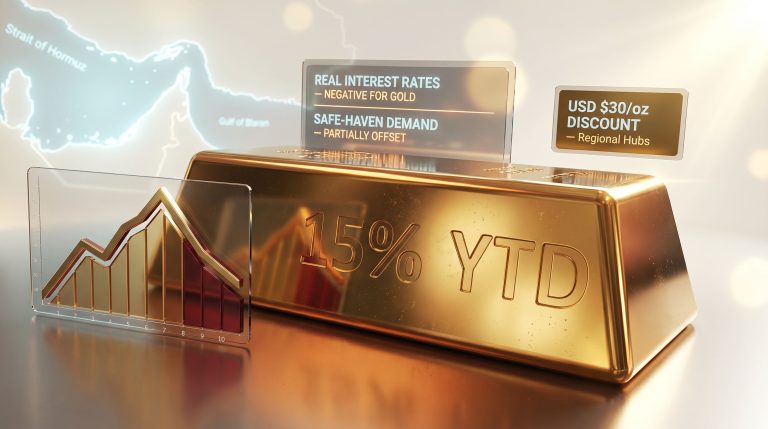
Precious metals markets operate within a web of competing forces, but few dynamics carry as much short-term disruptive power as a sudden and decisive shift in Federal Reserve rate expectations. Gold, despite its reputation as a timeless store of value and safe-haven inflation hedge, is deeply sensitive to the interest rate environment precisely because it generates no income. When the opportunity cost of holding it rises sharply, capital moves quickly, and the selloff can be both steep and swift.
That tension was on full display in early June 2026, when gold falls to a 2-month low on strong US jobs data became the defining market headline of the week, wiping out weeks of accumulated gains across the entire precious metals complex in just two trading sessions.
When big ASX news breaks, our subscribers know first
What the Numbers Actually Showed on June 8, 2026
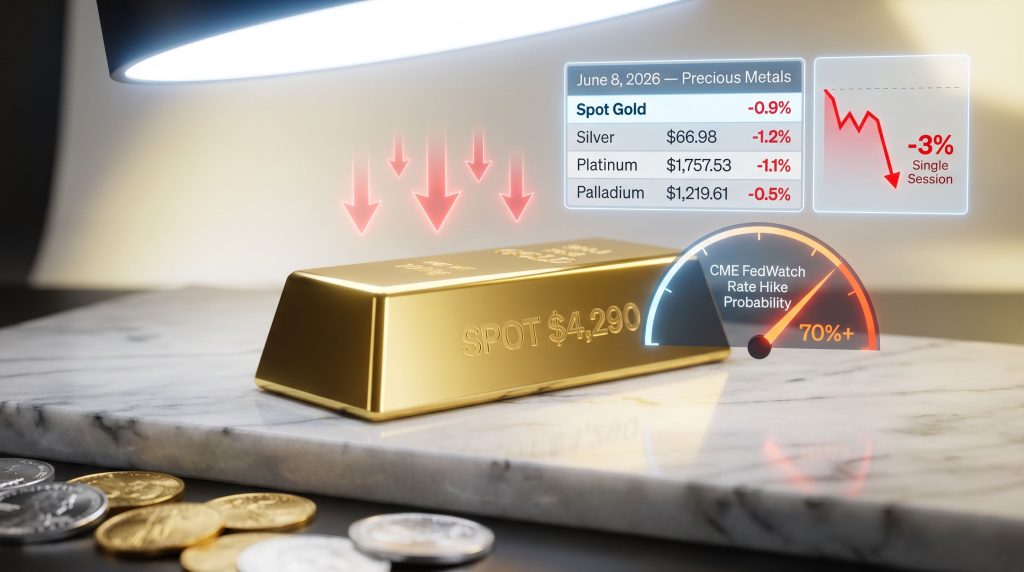
By mid-morning London time on Monday June 8, spot gold had declined 0.9% to $4,290.66 per ounce, touching its weakest level since March 23. This followed an even more dramatic session on Friday, when the metal shed more than 3% in a single day after the US Bureau of Labor Statistics released its May employment report. August gold futures extended the losses, falling 1.1% to $4,315.40, confirming that bearish momentum had migrated from spot markets into the forward curve.
The breadth of the selloff across precious metals was telling. Rather than a gold-specific technical breakdown, the uniformity of losses pointed to a macro-driven repricing event:
| Metal | Price | Change |
|---|---|---|
| Spot Gold | $4,290.66/oz | -0.9% |
| Gold Futures (Aug) | $4,315.40 | -1.1% |
| Spot Silver | $66.98/oz | -1.2% |
| Platinum | $1,757.53/oz | -1.1% |
| Palladium | $1,219.61/oz | -0.5% |
Silver's sharper decline relative to gold is itself instructive. Silver carries a higher beta to industrial demand and macro risk sentiment, meaning it tends to amplify moves that originate in the monetary policy channel. Furthermore, when silver falls harder than gold, it often signals that the selling pressure is fundamentally rate-driven rather than a flight from precious metals as a category. The gold-silver ratio widened noticeably during this episode, reinforcing that interpretation.
The Jobs Report That Reshuffled the Policy Outlook
The catalyst for this repricing was the US non-farm payrolls figure for May 2026, which came in at 172,000 new jobs, following an upwardly revised 179,000 in April. The double beat, both the headline print and the prior-month revision, created a compounding effect on market expectations.
Context matters here. Earlier in 2026, January payrolls had already surprised to the upside, rising 130,000 against a consensus estimate of just 66,000, with the unemployment rate holding at 4.3%. The cumulative weight of sequentially strong employment reports left markets with a difficult conclusion: the US economy is not softening in the way that would justify near-term monetary easing.
Strong employment data doesn't just delay rate cuts. When prints consistently exceed forecasts, they force a fundamental reassessment of the entire rate trajectory, and that repricing hits non-yielding assets like gold disproportionately hard.
The CME FedWatch Tool, which derives Fed policy probabilities from federal funds futures pricing, captured this recalibration with precision. Within a single week:
- The probability of a Fed rate hike by December 2026 rose from approximately 45% to more than 70%
- A swing of 25 percentage points in a single week represents an extraordinary shift in market consensus
- The benchmark 10-year US Treasury yield jumped to a two-week high, directly raising the opportunity cost of holding gold
The Mechanics of How Employment Data Moves Gold
Understanding why this transmission occurs with such consistency requires stepping through the causal chain. Gold's inverse relationship with real interest rates is not a coincidence of market psychology but a structural feature of how the asset is valued.
- Strong employment data is released, signalling economic resilience beyond consensus expectations
- Fed rate cut probability falls, or rate hike probability rises, as policymakers face reduced justification for easing
- Treasury yields climb in response to revised policy expectations
- The US dollar strengthens, because higher yields attract foreign capital into dollar-denominated assets
- Gold becomes more expensive for non-USD buyers, suppressing international demand
- The opportunity cost of holding gold rises relative to yield-bearing Treasuries and money market instruments
- Institutional capital rotates out of gold and into income-generating alternatives
This sequence is not speculative. Research on gold's relationship with real interest rates, particularly the real 10-year Treasury yield, consistently shows a strong negative correlation over multi-year periods. When real yields rise, gold tends to fall, and vice versa. The June 2026 episode was this dynamic playing out in compressed, accelerated form.
The Real Yield Factor: A Less-Discussed Driver
Most retail commentary focuses on nominal interest rates when explaining gold price movements. However, sophisticated market participants pay closer attention to real yields, which are nominal rates adjusted for inflation expectations.
When the May jobs data was released, it simultaneously raised nominal rate expectations while doing little to dampen inflation concerns, particularly given the geopolitical backdrop. This kept real yields elevated in a way that created persistent headwinds for gold, even for investors who hold the metal primarily as an inflation hedge.
This is a nuance frequently missed in mainstream analysis: gold can fall even in an inflationary environment if real yields are rising, because rising nominal rates are outpacing the increase in inflation expectations. It is the gap between the two that matters, not the absolute level of either. Consequently, the gold and bonds relationship becomes particularly complex during these periods of recalibration.
The Geopolitical Wildcard: Why Middle East Tensions Didn't Save Gold
Under conventional market logic, escalating geopolitical risk should have provided a floor beneath gold prices. Military exchanges between Israel and Iran represent exactly the kind of instability that historically triggers safe-haven demand for the metal.
Yet the safe-haven bid failed to materialise in sufficient size to offset the monetary policy headwinds. The reason lies in the inflation channel. When geopolitical tensions push oil prices higher rather than triggering a deflationary demand shock, the net effect on gold shifts from bullish to ambiguous or even bearish.
When geopolitical risk feeds directly into energy prices and inflation, the Federal Reserve's policy response becomes more hawkish, not less. In this scenario, the inflation hedge argument for gold competes directly against the rising opportunity cost argument, and the latter frequently wins in the short term.
This dynamic creates a counterintuitive situation where the same geopolitical events that might intuitively seem bullish for gold end up reinforcing the very monetary policy conditions that suppress it. Indeed, gold slips weekly despite such tensions, as the Middle East instability in June 2026 appears to have done exactly that, pushing crude oil higher and complicating the Fed's path toward any form of easing.
Historical Parallels: NFP Beats and the Gold Price Record
The June 2026 episode sits within a clear historical pattern. Non-farm payrolls reports that materially exceed consensus estimates have repeatedly triggered sharp gold selloffs when accompanied by a significant shift in Fed policy expectations. What distinguished this episode was the speed and size of the probability swing captured by FedWatch.
| Market Condition | Typical Gold Response | June 2026 Outcome |
|---|---|---|
| NFP significantly above consensus | Bearish (rate hike fears) | Confirmed, 3%+ Friday decline |
| Treasury yields spike post-NFP | Bearish (opportunity cost rises) | Confirmed, 10yr yield at 2-week high |
| USD strengthens on strong data | Bearish (USD-denominated asset) | Confirmed, dollar strengthened |
| Geopolitical risk escalates | Bullish (safe-haven demand) | Partially offset by inflation channel |
| Fed rate cut probability drops sharply | Bearish (yield advantage of alternatives grows) | Confirmed, 45% to 70%+ hike probability |
A Structural Note on Gold's Dual Identity
One of the more intellectually interesting aspects of gold's current market position is the tension within its own investment thesis. Gold is simultaneously marketed as an inflation hedge and a safe-haven asset, but these two roles can pull in opposite directions when the macro environment is complex.
When inflation rises because of demand strength and tight labour markets, the appropriate monetary policy response is rate hikes, which are bearish for gold. When inflation rises because of supply shocks, the policy response is less clear, and gold may benefit. The May 2026 payrolls data represented the former scenario: labour market strength driving inflation fears, which in turn drove rate hike expectations, which suppressed gold. In addition, central bank gold demand may provide a longer-term counterweight to these short-term monetary policy headwinds, though it rarely offsets them in the immediate term.
The next major ASX story will hit our subscribers first
Three Scenarios for Gold Through the Rest of 2026
Disclaimer: The following scenario analysis involves forward-looking statements and market speculation. Past price relationships do not guarantee future outcomes. Investors should conduct independent research before making any investment decisions.
Scenario 1: Labour Market Remains Resilient (Bearish for Gold)
If subsequent employment reports confirm the May trend, the Federal Reserve has limited justification to ease. In this environment, elevated real yields and a strong dollar create persistent headwinds. The $4,200 level becomes a realistic downside target for spot gold, and the precious metals complex broadly faces continued selling pressure from institutional rotation toward fixed income.
Scenario 2: Employment Data Softens (Neutral to Bullish for Gold)
A meaningful cooling in job creation over the coming months would reduce the probability weighting assigned to rate hikes, relieve upward pressure on Treasury yields, and allow gold to recover toward the $4,400 to $4,500 range. This scenario would likely be triggered by a combination of weaker NFP prints and rising initial jobless claims data.
Scenario 3: Geopolitical Escalation Dominates (Conditionally Bullish)
A significant deterioration in Middle East stability that disrupts global oil supply chains at scale could generate sufficient deflationary demand shock dynamics to support gold as a genuine safe-haven. However, as June 2026 demonstrated, this outcome requires the geopolitical shock to suppress economic activity rather than amplify inflation. A supply disruption that crushes growth expectations would be far more supportive for gold than one that merely raises energy costs. The broader gold price forecast through the remainder of 2026 hinges substantially on which of these scenarios plays out.
Key Technical and Sentiment Levels to Monitor
With spot gold having broken below the psychologically significant $4,300 level on a closing basis, the technical picture has shifted meaningfully. Several markers are worth tracking:
- The late-March 2026 support zone near $4,290 to $4,300 now becomes resistance on any recovery attempt
- The two-day cumulative decline of approximately 4% represents one of the sharper short-term pullbacks gold has experienced in 2026, and typically such moves are followed by a period of consolidation before direction is re-established
- The futures curve now prices August delivery at $4,315.40, suggesting the market is not aggressively pricing a near-term recovery
- Subsequent NFP releases, Federal Reserve communications, and Middle East developments represent the three primary catalysts most likely to resolve the current directional ambiguity
Investor Psychology in a Data-Dependent Market
The 25-percentage-point swing in rate hike probability within a single week is a useful reminder of how extreme the current data dependency in monetary policy has become. Markets are not operating on a stable long-term thesis. They are recalibrating their entire forward rate expectations with each major data release, which amplifies volatility in rate-sensitive assets like gold.
For longer-term gold investors, this environment creates both risk and opportunity. Short-term volatility driven by monthly data releases may create entry points that do not reflect the structural case for gold over multi-year horizons. However, timing those entries requires either a high tolerance for drawdown or significant conviction in the macroeconomic scenarios that would ultimately be bullish for the metal.
FAQ: Gold, US Jobs Data, and Federal Reserve Policy
Why does gold fall when US jobs data is strong?
Strong employment data reduces the probability of Federal Reserve rate cuts and raises the possibility of rate hikes. Higher interest rates increase the opportunity cost of holding non-yielding gold relative to Treasuries and other income-generating assets, prompting institutional rotation away from the metal.
What is the CME FedWatch Tool and why does it matter for gold investors?
The CME FedWatch Tool calculates the implied probability of Federal Reserve rate decisions using federal funds futures pricing. It provides a real-time gauge of market consensus on monetary policy direction. A sharp move in FedWatch probabilities, such as the swing from 45% to over 70% rate hike probability following the May 2026 payrolls data, signals a fundamental repricing that affects gold, bonds, and currencies simultaneously.
How much did gold actually fall after the May 2026 jobs report?
Spot gold lost more than 3% on the Friday of the report's release, then extended those losses by a further 0.9% on Monday June 8, 2026, bringing the two-day total decline to approximately 4% and pushing prices to their lowest point since late March. This episode, in which gold falls to a 2-month low on strong US jobs data, stands as one of the more significant short-term corrections of the year.
Does geopolitical instability always push gold higher?
Not reliably. When geopolitical events drive energy prices higher and amplify inflation expectations, they can reinforce central bank hawkishness, which is net bearish for gold. The safe-haven bid for gold is most powerful when geopolitical shocks are deflationary in nature, such as those that threaten to suppress global growth rather than raise input costs.
Which other precious metals were affected by the June 2026 selloff?
The selloff was broad-based across the precious metals complex. Silver fell 1.2% to $66.98/oz, platinum declined 1.1% to $1,757.53/oz, and palladium dropped 0.5% to $1,219.61/oz, confirming that macro rate-expectation dynamics rather than gold-specific factors were the primary driver of the move.
Want to Stay Ahead of the Next Major Mineral Discovery on the ASX?
Discovery Alert's proprietary Discovery IQ model delivers real-time alerts on significant ASX mineral discoveries, instantly translating complex data across more than 30 commodities into clear, actionable insights for investors at every level — explore historic discovery returns to understand the scale of opportunity, then begin your 14-day free trial at Discovery Alert to position yourself ahead of the market.