June 23, 2026
The Hidden Earnings Machine: Why Gold Mid-Tier Miners Fundamentals Are Rewriting the Rulebook
Across multiple commodity cycles, a consistent pattern emerges in resource equity markets: the strongest earnings leverage rarely belongs to the largest operators. Instead, it concentrates in the segment that sits between the speculative fragility of early-stage exploration and the bureaucratic inertia of billion-ounce giants. In gold mining, this middle ground is occupied by mid-tier producers, and the financial results flowing out of Q1 2026 represent the most compelling case for gold mid-tier miners fundamentals in the sector's modern history.
When big ASX news breaks, our subscribers know first
How Gold Mining Companies Are Classified by Production Scale
Understanding gold mid-tier miners fundamentals requires a clear grasp of how the industry stratifies itself. Production output, measured in annual ounces, determines which tier a company occupies, and each tier carries distinct risk-reward characteristics.
| Production Tier | Annual Output (oz) | Quarterly Equivalent | Key Characteristics |
|---|---|---|---|
| Junior | Under 300,000 | Under 75,000 | High-risk, exploration-driven, limited operational scale |
| Mid-Tier | 300,000 to 1,000,000 | 75,000 to 250,000 | Balanced risk-reward, strong growth leverage |
| Major | 1,000,000 to 2,000,000 | 250,000 to 500,000 | Economies of scale, lower agility |
| Super-Major | Over 2,000,000 | Over 500,000 | Vast scale, persistent depletion pressures |
Mid-tier operators typically run between one and four active mines simultaneously. This structural characteristic is more significant than it might first appear. When a producer of this scale commissions a new mine or expands an existing operation, the incremental output represents a meaningful percentage of total production, creating disproportionate earnings leverage.
Why Smaller Market Capitalisations Amplify Returns
The average market capitalisation of the top 25 holdings in the GDXJ VanEck Junior Gold Miners ETF currently sits at approximately $9.9 billion, compared to roughly $33.2 billion for comparable major miner peers. This difference is not trivial from an investor perspective. Furthermore, those evaluating the broader gold market outlook will recognise that lower market capitalisations create conditions where even modest capital inflows can drive meaningful re-ratings.
Lower market capitalisations mean:
- Less capital is required to drive meaningful stock price appreciation during gold uplegs
- New mine commissioning events can materially shift the production profile in ways structurally impossible at super-major scale
- Earnings growth translates more directly into share price re-rating
- Institutional and retail capital inflows have amplified impact on smaller float sizes
Mid-tier miners occupy a structural sweet spot: carrying significantly less operational fragility than juniors while retaining far more growth optionality than majors burdened by depletion at aging, lower-grade deposits.
Q1 2026: A Quarter That Shattered Every Historical Benchmark
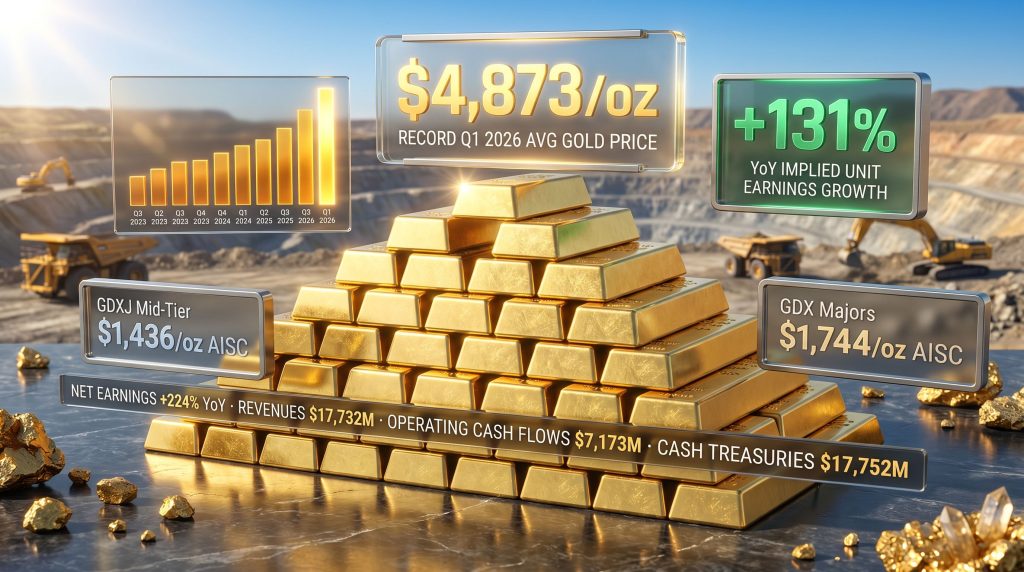
The primary catalyst for the extraordinary Q1 2026 results across the mid-tier gold mining sector was a gold price environment unlike anything previously recorded. The quarterly average gold price reached $4,873 per ounce, representing a 70.0% year-over-year increase. No amount of cost management alone generates the earnings profile that emerged from this period. The gold price outlook has consequently never been more consequential for mid-tier valuations.
The Implied Unit Earnings Framework: Cutting Through the Noise
One of the most analytically useful tools for evaluating gold mid-tier miners fundamentals is the implied unit earnings metric. This is calculated by subtracting the group's average all-in sustaining cost (AISC) per ounce from the prevailing quarterly average gold price. Unlike bottom-line accounting earnings, this approach strips out the distortions created by non-cash impairment charges, acquisition-related write-downs, and asset disposals.
| Metric | Q1 2025 | Q1 2026 | Year-over-Year Change |
|---|---|---|---|
| Average Gold Price (per oz) | ~$2,866 | $4,873 | +70.0% |
| GDXJ Top-25 Average AISC (per oz) | ~$1,378 | $1,436 | +4.2% |
| Implied Unit Earnings (per oz) | ~$1,488 | $3,437 | +131.0% |
| Total Revenues | ~$9,517m | $17,732m | +86.3% |
| Net Earnings | ~$1,359m | $4,405m | +224.0% |
| Operating Cash Flows | ~$3,016m | $7,173m | +137.9% |
| Cash Treasuries | ~$10,727m | $17,752m | +65.5% |
The core takeaway is this: while gold prices surged 70%, costs rose only 4.2%, creating an enormous expansion in profitability per ounce that flowed almost entirely to the bottom line.
Eleven Consecutive Quarters of Compounding Earnings Growth
What makes the Q1 2026 result even more structurally significant is that it did not emerge in isolation. It represents the eleventh consecutive quarter of year-over-year implied unit earnings growth for the mid-tier sector, a streak beginning in Q3 2023 that has compounded dramatically over time.
- Q3 2023: +106%
- Q4 2023: +133%
- Q1 2024: +63%
- Q2 2024: +63%
- Q3 2024: +71%
- Q4 2024: +95%
- Q1 2025: +91%
- Q2 2025: +79%
- Q3 2025: +82%
- Q4 2025: +102%
- Q1 2026: +131%
This trajectory represents something rarely seen in resource equities: a sustained, multi-year fundamental upgrade cycle, not a brief price spike followed by mean reversion. For a detailed breakdown of how gold equities performance correlates with these cycles, the underlying data tells a compelling story.
The Cost Structure Advantage: Mid-Tiers vs. Majors
A widely misunderstood aspect of gold mid-tier miners fundamentals is their cost competitiveness relative to much larger operators. Conventional wisdom suggests that scale generates cost efficiency. In gold mining, however, this assumption frequently fails.
| Cost Metric | GDXJ Top-25 (Mid-Tiers) | GDX Top-25 (Majors) | Mid-Tier Advantage |
|---|---|---|---|
| Q1 2026 Average AISC | $1,436/oz | $1,744/oz | ~$308/oz lower |
| Year-over-Year AISC Change | +4.2% | +24.9% | Dramatically more stable |
| Full-Year 2026 AISC Guidance | ~$1,762/oz | Higher | Controlled forward outlook |
Why Super-Majors Struggle with Cost Discipline
Super-majors face a structural cost inflation problem rooted in geology rather than management. Their deposits are predominantly large, low-grade ore bodies that require processing enormous volumes of rock to extract each ounce. As the highest-grade sections of these deposits deplete over time, operators must process increasing volumes at lower grades, driving fixed costs across fewer recoverable ounces.
Mid-tiers avoid this trap because:
- Smaller operations allow selective feeding of higher-grade ore into processing plants during periods of lower throughput
- Tighter organisational structures reduce administrative cost overhead
- Growth through targeted expansion rather than replacement of depleted mega-deposits
- Active management of ore grade sequencing within individual mines to optimise quarterly unit economics
According to mid-tier gold miner fundamentals analysis, this structural cost advantage has persisted across multiple gold price cycles and is not simply a function of the current elevated price environment.
The Royalty Cost Distortion: What the Headlines Miss
A critical nuance in interpreting Q1 2026 cost data involves royalty payment escalation. Royalty contracts are frequently structured as a percentage of the prevailing gold price. When gold surges 70% year-over-year, royalty obligations scale proportionally, mechanically inflating reported cash costs and AISCs without reflecting any genuine deterioration in operational efficiency.
This distortion was clearly illustrated by two cases within the GDXJ top-25 universe:
One major mid-tier producer reported total Q1 2026 cash costs of approximately $1,608 per ounce. However, when royalty payments of roughly $407 per ounce were stripped out, underlying operational cash costs fell to just $1,201 per ounce. Royalties alone accounted for more than one-quarter of reported cash costs.
A second mid-tier operator paid royalties at three of its four operating mines. These payments increased approximately 4.6 times year-over-year, adding roughly $100 per ounce to reported cash costs. This was entirely royalty-driven, with no corresponding deterioration in mine-level operational performance.
This distinction matters significantly for investors conducting year-over-year cost comparisons. The apparent cost escalation in Q1 2026 substantially overstates genuine operational cost pressure once the royalty component is properly understood.
The Buenaventura Anomaly and Reported AISC Distortions
It is worth noting that one GDXJ component, Buenaventura, reported negative AISC figures in Q1 2026 due to its polymetallic production structure. As a producer of silver, copper, zinc, and lead alongside gold, it credits substantial byproduct revenues against its reported gold costs. Gold accounted for less than one-third of Buenaventura's Q1 revenues, yet the company continues to report in gold-centric terms, creating extreme statistical distortions. Excluding this outlier from both comparable quarters, the GDXJ top-25 average AISC increased 22.2% year-over-year to a record $1,844 per ounce, a rise still dominated by royalty escalation rather than operational cost inflation.
The Valuation Paradox: Record Earnings, Historic Lows in P/E Multiples
Perhaps the most analytically striking feature of the current mid-tier gold landscape is the simultaneous occurrence of record profitability and historically compressed valuation multiples. The GDXJ top-25 components are currently trading at trailing twelve-month price-to-earnings ratios of approximately 16.9 times, the lowest valuations recorded across at least a decade of systematic sector analysis.
This creates a genuinely unusual investment environment. The sector is simultaneously:
- Reporting record revenues of $17.7 billion for a single quarter
- Generating record operating cash flows of $7.2 billion
- Holding record cash treasury positions of $17.75 billion
- Trading at its cheapest earnings-relative valuation in over ten years
Understanding Why the Re-Rating Has Been Delayed
Several structural factors explain why the fundamental improvement has not yet fully translated into valuation re-rating. Consequently, a range of undervalued mining stocks continue to trade well below levels that their underlying cash generation would historically justify.
- Sentiment lag: Institutional capital typically rotates into gold equity only after sustained price strength has been established, creating delayed re-rating cycles
- Royalty cost misinterpretation: Investors focusing on headline AISC increases without understanding the royalty mechanism systematically overestimate true operational cost pressure
- Volatility aversion: Q1 2026 featured extreme intraday swings, including a significant single-day drawdown event that discouraged capital with lower risk tolerance
- Hedging penalties: Producers with legacy hedging programs that locked in sales prices well below spot gold were structurally disadvantaged
- Sector complexity barrier: Distinguishing between royalty-inflated costs and genuine operational costs requires analytical depth that prevents broader participation
When a sector simultaneously delivers record earnings, record cash flows, record balance sheet positions, and record revenues, yet trades at its lowest price-to-earnings multiple in over a decade, the case for fundamental revaluation is difficult to rationally dismiss.
Seasonal Production Patterns and Their Impact on Cost Analysis
A frequently overlooked dimension of gold mid-tier miners fundamentals is the consistent seasonal pattern in global gold production. Q1 has historically represented the cyclical production trough, a pattern confirmed across 15 years of World Gold Council data.
| Quarter | Average Sequential Production Change (15-Year Historical) |
|---|---|
| Q1 | -8.4% (seasonal trough) |
| Q2 | +4.9% |
| Q3 | +6.2% |
| Q4 approximately flat | ~0.0% |
The Q1 2026 global production decline of 8.6% quarter-over-quarter aligned almost precisely with this historical average, confirming the pattern's persistence rather than signalling any operational deterioration.
Why Winter Seasonality Mechanically Inflates Q1 Costs
The mechanism behind Q1 production weakness is primarily climatic. More than two-thirds of the Earth's total landmass lies in the northern hemisphere, where winter conditions impede mining operations through multiple channels: extreme cold reduces equipment efficiency and worker productivity, heavy precipitation can disrupt open-pit operations, and chemical recovery processes perform less efficiently at lower temperatures.
Since gold mine operating costs are predominantly fixed in nature, lower Q1 ore volumes spread those fixed costs across fewer ounces. The result is mechanically elevated Q1 per-ounce cost metrics that normalise as output recovers through Q2 and Q3. For investors considering gold mining stocks, understanding this seasonal dynamic is essential to avoid misreading Q1 cost data as genuine operational deterioration.
The next major ASX story will hit our subscribers first
Forward Earnings Outlook: Q2 2026 Projections
With gold averaging approximately $4,681 per ounce through mid-Q2 2026, the forward earnings trajectory for mid-tier miners remains highly constructive even under conservative assumptions.
| Scenario | Q2 2026 Avg Gold Price | Estimated AISC | Implied Unit Profit | YoY Growth vs. Q2 2025 |
|---|---|---|---|---|
| Conservative | $4,600/oz | $1,750/oz | ~$2,850/oz | ~+49% |
| Base Case | $4,700/oz | $1,700/oz | ~$3,000/oz | ~+57% |
| Upside | $4,800/oz+ | $1,650/oz | ~$3,150/oz+ | ~+65%+ |
The seasonally stronger Q2 production profile, with historical output recovering approximately 4.9% quarter-over-quarter from the Q1 trough, should furthermore provide meaningful downward pressure on per-ounce costs relative to Q1 levels. Independent analysis of Q3 2025 gold miner fundamentals supports the view that this earnings momentum has structural rather than transitory origins.
The GDXJ as a Mid-Tier Exposure Vehicle
Despite its branding as a junior miner ETF, the GDXJ VanEck Junior Gold Miners ETF functions primarily as a mid-tier gold miner exposure vehicle. With approximately $8.2 billion in net assets, it is the second-largest gold equity ETF globally. The top 25 holdings account for 65.7% of total weighting, and of these, only a small minority qualify as true junior producers by the sub-75,000 quarterly ounce threshold.
Critically, only two of the current top-25 holdings, Endeavour Mining and Harmony Gold Mining, qualify as major-tier producers. This composition makes GDXJ structurally superior as a vehicle for capturing mid-tier growth dynamics compared to the GDX, where super-major and major holdings dominate the upper weightings and apply persistent depletion-related drag to overall performance metrics.
Key Risks to Monitor
A balanced assessment requires acknowledging the material risks that could challenge the current earnings trajectory:
- Gold price reversal: A sustained gold price decline toward the $3,000 to $3,500 per ounce range would materially compress implied unit profits
- Royalty escalation continuation: If gold prices remain elevated, royalty obligations will continue scaling proportionally, creating a persistent structural headwind
- Operational and jurisdictional risks: Mid-tier producers operating across multiple countries face regulatory change, resource nationalism, and infrastructure risks
- Legacy hedging constraints: Producers with fixed-price hedging programs at materially below-spot levels are structurally unable to capture the full benefit of elevated gold prices
- Valuation multiple compression: Even with record earnings, a broader equity market de-risking event could compress gold equity multiples independently of operational performance
Disclaimer: This article is intended for informational purposes only and does not constitute financial advice. All forecasts, projections, and forward-looking statements involve inherent uncertainty. Past performance of any sector, index, or individual company is not indicative of future results. Readers should conduct their own due diligence and consult a licensed financial advisor before making investment decisions.
Want to Know When the Next Major ASX Gold Discovery Hits the Market?
Discovery Alert's proprietary Discovery IQ model delivers real-time alerts on significant ASX mineral discoveries, instantly converting complex geological data into actionable investment insights for both short-term traders and long-term investors — explore historic discovery returns to understand just how transformative early positioning can be, then begin your 14-day free trial at Discovery Alert to secure your edge before the broader market moves.