June 16, 2026
The Structural Shift Reshaping PGM Production Economics
The economics of platinum group metal production have quietly undergone a fundamental transformation over the past decade. While conventional deep-level mining operations in South Africa grapple with escalating electricity costs, labour disputes, and infrastructure degradation, a quieter revolution has been unfolding at surface level. Tailings retreatment operations, once considered marginal contributors to the PGM supply chain, have matured into genuine production powerhouses. Understanding this shift is essential context for evaluating what Sylvania Platinum production guidance and PGM prices actually signal for the broader sector.
When big ASX news breaks, our subscribers know first
What Sylvania Platinum's FY2026 Guidance Upgrade Really Means
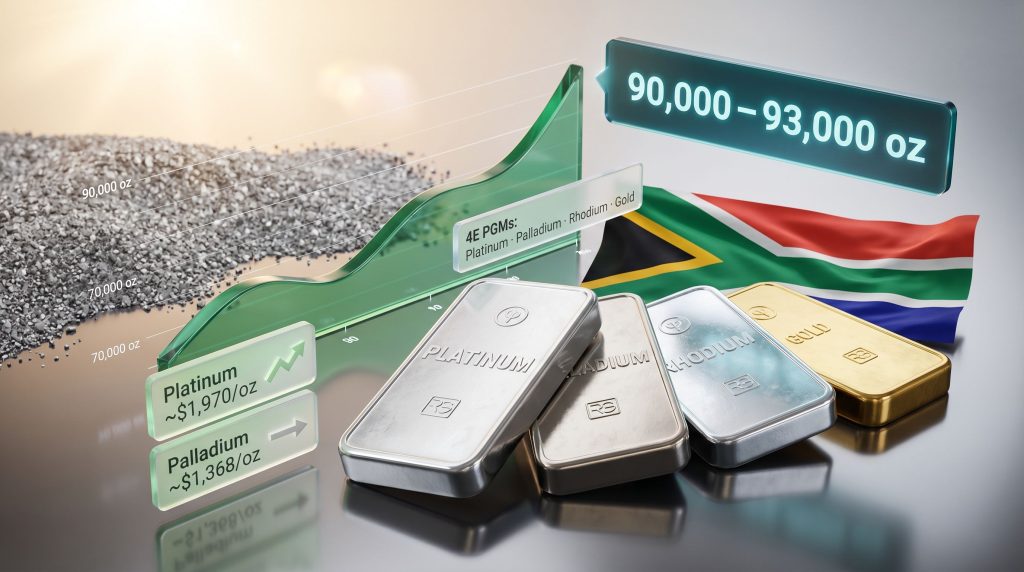
Two consecutive upward revisions to annual production guidance within a twelve-month window is unusual in the mining industry, where conservative forecasting and downward revisions tend to dominate. Sylvania Platinum has done the opposite, lifting its FY2025 guidance from 73,000-76,000 oz to 75,000-78,000 oz, and then stepping guidance up substantially to 90,000-93,000 oz of 4E PGMs for FY2026. That cumulative revision represents more than a 20% increase relative to where management originally set the bar.
The company has since indicated it is likely to achieve or exceed the upper bound of that range. To appreciate the magnitude of this shift, consider that Sylvania's historical average output across recent years hovered around 70,000 oz per year. Moving toward 93,000 oz or beyond represents a roughly one-third increase in annual production volume, driven not by a new mine or a capital-intensive expansion project, but by operational optimisation of existing surface processing infrastructure.
This pattern of consistent upward revision carries a distinct message for investors: management's initial guidance assumptions are deliberately conservative, and the operational delivery track record consistently exceeds those starting points. Over time, that philosophy builds a form of credibility that is genuinely scarce in the junior-to-mid-cap resources space. Edison Group's research on Sylvania further reinforces this assessment of the company's guidance trajectory.
Understanding the 4E PGM Basket and Why Composition Matters
The term 4E PGMs refers to a combined ounce figure encompassing platinum, palladium, rhodium, and gold. This designation is standard across South African PGM reporting and reflects the reality that these metals are recovered together from the same processing circuit rather than in isolation.
For investors, the critical nuance is that the revenue realised per combined ounce is not a single metal price but a blended basket rate, weighted by the relative proportion of each metal in the recovered output. This creates an important dynamic:
- Platinum typically commands the largest share of Sylvania's basket value by volume contribution
- Palladium has historically driven outsized revenue swings due to its price volatility
- Rhodium carries extreme price sensitivity given its thin market liquidity and concentrated automotive demand
- Gold provides a partial hedge against weakness in the other three components
When platinum strengthens but palladium simultaneously softens, the net effect on basket revenue per ounce can be modest or even negative. Revenue analysis that focuses on any single metal in isolation will systematically mislead investors about Sylvania's actual earnings exposure.
How the Sylvania Dump Operations Model Works
Tailings Retreatment: A Technical Explanation
Chrome mining in South Africa's Bushveld Igneous Complex generates enormous volumes of fine-grained waste material during the processing of chromite ore. Historically, this material was deposited in surface dumps and tailings storage facilities, with PGMs present in concentrations that were either uneconomic or technically difficult to recover using the processing technology available at the time.
Sylvania's Sylvania Dump Operations (SDO) model exploits a straightforward but often underappreciated opportunity: these historical tailings contain recoverable PGM concentrations that are now accessible through modern dense media separation and flotation techniques. Because the material is already excavated, surface-accessible, and does not require blasting, ground support, or ventilation infrastructure, the capital and operating cost profile is fundamentally different from conventional mining.
Key distinctions of the SDO model include:
- No underground development or open-pit stripping costs
- Feed material is already fragmented and partially processed, reducing comminution energy requirements
- Surface operations are less susceptible to seismic risk, which is a meaningful consideration in the deeper Bushveld operations
- Environmental footprint is limited to processing rather than new resource extraction
- Water and reagent consumption per ounce produced is generally lower than primary milling circuits
The SDO circuit produced 39,398 oz of 4E PGMs in the six months ending December 31, 2024, establishing the production run-rate trajectory that underpins the FY2026 guidance range.
The Thaba Joint Venture: Opportunity and Timing Complexity
Beyond the core SDO operations, the Thaba joint venture represents Sylvania's primary near-term growth vehicle. The JV adds both chrome concentrate production and incremental PGM recovery capacity to the portfolio, however its integration has progressed more gradually than initial modelling suggested.
This has created a dual effect on reported metrics: chrome by-product revenue targets required downward revision as the ramp-up timeline extended, while PGM recovery rates during the early integration phase did not immediately reflect the steady-state potential of the combined operation. For investors monitoring quarterly reports, it is important to distinguish between operational delays in a growth asset and structural underperformance in the core business. The SDO base remains on an upward trajectory regardless of Thaba timing.
PGM Price Dynamics in 2025-2026: A Market in Transition
Where Prices Stand and Why the Divergence Between Metals Matters
The current PGM price environment is characterised by a notable divergence between platinum and palladium that has significant implications for basket revenue calculations. Furthermore, understanding these supply constraints in the PGM market is equally essential for contextualising price movements.
| Metal | Approximate Price (May 2026) | Key Demand Driver | Recent Trajectory |
|---|---|---|---|
| Platinum | ~$1,962-$1,970/oz | Autocatalysts, hydrogen technology, jewellery | Multi-year recovery underway |
| Palladium | ~$1,368-$1,376/oz | Gasoline autocatalysts | Declining from prior-cycle highs |
| Rhodium | Highly variable | Autocatalysts (three-way) | Demand-sensitive, thin market |
| Gold | ~$3,200-$3,300/oz | Monetary, investment, jewellery | Elevated on macro uncertainty |
Price data sourced from publicly available commodity market platforms including Trading Economics and Johnson Matthey PGM market reports. Subject to intraday and daily movement.
The Platinum Recovery Thesis
Platinum's resurgence from the multi-year discount it traded at relative to palladium reflects several converging forces. The automotive sector's gradual pivot toward hybrid and hydrogen fuel cell vehicles is beginning to favour platinum over palladium, given that platinum is the preferred catalyst in proton exchange membrane (PEM) fuel cells. In addition, the broader platinum and palladium market dynamics heading into 2025 and beyond are reshaping how investors assess basket-priced producers.
Tightening autocatalyst standards in China and Europe are furthermore lifting platinum loadings per vehicle even within traditional internal combustion engine applications. The platinum-palladium price spread, which reached historically extreme levels during palladium's 2021-2022 bull run, has narrowed substantially. This normalisation benefits basket-priced producers less than it might appear, because it reflects palladium weakness rather than platinum strength alone.
South African Supply Constraints: The Structural Tailwind for Tailings Operators
Primary PGM mine output in South Africa continues to face persistent headwinds that provide an indirect pricing benefit to all producers, including tailings retreatment operations. Consequently, mining's broader transformation through electrification and decarbonisation is adding further complexity to the primary supply picture:
- Scheduled and unscheduled electricity interruptions (load-shedding) increase operating costs and reduce shaft hoisting capacity at deep-level operations
- Labour cost escalation has compressed margins at conventional producers, limiting reinvestment capacity
- Safety-related stoppages and Section 54 notices from the Department of Mineral Resources and Energy periodically curtail production at shaft-based operations
- Water availability constraints affect processing continuity at operations reliant on fresh water supply
Tailings retreatment operations carry a meaningful structural cost advantage in this environment. The absence of deep-level infrastructure requirements, lower labour intensity per ounce produced, and reduced exposure to seismic and safety incidents create a fundamentally different cost profile.
Financial Performance Drivers and Revenue Sensitivity
Modelling the Basket Price Impact at 90,000-93,000 Ounces
The relationship between PGM basket prices and Sylvania's revenue is relatively straightforward to model at a high level, though the USD/ZAR exchange rate introduces a second-order amplification effect that is often underappreciated by investors outside South Africa.
Because PGMs are priced and sold in US dollars while Sylvania's operating costs are predominantly denominated in South African rand, rand depreciation against the dollar expands rand-denominated revenue without any change in metal prices or production volumes. Conversely, rand appreciation compresses revenue realisations in local currency terms. This dual-lever effect means that basket price analysis in isolation understates or overstates the actual rand revenue outcome in any given quarter.
A simplified revenue sensitivity framework at the FY2026 guidance midpoint of 91,500 oz:
| Basket Price Assumption (USD/oz) | Implied Annual Revenue (USD, approx.) | Notes |
|---|---|---|
| $1,600/oz blended basket | ~$146 million | Below-cycle scenario |
| $1,800/oz blended basket | ~$165 million | Mid-cycle baseline |
| $2,000/oz blended basket | ~$183 million | Current-environment approximation |
| $2,200/oz blended basket | ~$201 million | Bull-case scenario |
These figures are illustrative estimates for directional analysis only and do not constitute financial advice or forecasts. Actual basket price realisations depend on individual metal price weightings, refinery payabilities, and timing of sales.
The Cost Advantage That Underpins Margin Resilience
Sylvania's cost per ounce produced is one of the most important but least-discussed aspects of its investment case. The SDO model's surface-based processing circuit, combined with the absence of drilling, blasting, and underground logistics costs, positions Sylvania at the lower end of the global PGM cost curve.
This structural cost advantage means the operation retains positive cash margins at basket price levels that would render conventional deep-level operations unprofitable or borderline. During periods of PGM price weakness, low-cost producers with strong balance sheets typically emerge as share price outperformers relative to high-cost peers, both because they maintain free cash flow generation and because they are positioned to consolidate assets from a position of financial strength.
Shareholder Returns: Capital Discipline in Practice
Sylvania has maintained a consistent track record of returning capital to shareholders through dividends and buyback programmes. Production guidance upgrades matter in this context because they directly expand the free cash flow envelope available for distributions.
A move from the historical ~70,000 oz annual baseline toward 90,000+ oz, at broadly similar cost per ounce, creates a meaningful step-change in free cash flow generation capacity assuming stable or improving basket prices. However, the role of renewable energy solutions in mining may further support cost discipline across the sector going forward.
Scenario Analysis: Can Sylvania Exceed 93,000 Ounces?
| Scenario | Implied Annual Output | Variance vs. Midpoint |
|---|---|---|
| Lower guidance bound | 90,000 oz | -1,500 oz vs. midpoint |
| Guidance midpoint | 91,500 oz | Baseline |
| Upper guidance bound | 93,000 oz | +1,500 oz above midpoint |
| Outperformance scenario | 94,000-95,000 oz | +2,500-3,500 oz above midpoint |
The case for outperformance rests on plant reliability improvements across the SDO circuit, favourable feed grade management, and any acceleration in the Thaba JV ramp-up schedule. Historically, Sylvania has demonstrated a consistent pattern of achieving or exceeding the upper end of its guidance ranges, which lends credibility to the outperformance scenario.
The principal risks to the upside case include:
- Extended Thaba JV integration delays reducing chrome and incremental PGM contributions
- South Africa's electricity grid instability disrupting processing continuity
- Water availability constraints at individual SDO plants
- Any unexpected deterioration in the PGM basket price driven by automotive demand weakness or macroeconomic deterioration
The next major ASX story will hit our subscribers first
Tailings Retreatment vs. Conventional Mining: A Structural Comparison
| Factor | Tailings Retreatment (SDO) | Conventional Primary Mining |
|---|---|---|
| Capital intensity | Lower | High |
| Environmental footprint | Reduced (no new ore extraction) | Significant surface and sub-surface disturbance |
| Cost per ounce | Structurally lower | Higher, increases with depth |
| Production scalability | Incremental, modular | Capital-cycle dependent |
| Exposure to labour disruption | Lower | Higher |
| Seismic risk | Minimal | Significant at depth |
| Electricity dependency per unit output | Lower | High |
| ESG profile | Favourable (remediation narrative) | More complex |
This comparison is increasingly relevant as institutional investors apply stricter ESG screening criteria to mining sector allocations. Tailings retreatment operations carry a genuinely differentiated narrative: they reduce the environmental liability associated with existing waste deposits while recovering economic value, rather than creating new surface disturbance. PEM technology advancements are similarly reinforcing platinum's long-term demand credentials, further strengthening the case for low-cost PGM producers.
Frequently Asked Questions
What is Sylvania Platinum's current production guidance for FY2026?
Sylvania Platinum production guidance and PGM prices are intrinsically linked, and the FY2026 guidance stands at 90,000 to 93,000 oz of 4E PGMs, upgraded from the prior FY2025 guidance range of 75,000-78,000 oz. The company has indicated it is likely to achieve or exceed the upper end of this range.
What does 4E PGMs mean?
The 4E designation refers to a combined ounce measure covering platinum, palladium, rhodium, and gold. It is the standard reporting unit used by South African PGM producers and reflects the blended recovery of all four metals from a single processing circuit.
How does Sylvania extract PGMs without conventional mining?
The SDO model recovers PGMs from historical chrome tailings deposited at surface during previous chrome mining activity. Modern dense media separation and flotation circuits process these materials without the need for underground development, open-pit extraction, or new resource disturbance.
Why do PGM prices matter so much to Sylvania's earnings?
Sylvania sells its recovered PGMs at prevailing market prices with no meaningful hedging, meaning the blended basket price directly determines revenue per ounce. With platinum trading near $1,970/oz and palladium near $1,368/oz as of mid-2026, the current environment supports strong cash generation at Sylvania's production volumes. Sylvania's most recent quarterly report provides further detail on realised basket prices and operational outcomes.
What are the main risks investors should monitor?
Key risks include Thaba JV integration timing, South Africa's electricity supply reliability, water availability at processing sites, and shifts in the PGM basket price driven by changes in automotive demand or broader macroeconomic conditions. The USD/ZAR exchange rate also functions as a significant secondary variable in rand-denominated revenue outcomes.
Key Takeaways for Investors
- FY2026 guidance of 90,000-93,000 oz marks a structural step-change from Sylvania's historical ~70,000 oz annual baseline, with management indicating the upper bound is likely to be achieved or exceeded
- The SDO tailings retreatment model delivers a structurally lower cost per ounce than conventional South African PGM mining, providing resilience through price cycles
- Current prices with platinum near $1,970/oz and palladium near $1,368/oz create a broadly supportive revenue environment, with the Sylvania Platinum production guidance and PGM prices reinforcing free cash flow capacity
- The Thaba JV is a medium-term growth catalyst but introduces near-term timing uncertainty that investors should track across quarterly reporting
- Sylvania's consistent pattern of conservative initial guidance followed by upward revision is a distinctive feature of its operational communication track record
- The USD/ZAR exchange rate functions as a secondary amplifier of revenue outcomes that is frequently overlooked in single-metal price analysis
This article is intended for informational purposes only and does not constitute financial advice. Commodity price forecasts, production scenarios, and revenue sensitivity estimates are illustrative in nature. Investors should conduct independent due diligence and consult a licensed financial adviser before making investment decisions. Past production performance and guidance revision patterns do not guarantee future outcomes.
Want To Stay Ahead of the Next Major ASX Mineral Discovery?
Discovery Alert's proprietary Discovery IQ model delivers real-time alerts on significant ASX mineral discoveries, instantly transforming complex mineral data into clear, actionable investment insights — explore historic discoveries and their returns to understand the opportunity, then begin your 14-day free trial at Discovery Alert to position yourself ahead of the broader market.