June 24, 2026
The Hidden Leverage Machine: Why Gold Miner Margins Have Never Been More Powerful
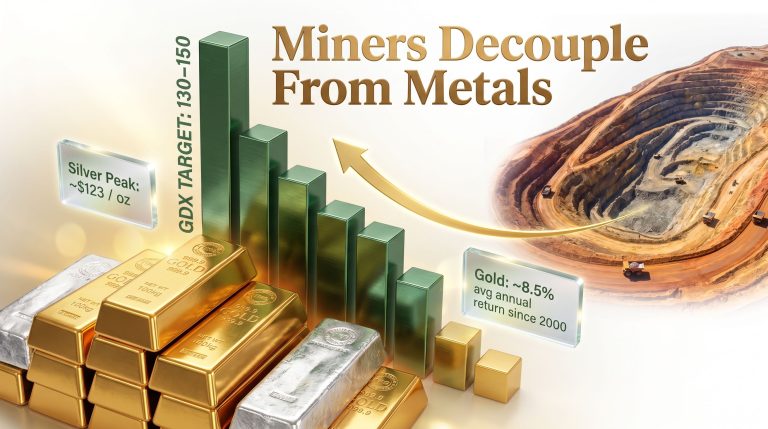
Across most commodity cycles, producers and prices move in rough alignment. Costs rise alongside revenues, margins oscillate within a predictable band, and the investment thesis rarely strays far from simple price-per-unit arithmetic. Gold mining in 2026 is doing something entirely different. The gap between what it costs to pull an ounce from the ground and what the market pays for that ounce has widened to a level that has no precedent in the sector's modern history. Understanding why gold miner margins and central bank gold demand interact, what threatens them, and whether institutional demand can sustain this represents one of the more consequential analytical puzzles in natural resources investing today.
When big ASX news breaks, our subscribers know first
Understanding the AISC-to-Price Spread: The Core Mechanic Behind Miner Profitability
The All-In Sustaining Cost, commonly referred to as AISC, is the most comprehensive cost measure used in gold mining analysis. It captures everything required to sustain production at an existing operation: direct mining costs, processing, site administration, sustaining capital expenditure, royalties, and corporate overhead. It deliberately excludes growth capital, acquisitions, and exploration spend, making it the cleanest expression of what it actually costs to keep an ounce flowing.
Industry-average AISC across major producers sits in the $1,525 to $1,600 per ounce range through 2025 and into 2026, with some high-cost operations extending toward the $1,800 to $2,000 range. That cost base has not been static, but its rate of increase has significantly lagged the pace of gold price appreciation. Labour, energy, and reagent costs all rose during the post-pandemic inflationary period, but those pressures have since moderated, and the gold price has continued climbing well beyond them.
The result is a margin structure that most sector analysts would have considered implausible just five years ago:
| Period | Avg. Gold Price (USD/oz) | Est. AISC (USD/oz) | Approx. Margin (USD/oz) |
|---|---|---|---|
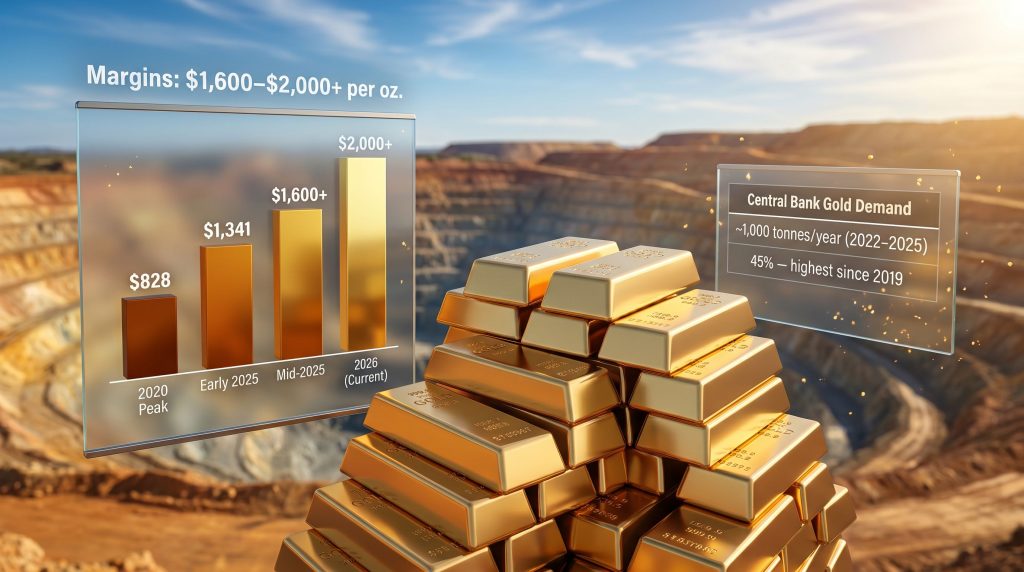
| 2020 Peak | ~$2,070 | ~$1,050–$1,100 | ~$828 |
| Early 2025 | ~$2,866–$3,200 | ~$1,525–$1,600 | ~$1,341 |
| Mid-2025 | ~$3,200+ | ~$1,525–$1,600 | ~$1,600+ |
| 2026 (Current) | ~$4,081–$4,100 | ~$1,600–$2,000 est. | ~$1,600–$2,000+ |
The 2020 margin of approximately $828 per ounce was, at the time, celebrated as an exceptional outcome that defined the upper bound of what gold miners could reasonably expect. Current margins have doubled that benchmark. Furthermore, sector leaders are now reporting operating margins above 60%, a figure more commonly associated with software businesses than with heavy-industry extractors operating in remote and challenging terrain.
Operational Leverage: The Amplification Effect That Investors Often Underestimate
The fixed-cost architecture of gold mining creates a dynamic known as operational leverage, which describes the disproportionate impact that revenue changes have on earnings when the cost base is largely static. A mine with fixed processing infrastructure, a set workforce, and contracted power supply will see its costs remain roughly stable whether gold trades at $3,500 or $4,500 per ounce. The entire price movement flows almost directly to the profit line.
Gold equities leverage creates a compelling practical illustration: if a producer's AISC is $1,700 per ounce and gold rises from $4,000 to $4,400, the 10% price increase translates to a margin expansion from $2,300 to $2,700 per ounce, a 17% improvement in absolute margin and a far larger percentage gain in net profit once financing costs and tax are applied. For producers with lower-cost operations, the amplification is even more pronounced.
Operational leverage cuts both ways. A producer generating extraordinary margins in a rising gold market can see earnings compress rapidly if prices retreat, particularly for high-cost operators whose margins offer less cushion against downside price moves.
This asymmetry is why tiering matters. Low-cost producers in the first AISC quartile carry structural resilience that mid-tier and high-cost operators simply cannot replicate during a price correction. Consequently, undervalued gold miners in the lower cost quartile represent a particularly compelling opportunity within the current environment.
Why a Stronger U.S. Dollar Creates a Ceiling for Gold Prices
Gold is globally priced and settled in U.S. dollars. When the dollar strengthens relative to other currencies, the purchasing cost of gold rises for non-U.S. buyers, reducing demand at the margin and exerting downward pressure on the spot price. This inverse relationship between the U.S. Dollar Index (DXY) and gold has been one of the most durable structural correlations in commodity markets.
In June 2026, the DXY climbed to 101.51, its highest reading since May 2025. The catalyst was a rapid repricing of Federal Reserve rate expectations. Within a single week, the probability of a July 2026 rate hike shifted from 8.5% to 36%. September 2026 hike odds simultaneously moved from 29.1% to over 70%, reflecting a market conclusion that the Fed's rate path would remain more restrictive than previously anticipated.
The transmission mechanism operates through three interconnected channels:
- Higher rate expectations increase the yield available on U.S. dollar-denominated assets.
- Capital flows toward higher-yielding dollar assets, strengthening the currency.
- A stronger dollar raises the effective cost of gold for international buyers, reducing spot demand.
Because gold generates no income, every additional rate hike increases what economists call the opportunity cost of holding it. Traders pricing in three Fed rate hikes in 2026, up from one prior to the most recent Federal Open Market Committee meeting, are rationally reducing gold exposure in favour of interest-bearing alternatives. In addition, the relationship between gold and bond dynamics becomes particularly important to monitor during these rate-sensitive periods.
The Iran-Dollar Paradox: When Safe-Haven Flows Work Against Gold
Geopolitical risk traditionally supports gold prices by directing capital toward perceived safe-haven assets. The conflict involving the United States, Israel, and Iran that began in late February 2026 represents a complication to that thesis. However, bullion has declined approximately 23% since the onset of that conflict, an outcome that appears counterintuitive on the surface.
The explanation lies in how safe-haven demand has been distributed. Uncertainty surrounding the Strait of Hormuz, a critical global oil shipping corridor, has sustained inflation expectations while simultaneously directing safe-haven flows into U.S. dollar assets rather than gold. NAB's Ray Attrill has noted that the dollar retains its status as the primary safe-haven instrument in periods of geopolitical stress, with the additional observation that a significant portion of the dollar's recent appreciation may already be reflected in current pricing, limiting further currency-driven upside from this particular headwind.
Central Bank Gold Demand: The Structural Force That Changes the Analysis
Short-term gold price dynamics are dominated by speculative positioning, currency moves, and rate expectations. The medium-to-long-term picture is shaped by a fundamentally different force: the systematic accumulation of physical gold by the world's central banks at a pace that represents a structural break from the prior decade. Indeed, central bank gold demand has emerged as perhaps the single most consequential driver of the structural bull case for gold.
According to World Gold Council data, central banks have purchased an average of approximately 1,000 tonnes of gold per year across the four-year period from 2022 through 2025. That figure is roughly double the approximately 500-tonne annual average recorded over the preceding decade. The scale of this shift is difficult to overstate when expressed in terms of market supply: annual global mine production sits at approximately 3,100 to 3,300 tonnes, meaning official sector buyers have been absorbing close to 30% of total annual mine output at the peak of this demand cycle.
The World Gold Council's 2026 central bank survey captures the forward trajectory of this demand with unusual clarity:
| Survey Metric | Result |
|---|---|
| Central banks planning to increase gold reserves (next 12 months) | 45% (highest since 2019) |
| Central banks expecting official gold reserves to increase overall | 89% |
| Central banks planning to maintain current holdings | 54% |
| Central banks expecting a decrease in holdings | 1% |
| Buyers funding purchases via other reserve asset sales | 38% |
The 45% figure is the highest recorded share of reserve managers signalling an intent to expand gold holdings since 2019. The 89% figure speaks to an even broader institutional consensus: the overwhelming majority of the world's reserve managers expect the global gold reserve base to grow over the coming year, regardless of whether they themselves are adding.
Why Emerging Market Central Banks Are the Engine of This Demand
The diversification motive underpinning central bank gold accumulation is not uniform across the official sector. Emerging market reserve managers are the dominant buyers, driven by a convergence of factors that developed-market central banks face less acutely:
- Currency depreciation risk: Domestic currencies prone to volatility benefit from gold's non-correlated reserve characteristics.
- Inflation hedging: Gold's long historical record as a store of value appeals to economies with elevated inflation sensitivity.
- Sanctions risk mitigation: The precedent established by the freezing of Russian sovereign assets in 2022 created a powerful incentive for reserve managers to hold assets that cannot be easily restricted or seized by counterparties.
- Dollar concentration risk: Reducing the share of U.S. Treasury holdings in favour of gold distributes geopolitical risk across the reserve portfolio.
This last point carries a structural implication that extends beyond gold markets. The survey finding that 38% of central bank buyers are funding gold purchases through the liquidation of other reserve assets suggests that a meaningful share of official sector gold demand is displacing U.S. Treasury holdings. Furthermore, central bank gold reserves data confirms this is a dynamic with potential long-term consequences for both the dollar and sovereign bond markets.
Projected 2026 Demand and the Goldman Sachs Tracking Model
Consensus estimates for central bank gold purchases in 2026 cluster around 800 tonnes, a modest step down from the approximately 850 tonnes recorded in 2025. Goldman Sachs has modelled official sector demand at an average of approximately 60 tonnes per month through 2026, a run rate consistent with the consensus annual figure. According to mining industry analysis, this sustained pace of official sector buying represents the highest level of central bank accumulation in nearly fifty years.
Even at 800 tonnes, 2026 central bank demand represents roughly 26% of total annual global mine output. The moderation from the 2022 to 2025 peak rate does not signal a reversal of the reserve diversification mandate; it reflects a normalisation from an historically elevated baseline.
Scenario Analysis: Bear, Base, and Bull Cases for Gold in H2 2026
The interaction between near-term macro headwinds and structural institutional demand creates a range of plausible outcomes for gold prices in the second half of 2026. The Personal Consumption Expenditures index, the Federal Reserve's preferred inflation gauge, represents the most immediate near-term catalyst. A softer PCE reading could materially reduce rate hike expectations, allowing structural demand from the official sector to reassert itself as the price-setting force.
| Scenario | Key Conditions | Price Trajectory |
|---|---|---|
| Bear Case | PCE remains elevated; Iran talks stall; Fed hikes in July and September | Tests $3,800; risk of a move toward $3,500 |
| Base Case | PCE moderates slightly; Fed pauses after July; geopolitical uncertainty persists | Consolidates near $4,000; central bank demand provides structural floor |
| Bull Case | PCE softens materially; Iran nuclear deal progresses; Fed signals pause | Central bank demand drives recovery toward $4,200–$4,500 |
What Each Scenario Means for Gold Miner Margins
Even the bear case, which envisions gold retreating toward $3,500 per ounce, leaves miner margins in historically exceptional territory. With AISC in the $1,600 to $2,000 range, a $3,500 gold price would still generate margins of $1,500 to $1,900 per ounce for the majority of the industry, a level that would have been celebrated as extraordinary by any measure prior to 2024.
Producers with flexible capital allocation frameworks hold an additional advantage in a downside scenario. The distinction between sustaining capital, which is largely non-deferrable because it maintains existing production, and growth capital, which can be delayed without immediately affecting output, gives well-managed operators a tool to protect free cash flow during periods of price weakness. High-cost producers in the upper AISC quartile carry the greatest vulnerability; for them, a move toward $3,500 to $3,800 would meaningfully compress margins and potentially trigger production rationalisation decisions.
In the bull case scenario, where gold approaches $4,500 per ounce, the sector's operational leverage creates a remarkable earnings expansion dynamic. Assuming AISC stability in the $1,600 to $2,000 range, margins would extend to $2,500 to $2,900 per ounce, generating free cash flow yields that would place even the largest mining companies in an unusual position of capital abundance.
Key Variables Investors Should Monitor Through Q3 2026
The gold miner margins and central bank gold demand narrative for the remainder of 2026 will be shaped by a specific and trackable set of data points:
- Monthly PCE inflation releases and their direction relative to Federal Reserve targets.
- The trajectory of the U.S. Dollar Index, particularly within the critical 100 to 102 range where gold demand sensitivity is most acute.
- Progress on Iran nuclear inspection negotiations, which simultaneously influence geopolitical risk premiums and inflation expectations.
- World Gold Council monthly central bank purchase data, which will confirm whether the 800-tonne annual consensus is tracking above or below pace.
- Q2 and Q3 2026 AISC reporting from major producers, which will reveal whether cost discipline is holding at current gold price levels.
- Goldman Sachs monthly tracking of official sector demand against the 60 tonnes per month baseline model.
The next major ASX story will hit our subscribers first
The Dual-Engine Investment Framework: Margins Meet Institutional Demand
Taken together, the record-level gold miner margins and the structural persistence of central bank gold demand create what can be characterised as a dual-engine investment thesis, each component reinforcing the other in ways that neither could achieve independently.
Engine One: Miner Profitability. Free cash flow generation at current margin levels gives producers the financial capacity to fund buybacks, increase dividends, reduce debt, and pursue value-accretive acquisitions. The sector's aggregate cash generation at $4,000+ gold represents an unprecedented redistribution of value to shareholders, a dynamic that tends to attract capital flows from income-oriented institutional investors who have historically underweighted mining. VanEck's analysis confirms that top miners posted record Q1 earnings on precisely these dynamics.
Engine Two: Central Bank Demand. The official sector's structural, price-insensitive accumulation of gold establishes a demand floor that speculative and retail flows cannot easily dislodge. A buyer acquiring gold for reserve diversification purposes operates on a policy mandate measured in years or decades, not in months. This creates a persistent backstop that modifies the risk-reward profile of gold exposure in ways that traditional commodity markets do not offer.
The most important misreading investors can make at this point in the cycle is to conflate near-term price volatility driven by dollar strength and rate expectations with a structural deterioration in gold's fundamental demand picture. The short-term and long-term forces are operating on entirely different time horizons and should be analysed as such.
The sector's current positioning reflects a genuine structural transition in gold's role within the global financial system. Central banks holding gold as a hedge against dollar dominance, geopolitical risk, and inflation uncertainty are not making a tactical trade. They are expressing a decades-long institutional preference that has, through the compounding of consistent annual purchases, created a permanent upward shift in the baseline demand structure for physical gold.
For investors evaluating gold miner margins and central bank gold demand as components of a broader portfolio framework, the analytical priority is to separate the signal from the noise: the noise is the daily price fluctuation driven by DXY movements and Fed rhetoric; the signal is the sustained widening of miner profit margins and the structural transformation of sovereign reserve management that underpins them.
This article is intended for informational purposes only and does not constitute financial advice. All forecasts, price targets, and scenario analyses are speculative in nature and subject to material uncertainty. Past commodity cycles are not necessarily indicative of future outcomes. Investors should conduct independent research and consult qualified financial professionals before making investment decisions.
Want To Catch the Next Major ASX Gold Discovery Before the Market Moves?
Discovery Alert's proprietary Discovery IQ model scans ASX announcements in real time, instantly identifying significant mineral discoveries across gold and 30+ other commodities and translating complex data into clear, actionable investment opportunities — explore the historic returns major discoveries have generated to understand the potential at stake, then begin your 14-day free trial at Discovery Alert to position yourself ahead of the broader market.