May 20, 2026
The Hidden Architecture Behind the Gold and Oil Narrative for Gold Prices
Commodity markets are governed not only by supply and demand fundamentals, but by the stories that institutional capital tells itself about how those fundamentals interact. Few narratives have proven more durable, or more conditionally misleading, than the one linking oil prices, interest rates, and the gold price into a single mechanical chain. Understanding the gold and oil narrative for gold prices — where it holds, where it breaks, and why it periodically inverts entirely — is arguably the most important analytical edge available to gold investors navigating the current macroeconomic environment.
When big ASX news breaks, our subscribers know first
Why the Gold-Oil Relationship Defies Simple Framing
The most common version of the gold and oil narrative for gold prices runs as follows: oil rises, inflation follows, central banks tighten, and gold falls under the weight of rising real rates. It is a tidy sequence, and it carries enough historical truth to survive repeated scrutiny. However, reducing the gold-oil relationship to this single causal chain misrepresents the actual mechanism driving simultaneous price moves in both commodities.
Research published in Physica A: Statistical Mechanics and its Applications (Soytas, Sari, Hammoudeh and Hacihasanoglu, 2011) documented a positive and statistically significant correlation between crude oil and gold across the 2003-2010 period, particularly during episodes of financial market stress. The more revealing finding was not the correlation itself, but what explained it: shared exposure to common macro drivers rather than a direct transmission from one commodity to the other.
Three primary channels generate this co-movement:
- Dollar weakness channel – Geopolitical disruption triggers capital flight, weakening the USD, which mechanically lifts USD-denominated commodity prices across the board.
- Real interest rate channel – Uncertainty prompts central bank accommodation signals, compressing real rates and reducing the opportunity cost of holding non-yielding gold.
- Inflation expectations channel – Supply shocks from geopolitical disruption raise inflation expectations, elevating the nominal price of both commodities simultaneously.
The September 2019 Saudi Aramco drone attacks illustrate this dynamic precisely. WTI crude spiked 19% in a single trading session, while spot gold rose approximately 1.8% in the same 24-hour window. Both moved higher, but the magnitude mismatch is instructive. The geopolitical catalyst was shared; the intensity of response was not. Oil faced a direct supply interruption. Gold responded to an elevated risk premium that dissipated within 72 hours as equity markets stabilised.
The more dramatic case came in April 2020, when WTI crude futures settled at negative $37.63 per barrel, an unprecedented event driven by storage constraints and demand collapse. Gold, simultaneously, was trading above $1,700 per ounce and climbing. This genuine inversion between the two commodities in real time destroys any simplistic notion of oil driving gold in a consistent directional relationship. For a deeper look at how these commodity price dynamics interact over time, independent research offers valuable context.
The geopolitical tension driving oil higher is often the more powerful force behind gold's price appreciation, not the oil price itself.
What Is the Gold-to-Oil Ratio and Why Does It Matter for Investors?
The gold-to-oil ratio is a deceptively simple metric: divide the spot price of gold per troy ounce by the spot price of crude oil per barrel. The resulting figure tells you how many barrels of oil a single ounce of gold can purchase at any given moment. What makes this ratio analytically valuable is not the absolute number, but its deviation from historical norms and the directional velocity of its movement.
Based on World Bank Commodity Price Database historical data, the ratio's behaviour across different market regimes can be summarised as follows:
| Market Regime | Approximate Ratio Range | Dominant Force |
|---|---|---|
| Normal economic expansion | 10-20 | Balanced commodity demand |
| Oil supply shock (Gulf War, Iran) | 4-8 | Oil supply disruption dominates |
| Oil demand collapse (2016 glut) | 35-44 | Deflationary risk premium |
| COVID-19 systemic shock (2020) | Technically undefined | Gold safe-haven demand vs. oil demand collapse |
| Current environment (April 2026) | ~47 | Combined supply disruption and safe-haven surge |
| Historical 21st century average | ~15-18 | Structural baseline |
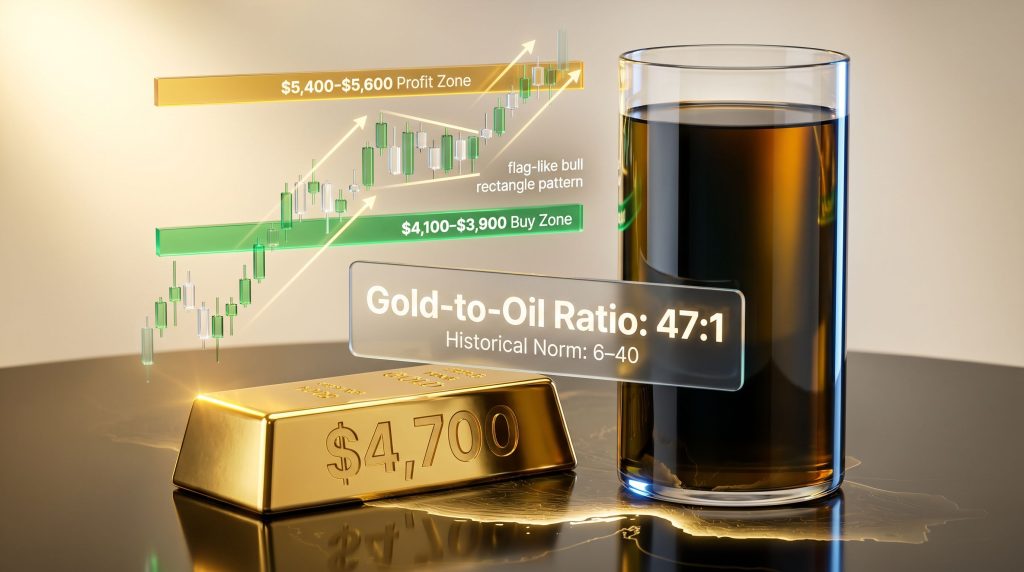
At the current gold price of approximately $4,700 per ounce and oil above $100 per barrel, the ratio sits near 47:1, which is materially above the 21st century average of 15-18:1. This elevated reading means gold is trading at roughly 2.5 to 3 times its historical purchasing power relative to crude oil, signalling either significant structural repricing of gold's monetary function or extraordinary dislocations in global oil markets, or both simultaneously.
Research published in the Journal of Commodity Markets (Radetzki and Wårell, 2017) identified ratio extremes above 35:1 as correlating with subsequent commodity sector stress and broader economic slowdowns, with a statistically significant lead time of 6 to 12 months. The Bank for International Settlements has similarly noted that sharp upward moves in this ratio preceded economic contractions with 60 to 70% accuracy in post-war data.
A falling ratio, conversely, signals reflationary momentum where energy demand recovers faster than gold's safe-haven premium. Investors who track this ratio alongside the VIX and high-yield credit spreads gain a multi-dimensional stress signal that no single indicator provides independently. Furthermore, understanding gold's safe haven characteristics helps investors contextualise these ratio extremes within the broader investment landscape.
How the Oil-Rates-Gold Narrative Operates Inside Financial Markets
Understanding the mechanics of how the oil-rates-gold narrative propagates through markets matters enormously for practical investment decision-making. This is not an abstract academic debate. The narrative is embedded in algorithmic trading systems and institutional risk models across some of the largest capital allocators on earth, meaning its activation creates real, measurable price pressure on gold regardless of whether the underlying causal logic is sound.
The chain of institutional logic runs through four steps:
- Oil prices rise, elevating headline inflation data.
- Elevated inflation increases probability of Federal Reserve rate hikes.
- Higher nominal rates increase the opportunity cost of holding non-yielding assets.
- Algorithmic systems reduce gold exposure, creating downward price pressure.
Research by economist Lutz Kilian (NBER, 2008, revised 2010) quantified the oil-inflation transmission: a sustained $10 per barrel increase in oil prices correlates with approximately a 0.1 to 0.15 percentage point increase in headline CPI within six months, with core inflation effects taking 12-18 months to materialise due to wage-setting delays.
The critical analytical insight is that this chain is conditionally true, not universally applicable. Federal Reserve rate response data across multiple cycles demonstrates the limitations clearly. During the 2004-2006 hiking cycle, the Fed raised rates by 425 basis points cumulatively as oil climbed from $30 to over $100 per barrel. Gold prices during this same period rose from approximately $400 per ounce to $650 per ounce, a gain of over 60%. The narrative's predicted suppression of gold simply did not occur.
The mechanism's failure threshold relates to purchasing power destruction. At moderate oil and inflation levels, consumers and investors passively accept higher costs. Above a certain threshold, behaviour shifts toward panic-driven acquisition of hard assets. History suggests this inflection point exists, though the precise oil price or inflation level at which this behavioural shift occurs remains empirically undefined. This unknown represents both the central risk and the central opportunity in the current environment. Notably, how Fed signals amid oil-driven inflation are communicated will likely prove decisive in determining when this threshold is breached.
Investors who understand the conditional nature of the oil-rates-gold narrative can position ahead of the narrative's eventual breakdown rather than being swept up in the reactive selling it creates.
What the Current Oil Market Setup Means for Gold in 2026
The structural backdrop for oil in 2026 is unlike any period in modern commodity market history. With the Strait of Hormuz disrupted by the ongoing US-Iran conflict, the global energy market faces supply concentration risk that has no clear historical parallel in terms of duration and magnitude. Oil prices above $100 per barrel are not merely cyclical spikes; they represent a structurally altered supply landscape.
The inflation implications diverge by geography but ultimately converge in economic impact. Asian and European energy-importing nations face immediate and acute cost pressures. American consumers face a lagged but structurally equivalent inflation exposure because crude oil trades on global benchmarks. Domestic production capacity in the United States provides supply diversity but not price insulation. The arithmetic of global pricing means inflationary energy costs ultimately reach every consumer in any open economy.
This creates the precise macro environment where the oil-rates-gold narrative's breakdown becomes most probable:
- Sustained oil above $100/bbl generates persistent headline inflation
- Persistent inflation erodes real consumer purchasing power over 12-24 month horizons
- As purchasing power erosion accumulates, behavioural shift toward gold as monetary refuge accelerates
- The institutional narrative predicting gold suppression loses its self-fulfilling mechanism as fundamental demand overwhelms algorithmic selling
Structurally, the investment case for sustained elevated oil prices rests on three reinforcing pillars: supply concentration risks in geopolitically volatile regions, geopolitical fragmentation that complicates multilateral production agreements, and chronic underinvestment in upstream exploration capacity across the 2015-2025 decade as energy transition capital allocation redirected capital away from conventional oil development. In addition, the relationship between gold and economic cycles provides useful context for understanding how these structural forces evolve over time.
Gold's Technical Position: Reading Both Timeframes Simultaneously
With gold trading near $4,700 per ounce in late April 2026, the technical picture presents a short-term versus medium-term divergence that investors must interpret carefully to avoid misreading temporary weakness as a trend change.
Daily Chart: Near-Term Caution Signals
Four technical factors collectively describe a short-term bearish posture:
- The RSI oscillator has repeatedly failed to push convincingly through the 50 zone, indicating that bearish momentum retains near-term control
- Significant resistance has established itself around $4,900, capping upside attempts
- The 14,7,7 Stochastics oscillator has generated a sell signal without yet reaching oversold territory, suggesting the corrective phase has further to run
- The 20,40,10 MACD series produced a buy signal where histograms barely cleared zero, and has deteriorated since, creating a bearish short-term divergence
Weekly Chart: The Structural Bull Case Intact
| Timeframe | Indicator | Signal | Interpretation |
|---|---|---|---|
| Daily | RSI | Bearish | Below 50 zone, momentum negative |
| Daily | 14,7,7 Stochastics | Sell signal | Oversold zone not yet reached |
| Daily | 20,40,10 MACD | Fading | Histograms deteriorating near zero |
| Weekly | 14,5,5 Stochastics | Buy signal | Medium-term uptrend intact |
| Weekly | Bull rectangle pattern | Constructive | Consolidation before potential breakout |
The weekly chart carries greater analytical weight for price projection purposes, and its picture is considerably more constructive. A large flag-style bull rectangle consolidation pattern is forming, consistent with a corrective pause within a larger uptrend rather than a genuine trend reversal. The 14,5,5 Stochastics oscillator on the weekly timeframe is generating a buy signal, confirming that medium-term structural momentum remains intact.
From a tactical standpoint, the key price zones for strategic positioning are clearly defined:
- Accumulation zones: $4,100 and $3,900 represent high-probability entry levels if the current decline extends
- Profit-taking range: $5,400 to $5,600 represents a logical zone for reducing exposure and capturing gains
- Long-term scenario target: Multi-year projections in some analytical frameworks outline a pathway toward $20,000 per ounce, though the route will involve substantial volatility and multiple narrative-driven drawdowns
Disclaimer: Price projections, technical signals, and market forecasts discussed in this article are for informational and educational purposes only and do not constitute investment advice. All investment decisions carry risk, including the potential loss of capital. Past performance is not indicative of future results.
The next major ASX story will hit our subscribers first
Managing Narrative-Driven Volatility: The Psychology of Position Sizing
The practical challenge of investing through a gold bull market is not identifying the right directional thesis. It is maintaining the emotional and financial capacity to hold positions when institutional narratives create sharp, conviction-testing drawdowns in gold, silver, and mining equities simultaneously.
When algorithmic systems act on the oil-rates-gold framework, they generate rapid, technically validated-looking selloffs that can be deeply disorienting for investors whose portfolio sizing is misaligned with their actual risk tolerance. The investors most vulnerable to panic-selling at cycle lows are those who have overweighted their gold exposure relative to their psychological capacity to absorb short-term losses.
The structural solution to this problem is maintaining adequate fiat currency reserves as operational insurance rather than viewing cash as an inferior alternative to hard assets. This reframe is not merely semantic. Liquidity reserves serve three concrete functions in a gold investment framework:
- Prevent forced selling during narrative-induced drawdowns when gold reaches short-term lows
- Enable strategic accumulation at the defined $4,100 and $3,900 support zones
- Provide emotional stability that separates disciplined investors from reactive ones
The deeper macro context amplifies this point. As sovereign debt burdens intensify and more nations and institutions reduce holdings of US Treasury securities, the institutional pressure to construct new narratives explaining gold weakness will increase. Each such narrative, regardless of its internal logic, represents a recurring buying opportunity for investors with sufficient liquidity to act rather than react. Furthermore, understanding how central bank demand continues to shape gold's price trajectory reinforces the importance of maintaining long-duration conviction through short-term volatility.
Gold functions as the long-term monetary anchor. Fiat currency functions as the tactical instrument that allows investors to exploit the volatility that narratives create. Holding both simultaneously is not a contradiction but a sophisticated capital allocation strategy.
What Mining Equities Are Signalling About the Broader Bull Market
The behaviour of gold mining equities provides a secondary confirmation layer for the broader gold bull thesis, and current technical conditions within the sector warrant careful attention from both senior and junior mining investors.
Senior Miners: Patience Required
Senior gold mining equities, tracked by broad ETFs covering major established producers, are displaying Stochastics oscillators that have not yet reached oversold territory. This technical observation carries a specific practical implication: the corrective phase for senior miners has not completed its cycle. Investors seeking optimal entry points should allow the technical reset to proceed rather than attempting to catch the turn prematurely.
The same $4,100 and $3,900 gold price levels identified as accumulation zones for bullion are referenced as the contextual entry trigger for senior mining exposure. Consequently, understanding how gold price movements affect mining equities is essential for calibrating entry timing with precision.
Junior Miners: A Generational Setup Taking Shape
The Canadian Venture Exchange (CDNX), the primary benchmark for junior resource and exploration companies, is currently consolidating at the neckline of a large inverse head-and-shoulders pattern. This is a technical structure that, if confirmed by a breakout with volume, projects a substantial multi-month surge in junior mining valuations.
Several points warrant emphasis for investors considering junior mining exposure:
- Junior miners are high-risk, high-volatility instruments that are not appropriate for all investors, particularly in large position sizes
- The leverage to gold prices that junior miners provide cuts both ways: outperformance in bull phases is historically dramatic, but drawdowns during corrections can be severe
- Within the context of a sustained gold bull era driven by structural monetary forces, junior miners have historically delivered the largest percentage returns relative to bullion during breakout phases
- The inverse head-and-shoulders formation on the CDNX, if validated, would represent one of the most significant technical breakout setups in junior resource market history
The asymmetry between risk and potential reward in junior miners is most favourable when entered during technical consolidation phases near established support. In addition, a thorough examination of junior mining risks and rewards helps investors align position sizing with their genuine risk capacity before committing capital.
FAQ: The Gold and Oil Narrative for Gold Prices
Does Rising Oil Always Push Gold Prices Lower?
No. The assumption that rising oil triggers Fed rate hikes that then suppress gold is a conditional relationship, not a universal law. At elevated inflation and purchasing power destruction thresholds, investor behaviour shifts decisively toward safe-haven assets, which can overwhelm the rate-hike suppression mechanism entirely. The 2004-2006 Fed hiking cycle, during which gold rose over 60%, is a clear historical counterexample.
What Is the Gold-to-Oil Ratio Indicating in 2026?
With gold near $4,700 per ounce and oil above $100 per barrel, the ratio sits at approximately 47:1, materially above the historical 21st century average of 15-18:1. This elevated reading reflects both extraordinary supply disruption in global energy markets and heightened safe-haven demand for gold operating simultaneously.
Why Do Institutional Traders Follow the Oil-Rates-Gold Framework So Closely?
Algorithmic systems are built around historical statistical correlations. The oil-inflation-rates-gold sequence has been empirically reliable across multiple market cycles, making it a default embedded assumption in quantitative risk models. The self-reinforcing nature of algorithmic selling creates real price pressure even when the fundamental logic underlying the narrative is weakening or failing entirely.
What Are the Key Gold Price Levels to Monitor?
- Support and accumulation: $3,900 and $4,100
- Resistance and profit-taking: $5,400 to $5,600
- Long-term scenario target: $20,000 per ounce across a multi-year, non-linear pathway
How Should Investors Respond to Narrative-Driven Gold Selloffs?
Maintain adequate fiat liquidity reserves to prevent forced selling and to preserve the capacity for strategic accumulation at defined support levels. Ensure position sizing aligns with genuine risk tolerance to avoid emotional decision-making during drawdowns.
Is the Current Gold Bull Market Structural or Speculative?
The structural drivers — including sovereign debt expansion, de-dollarisation trends among central banks, persistent inflationary pressure from energy costs, and deepening geopolitical fragmentation — suggest the current bull market has fundamental underpinnings that distinguish it from purely speculative cycles. These forces do not resolve within single market cycles; they operate across decades.
Narratives Are Cyclical, Structural Forces Are Permanent
Every market narrative derives its power from institutional consensus, and consensus shifts when underlying data diverges too sharply from the narrative's predictions to be ignored. The gold and oil narrative for gold prices will eventually lose its self-reinforcing capacity, just as prior narratives linking gold to specific economic variables eventually exhausted their predictive credibility.
The combination of historic oil supply concentration risk, accelerating sovereign debt deterioration across major economies, and rising institutional de-dollarisation pressure represents a macro environment in which gold's role as a monetary reserve asset is being actively reasserted by central banks, sovereign wealth funds, and an expanding cohort of institutional investors globally. World Gold Council data consistently documents central bank gold buying at multi-decade highs across 2022-2025, a trend that reflects structural strategic repositioning rather than tactical speculation.
For investors, the practical framework is straightforward:
- Position gold as the core long-duration monetary asset in a portfolio structured for a multi-year bull era
- Maintain fiat currency reserves as tactical deployment capital to exploit narrative-driven volatility at defined support levels
- Accept that the pathway to significantly higher gold prices will involve multiple significant drawdowns, each justified at the time by compelling-sounding institutional narratives
- Recognise that each such narrative-driven weakness represents not a structural threat to the gold thesis, but a recurring accumulation opportunity for investors with the liquidity and discipline to act on it
The approximate $700 trillion in over-the-counter derivatives exposure globally, most of which remains only partially written off official balance sheets, represents an additional systemic dimension that conventional portfolio analysis rarely incorporates. The scale of this embedded financial system risk provides additional long-horizon structural support for monetary assets that exist outside the traditional banking system's liability structure.
This article is intended for informational and educational purposes only. Nothing contained herein constitutes financial, investment, or legal advice. All investment decisions involve risk, including the potential for total loss of capital. Readers should consult qualified investment professionals before making any investment decisions. Forecasts and technical analysis discussed herein represent analytical perspectives and are not guarantees of future performance.
Want To Stay Ahead of the Next Major Mineral Discovery Before the Market Reacts?
While understanding macro narratives like the gold-oil relationship sharpens your investment framework, Discovery Alert's proprietary Discovery IQ model delivers real-time ASX mineral discovery alerts — instantly translating complex geological data into actionable opportunities for both short-term traders and long-term investors. Explore how historic mineral discoveries have generated extraordinary returns and begin your 14-day free trial today to position yourself ahead of the broader market.