June 26, 2026
The Inflation Hedge Paradox: When Rising Prices Actually Punish Gold Investors
Most investors operate under a straightforward mental model: when inflation rises, gold goes up. It is an assumption embedded in decades of portfolio theory and reinforced by the metal's 2025 performance, when it surged 66% in a single year as the debasement trade captured market imagination. Yet the relationship between US PCE inflation and gold prices in 2026 tells a far more complicated story, one that exposes a fundamental blind spot in how retail and institutional investors alike approach precious metals positioning.
The critical variable is not inflation itself. It is what the central bank does in response to inflation. When those two forces diverge from historical expectations, the consequences for gold can be severe, rapid, and deeply counterintuitive. Understanding gold and bond dynamics is, consequently, essential to making sense of why conventional inflation hedging logic can break down.
When big ASX news breaks, our subscribers know first
How the PCE Framework Became Gold's Most Important Data Point
The Personal Consumption Expenditures index occupies a unique position in monetary policy architecture. Unlike the Consumer Price Index, which uses a fixed basket of goods, PCE dynamically adjusts for consumer substitution behaviour. When beef prices rise and consumers shift to chicken, PCE captures that behavioural response, making it a structurally more accurate signal of underlying inflationary conditions. This is precisely why the Federal Reserve targets PCE at 2%, not CPI.
For gold market participants, this distinction carries real consequence. Because the Fed calibrates rate decisions against PCE, every monthly release from the US Bureau of Economic Analysis functions as a direct input into forward rate pricing, and therefore into the opportunity cost calculation for holding a zero-yield asset like gold.
The May 2026 PCE release delivered a result that materially altered the positioning landscape:
| Metric | Monthly Change | Year-over-Year | Context |
|---|---|---|---|
| Headline PCE | +0.4% | 4.1% | First reading above 4.0% since April 2023 |
| Core PCE (ex-food & energy) | +0.3% | 3.4% | Highest since October 2023 |
| Fed's 2026 Headline Forecast | N/A | 3.6% | Actual inflation running well above projection |
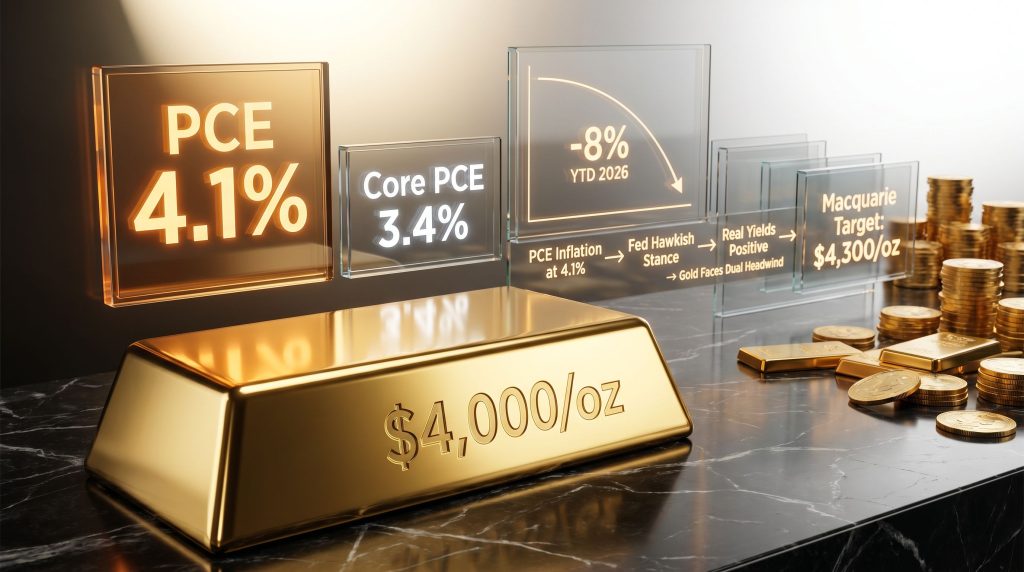
The headline figure of 4.1% was notable not simply because it exceeded expectations, but because it confirmed that inflation had re-accelerated beyond the Fed's own 2026 projection of 3.6%. More critically, core PCE at 3.4% demonstrated that energy price volatility was not the sole driver. Demand-side inflationary pressure was alive and entrenched.
Why Core PCE at 3.4% Is the Number Gold Traders Cannot Ignore
Energy prices are inherently volatile and subject to geopolitical supply shocks that reverse as quickly as they appear. When the early 2026 conflict affecting Middle East shipping routes resolved through diplomatic channels, Strait of Hormuz flows normalised and oil prices retreated toward pre-conflict levels. That geopolitical premium, which had briefly supported both headline inflation and gold's safe-haven bid, dissolved.
Core PCE, by design, strips away that volatility. A reading of 3.4% on the core measure tells the Fed that underlying demand conditions are generating self-sustaining inflation pressure. The central bank cannot look through core inflation the way it can look through an energy spike. That reality removes any credible pathway toward near-term monetary easing, which is precisely the condition under which gold would benefit most.
The Real Yield Mechanism: Gold's Structural Headwind Explained
Understanding how US PCE inflation and gold prices interact requires working through the transmission mechanism rather than relying on surface-level correlation.
Real yields represent the inflation-adjusted return available on US Treasury securities. They are, in practical terms, the opportunity cost of holding gold. When an investor chooses gold, they forgo the real income stream available from government bonds. When that income stream is positive and growing, the case for gold weakens mechanically, regardless of what headline inflation is doing.
The 2026 dynamic creates what might be called the policy response trap for gold investors:
PCE Inflation at 4.1% (well above the Fed's 2% target)
        ↓
Fed Maintains Hawkish Stance Under Chair Kevin Warsh
        ↓
Nominal Yields Stay Elevated → Real Yields Remain Positive
        ↓
US Dollar Strengthens on Capital Inflows
        ↓
Gold Faces Dual Compression: Opportunity Cost + Currency Headwind
        ↓
Gold Consolidates Near or Below $4,000/oz
The counterintuitive outcome is that higher inflation, when paired with a credible and aggressive central bank response, can produce conditions that are net negative for gold. The metal benefits from inflation primarily when the Fed fails to respond, allowing real yields to turn negative and the dollar to weaken. Chair Kevin Warsh has explicitly signalled that restoring the Fed's inflation-fighting credibility takes priority over near-term growth accommodation, a posture that amplifies the market impact of each above-target PCE print.
The Dollar's Role as a Secondary Transmission Channel
A hawkish Fed attracts global capital into higher-yielding dollar-denominated assets. Because gold is priced in US dollars, a strengthening dollar mechanically reduces the metal's purchasing power equivalence for buyers operating in other currencies. This creates a secondary headwind that compounds the real yield pressure.
In 2025, dollar weakness was one of three concurrent forces that drove gold's exceptional rally. The others were broad geopolitical safe-haven demand and widespread expectations of an imminent Fed easing cycle. By mid-2026, however, all three had reversed direction simultaneously, creating the sharpest derating the metal has experienced since its record high.
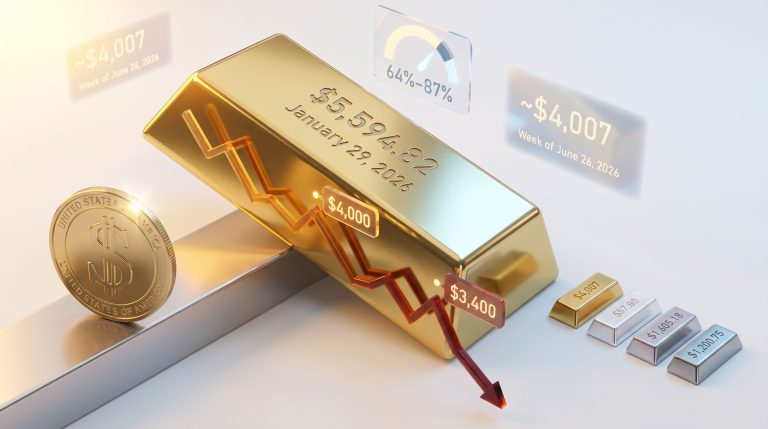
Quantifying the Correction: From Record High to the $4,000 Boundary
| Price Milestone | Level | Context |
|---|---|---|
| 2025 Record High | ~$5,250/oz | Peak of the debasement trade rally |
| 2025 Full-Year Performance | +66% | Driven by dollar weakness and safe-haven flows |
| Spot Price (June 2026) | ~$4,000–$4,003/oz | Down approximately 24% from record |
| Year-to-Date 2026 | -8% | Momentum fully reversed |
| Macquarie Year-End 2026 Target | $4,300/oz | Revised down from prior $4,400 forecast |
| Macquarie 2027 Average Forecast | $4,200/oz | Implies continued compression through next year |
The downward revision from Macquarie reflects something more significant than a routine data adjustment. Moving a year-end target from $4,400 to $4,300 signals a structural reassessment of the rate environment, an acknowledgement that monetary policy may remain restrictive well into 2027 rather than pivoting as previously anticipated. The 2027 average forecast of $4,200 reinforces that view, implying gold investors should not expect a sharp recovery even if near-term volatility produces temporary bounces.
The $4,000 level has become the critical regime boundary. A sustained reclaim of that threshold would require either real yields to fall, ETF selling to slow materially, or Fed communication to shift in a meaningfully less hawkish direction.
Fed Rate Hike Probabilities and What CME FedWatch Actually Reveals
CME FedWatch aggregates fed funds futures pricing to derive real-time implied probabilities of rate changes at upcoming FOMC meetings. These probabilities are not forecasts in the conventional sense. They are market-clearing prices, which makes them sensitive to each major data release and highly informative about the positioning of sophisticated capital.
| Timeline | Implied Rate Hike Probability | Interpretation |
|---|---|---|
| Next FOMC Meeting | ~40% | Genuinely split market; binary event risk elevated |
| December 2026 | ~80% | Near-consensus view of at least one hike by year-end |
| Pre-Fed Statement Baseline | ~61% | Where December odds stood before hawkish repricing |
| Post-PCE Peak Reading | ~85% | Brief spike following May PCE release |
| Current (post-moderation) | ~80% | Structurally elevated despite slight pullback |
The movement from 61% to 85% and back to 80% in December hike probability tells the positioning story clearly. Before the Fed's most recent statement, markets were uncertain. The combination of Chair Warsh's hawkish communication and the May PCE print at 4.1% shifted the probability distribution decisively. Furthermore, the subsequent modest moderation to 80% does not represent a meaningful dovish shift; it reflects normal intraday volatility rather than a genuine change in the rate outlook.
For gold investors, the near-term 40% probability of a rate hike at the next meeting creates a genuinely difficult timing problem. Binary event risk of that magnitude makes short-term tactical positioning around specific FOMC dates a low-probability strategy. Recent gold price data from Kitco further illustrates how swiftly market sentiment can shift in response to PCE surprises.
Why Gold Has Not Collapsed: The Structural Demand Floor
Despite the formidable macro headwinds, several structural forces are preventing a disorderly breakdown in gold prices, and understanding them is essential for positioning around the current regime.
Central Bank Accumulation as a Sovereign Price Floor
A recent World Gold Council survey indicated that approximately 90% of central banks plan to increase their gold reserve allocations over the coming 12 months. This is not speculative activity. It represents a deliberate, multi-year strategic reorientation in how sovereign institutions manage reserve assets. Indeed, central bank demand has become one of the most consequential structural pillars supporting the gold price floor.
The catalyst for this shift traces to 2022, when sanctions on Russia's foreign exchange reserves demonstrated that dollar-denominated assets held by central banks could be frozen or rendered inaccessible through unilateral policy action by a foreign government. Gold cannot be frozen, seized through a correspondent banking relationship, or devalued by another nation's monetary decision. That characteristic has permanently elevated gold's strategic value in sovereign reserve management, independent of short-term price cycles.
This sovereign-level demand creates a price floor that did not exist to the same degree in prior gold bear markets. Even in a structurally hawkish rate environment, the combination of central bank buying and long-term inflation expectation anchoring above 2% provides meaningful downside support.
The Behavioural Shift in Long-Term Inflation Expectations
Investors who have lived through sustained periods of 4% inflation do not simply reset their expectations back to 2% when a central bank makes progress on disinflation. The experience of elevated inflation permanently shifts how individuals and institutions calibrate real asset allocations. Gold benefits from this behavioural persistence as a portfolio insurance instrument, creating a demand baseline that did not exist in the pre-2020 monetary environment.
The next major ASX story will hit our subscribers first
Silver, Mining Equities, and the Operating Leverage Problem
The broader precious metals complex does not respond uniformly to gold price pressure, and understanding the differences between asset channels matters for portfolio construction.
Silver's Asymmetric Response to Gold Corrections
Silver occupies a hybrid position in commodity markets, with approximately 50–60% of annual demand driven by industrial applications including electronics, solar photovoltaic panels, and electric vehicle components. The remaining demand tracks precious metals sentiment closely. Silver's dual demand nature means it does not behave like a simple gold proxy during periods of monetary stress.
| Scenario | Gold Price Direction | Expected Silver Response |
|---|---|---|
| Gold rallies above $4,300 | Bullish | Silver likely outperforms due to higher beta |
| Gold consolidates near $4,000 | Neutral | Sideways with elevated volatility |
| Gold breaks below $4,000 | Bearish | Silver typically declines more sharply |
During gold bull markets, silver's speculative leverage causes it to outperform. During corrections, however, that same leverage works in reverse, amplifying declines relative to physical gold. Investors who entered silver positions on the basis of 2025 momentum should account for this asymmetric downside dynamic when sizing current exposure.
Operating Leverage in Gold Mining Equities
Gold mining companies carry largely fixed cost structures. Labour contracts, energy inputs, royalty obligations, and capital expenditure schedules do not compress proportionally when gold prices fall. A miner with an all-in sustaining cost (AISC) of $1,800 per ounce operating at a $4,000 gold price earns a margin of $2,200. A 10% decline in gold to $3,600 reduces that margin to $1,800, a drop of approximately 18% in per-ounce profitability despite only a 10% price move.
For miners operating with higher cost bases, the leverage effect is more dramatic. Consequently, gold mining equity leverage can produce 30–50% earnings declines during periods when the physical metal itself falls 10–15%. In the current environment, where gold remains under pressure from elevated real yields and a hawkish Fed, mining equities carry amplified downside risk relative to physical gold or gold-backed ETF exposure.
The Two-Signal Framework for Identifying a Regime Change
Rather than attempting to forecast specific FOMC outcomes or PCE readings, a more robust approach involves monitoring two concurrent indicators for evidence of a genuine regime shift.
Signal 1: CME FedWatch December Rate Hike Probability
- Current level: approximately 80% (firmly hawkish)
- Pre-repricing baseline: 61% (neutral-to-uncertain)
- Bullish trigger for gold: A sustained move back toward or below 61% would indicate market pricing of a meaningfully less restrictive Fed path
Signal 2: Monthly PCE Release (US Bureau of Economic Analysis)
- Current readings: 4.1% headline, 3.4% core (both restrictive for gold)
- Meaningful disinflation signal: Core PCE declining toward 3.0%
- Bullish trigger for gold: Headline PCE below 4.0% combined with a clear downward trend in core
Scenario Modelling: Gold Price Paths Under Different PCE Outcomes
| PCE Scenario | Headline PCE | Core PCE | Implied Fed Stance | Gold Price Range |
|---|---|---|---|---|
| Continued Persistence | 4.0–4.2% | 3.3–3.5% | Hawkish, hike likely | $3,800–$4,100 |
| Modest Disinflation | 3.5–3.9% | 3.0–3.3% | Neutral, pause likely | $4,100–$4,300 |
| Decisive Cooling | Below 3.4% | Below 3.0% | Dovish pivot possible | $4,300–$4,500+ |
| Re-acceleration | Above 4.2% | Above 3.5% | Aggressive hike cycle | Below $3,800 |
The highest-confidence repositioning signal would be both indicators shifting concurrently: December hike probabilities retreating toward 61% while PCE data demonstrates consecutive months of meaningful disinflation. A single data point moving in isolation is insufficient to confirm a regime change, given the stickiness core inflation has demonstrated throughout 2026.
Portfolio Positioning Principles Under Elevated Real Yields
For investors navigating the current relationship between US PCE inflation and gold prices, several structural principles are more reliable than tactical timing:
- Sizing over timing: Binary event risk around specific FOMC meetings is difficult to manage; position sizing relative to total portfolio risk tolerance provides more consistent outcomes
- Asset channel selection: Physical gold and the gold-backed ETCs guide offers useful context for investors comparing direct price exposure options with lower volatility than mining equities
- Cost friction awareness: ETF management fees and bid-ask spreads erode returns during sideways or declining markets, making these costs more consequential when gold lacks directional momentum
- Strategic baseline retention: Investors who exit gold entirely during rate-hike cycles often miss the subsequent recovery phase; maintaining a strategic baseline allocation while reducing tactical overweights is typically more effective than a binary in/out approach
- Defensive alternatives: Short-duration government bonds benefit from elevated yields without significant duration risk; inflation-protected securities (TIPS) offer direct real yield exposure without gold's sensitivity to monetary policy repricing
The structural case for gold, including sovereign reserve diversification away from dollar concentration, persistently elevated long-term inflation expectations, and the irreversibility of geopolitical reserve risk awareness, remains intact regardless of the near-term headwind from US PCE inflation and gold price dynamics. The appropriate response to the current environment is calibration, not abandonment.
This article is intended for informational purposes only and does not constitute financial advice. All forecasts, price targets, and probability figures cited reflect data and analyst projections available as of June 2026 and are subject to change. Past performance of gold or any related asset class is not indicative of future results. Readers should consult a licensed financial adviser before making investment decisions.
Want to Identify the Next Major ASX Mineral Discovery Before the Broader Market?
Discovery Alert's proprietary Discovery IQ model delivers real-time alerts on significant ASX mineral discoveries, instantly converting complex geological and market data into actionable investment insights — explore the historic returns major discoveries have generated to understand the opportunity, then begin your 14-day free trial at Discovery Alert to position yourself ahead of the market.