June 26, 2026
The Psychological Trap Driving Gold's Four-Week Losing Streak
Commodities markets have a way of humbling investors who anchor too firmly to historical patterns. For decades, gold's role as an inflation hedge has been treated almost as financial scripture, a relationship so intuitive and repeatable that it required little interrogation. Yet mid-2026 is delivering exactly the kind of environment that exposes the limits of that narrative, with gold on track for a fourth weekly loss on hawkish Fed bets even as inflation readings climb above levels not seen in three years.
Understanding why this is happening requires stepping back from the headline price action and examining the deeper mechanical forces at work. The current gold correction is not a story about collapsing demand or a fundamental reassessment of the metal's long-term value. It is a story about the sequence in which macro forces interact, and about how investor psychology responds when a deeply entrenched trade begins to unwind.
When big ASX news breaks, our subscribers know first
Why Rising Inflation Is Not Saving Gold This Time
The Real Yield Mechanism Most Investors Overlook
The popular framing of gold as an inflation hedge is technically incomplete. More precisely, gold tends to perform well when real interest rates are falling or deeply negative, meaning when the rate of inflation meaningfully outpaces nominal interest rates offered by bonds and cash equivalents. The moment nominal rates begin rising faster than inflation expectations, the calculus shifts dramatically. Furthermore, understanding gold and bond dynamics in this context is essential for grasping why the current environment is so punishing for bullion holders.
This is the environment that has materialised in mid-2026. U.S. inflation data released in late May showed the Consumer Price Index climbing above 4.0% for the first time in three years, a reading that economists surveyed by Reuters had forecast. Rather than boosting gold, this data accelerated market expectations for Federal Reserve tightening, which in turn pushed real yields higher and eroded gold's relative appeal.
The core issue is opportunity cost. Gold generates no income whatsoever. No coupon, no dividend, no yield. When short-term U.S. Treasuries or money market instruments offer meaningful real returns, the case for holding a non-income-producing asset weakens significantly. Capital that might otherwise flow into bullion repositions toward yield-bearing instruments, and gold suffers accordingly.
"When central banks raise nominal rates faster than inflation expectations can adjust upward, the resulting rise in real yields creates a structural headwind for gold that can persist for months or even years. This dynamic has been observed across multiple Fed tightening cycles dating back to the 1970s."
How the Inflation-Gold Relationship Has Historically Functioned
To understand the current breakdown, it helps to examine when gold's inflation-hedge status actually delivered. The metal performed exceptionally during periods of stagflationary pressure, where inflation was high but economic growth was sluggish and central banks were either slow to respond or unwilling to raise rates aggressively. The 1970s remain the textbook example.
The 2020–2022 inflationary episode showed similar dynamics initially, with gold holding firm while the Fed described inflation as transitory and held rates near zero. The moment the Fed pivoted to aggressive tightening in 2022, gold underperformed even as inflation remained elevated. The pattern now repeating in 2026 follows an almost identical script, suggesting that the lesson from recent history has not been fully absorbed by the broader market.
Mapping Gold's 29% Collapse From Its January Peak
The Geopolitical Catalyst That Sent Gold to Record Highs
Gold's extraordinary rally into late 2025 and early 2026 was driven by a specific combination of factors that created unusually powerful conditions. The escalation of the U.S.–Iran conflict introduced severe geopolitical risk premium into commodity markets, whilst simultaneously stoking fears about supply chain disruptions, energy price shocks, and secondary inflationary effects. In addition, gold safe-haven demand surged dramatically as investors sought protection from the extraordinary uncertainty that the conflict generated.
This kind of crisis-driven gold accumulation carries a behavioural signature that experienced commodity analysts recognise well. Fear premiums build rapidly and tend to overshoot fundamental valuations, creating conditions where prices become temporarily disconnected from underlying supply and demand dynamics. When the acute phase of fear subsides, or when markets begin pricing in a policy response rather than an open-ended crisis, those premiums unwind, often sharply.
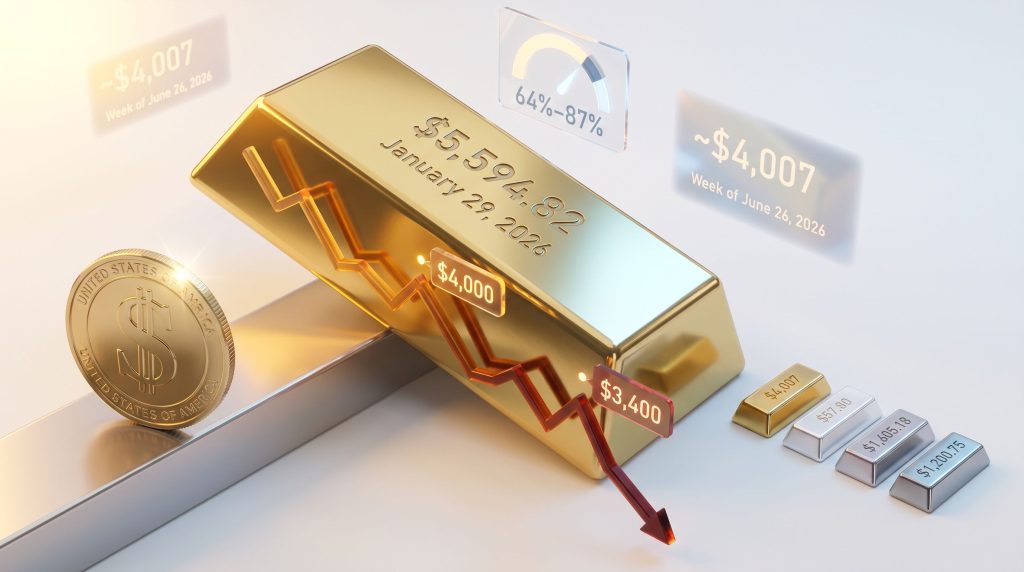
Gold's record peak of $5,594.82 on January 29, 2026, represented the apex of that fear premium cycle. The subsequent correction has been steep and technically significant, with gold price outlook models now pointing to substantially lower levels if macro headwinds persist.
The Price Trajectory and Key Technical Levels
The following table maps the key milestones in gold's price decline and the levels that analysts and institutional investors are watching most closely:
| Milestone | Price Level | Timeframe |
|---|---|---|
| Record High | $5,594.82 | January 29, 2026 |
| Psychological Support Breach | Below $4,000 | June 2026 (first time since November 2025) |
| Spot Price (Late June) | ~$4,007 to $4,028 | Week of June 26, 2026 |
| Projected Weekly Loss | ~3.2% | Week ending June 27, 2026 |
| Analyst Long-Term Downside Target | ~$3,400 | Extended hawkish scenario |
The breach of the $4,000 level during the week of June 23–27 carries more than just psychological weight. From a technical analysis standpoint, round numbers at this magnitude often function as consolidated support zones where large volumes of buy orders have historically been placed. A sustained close below $4,000 tends to flush those orders and accelerate downward momentum as stop-loss triggers activate across institutional and retail positions simultaneously.
The fact that gold has not traded at these levels since November 2025 also means that a large proportion of investors who entered positions during the January euphoria phase are now sitting on substantial unrealised losses, creating ongoing selling pressure as loss-aversion psychology drives portfolio liquidation.
The Federal Reserve's Role and the Dollar Amplification Effect
Rate Hike Expectations Are Reshaping Capital Flows
According to CME FedWatch data, traders are currently pricing in approximately a 64% probability of a September rate hike, with additional hikes expected later in the year. The market consensus points to as many as three Fed rate increases in 2026, a trajectory that represents a meaningful tightening of financial conditions relative to what was anticipated at the start of the year. Consequently, central bank gold buying behaviour is being closely monitored as a potential counterweight to this institutional selling pressure.
This repricing of Fed expectations has introduced what analysts describe as a hawkish momentum effect, where each successive piece of strong inflation data reinforces the probability of further tightening, which in turn strengthens the dollar and suppresses gold prices further. The feedback loop is self-reinforcing in the short term. According to reporting from The Hindu Business Line, gold on track for a fourth weekly loss on hawkish Fed bets has become the defining narrative across global commodities markets this month.
The Three-Way Transmission Mechanism
The pathway from Fed policy to gold prices operates through three interconnected channels:
- Nominal rate increases raise the return available on U.S. dollar-denominated fixed-income instruments, increasing the opportunity cost of holding gold.
- Dollar appreciation follows hawkish Fed signalling as capital flows into higher-yielding dollar assets from international markets.
- Global demand compression results from a stronger dollar, which effectively makes gold more expensive in local currency terms for buyers outside the United States, suppressing physical and financial demand simultaneously.
The U.S. Dollar Index heading into a second consecutive weekly gain during late June 2026 illustrates this mechanism operating at full intensity. Senior market analysts at OANDA noted publicly that the rapid repricing of hawkish Federal Reserve expectations generated strong bullish momentum in the U.S. dollar, which ultimately produced the significant downward drift now visible in gold's price chart.
"The gold correction unfolding in mid-2026 is fundamentally a dollar strength story. Gold is functioning as a mirror reflecting the reassertion of dollar dominance in a high-rate environment, rather than as the primary actor in its own price decline."
Bear Case vs. Bull Case: Where Does Gold Go From Here?
The Bearish Scenario and the $3,400 Target
Senior analysts have identified $3,400 per ounce as a plausible long-term downside target should current macro conditions persist or intensify. The conditions that would validate this scenario include:
- Federal Reserve delivering three or more rate hikes across the remainder of 2026
- U.S. dollar continuing to strengthen as rate differentials favour dollar-denominated assets
- Inflation remaining persistently above 4.0%, keeping rate-hike expectations elevated
- Speculative and institutional long positions in gold continuing to unwind
Historical precedent from previous Fed tightening cycles supports the plausibility of extended corrections. During the 2013 taper tantrum, gold fell approximately 28% over a similar timeframe. During the aggressive tightening cycle of 2022, gold underperformed for several quarters despite historically elevated inflation.
Where Structural Support Could Emerge
The bullish counterargument centres on demand sources that are relatively insensitive to short-term price movements:
- Central bank purchasing programmes: Emerging market central banks, particularly across Asia, the Middle East, and parts of Africa, have been systematically diversifying reserves away from U.S. dollar exposure for several years. This institutional buying tends to accelerate near technically significant support levels like $3,900, where the price-to-value proposition improves for long-term reserve managers.
- Geopolitical risk floor: The underlying geopolitical tensions that originally catalysed gold's 2025–2026 rally have not fully resolved. Persistent uncertainty tends to maintain a baseline level of safe-haven demand that acts as a floor against unlimited downside.
- Currency diversification thesis: A number of sovereign wealth funds and supranational institutions continue to view gold as a long-term hedge against dollar hegemony risk, particularly in scenarios where U.S. fiscal dynamics raise questions about the long-run purchasing power of the dollar itself.
Scenario Comparison Table
| Factor | Bearish Case | Bullish Case |
|---|---|---|
| Federal Reserve Policy | 3+ hikes in 2026 | Hike pause or pivot |
| U.S. Dollar Trajectory | Continued appreciation | Weakening on growth concerns |
| Inflation Path | Persists above 4.0% | Rapid disinflation |
| Central Bank Buying | Slows or stalls | Accelerates near $3,900 |
| Geopolitical Risk | De-escalation | Escalation or new conflict zones |
| Probable Price Target | ~$3,400 | Recovery toward $4,500+ |
Precious Metals Sector: Not All Metals Are Moving Equally
Silver, Platinum, and Palladium in Context
The broader precious metals complex is tracking gold's directional weakness, though with important nuances that reveal how different supply and demand fundamentals interact with macro headwinds. Notably, the gold-silver ratio has widened considerably during this correction, underscoring the divergent paths these two monetary metals are currently taking:
- Silver edged lower to approximately $57.80 per ounce, broadly tracking gold's decline given its dual role as both a monetary and industrial metal.
- Platinum declined approximately 0.3% to $1,605.18, with industrial demand dynamics from the automotive sector adding complexity to its pricing outlook.
- Palladium diverged meaningfully, gaining approximately 1.4% to $1,200.75, reflecting supply-side tightness rather than macro sentiment.
All four metals were projected to close the week in negative territory, suggesting that the macro headwind from dollar strength and rate expectations is broad-based across the sector.
What Palladium's Outperformance Reveals
Palladium's ability to post gains during a gold selloff illustrates a critical distinction for investors: monetary metals and industrial metals respond to fundamentally different demand drivers. Palladium's primary demand source is autocatalysts used in petrol and hybrid vehicle exhaust systems, with the majority of global supply concentrated in Russia and South Africa.
Supply constraints in this concentrated production base can override macro sentiment entirely, producing price behaviour that appears disconnected from the broader precious metals complex. This dynamic reinforces the importance of conducting commodity-specific fundamental analysis rather than treating the precious metals sector as a monolithic asset class.
The next major ASX story will hit our subscribers first
Key Indicators to Watch in the Weeks Ahead
For investors navigating this environment, the following variables represent the most actionable leading indicators for gold's next directional move:
- CME FedWatch probability shifts: Any movement in September rate hike pricing away from the current 64% baseline would signal a change in the hawkish momentum driving gold lower.
- U.S. inflation data releases: Whether the May 4.0%+ reading represents a temporary overshoot or the beginning of a renewed inflationary acceleration will determine whether the Fed tightening thesis strengthens or softens.
- U.S. Dollar Index trajectory: A reversal in the dollar's two-week winning streak would remove one of gold's most immediate headwinds.
- Central bank purchasing activity: Emerging market reserve manager behaviour near the $3,900 support zone will signal whether institutional demand is absorbing selling pressure or standing aside.
Technical Price Levels Every Gold Investor Should Track
| Price Level | Significance |
|---|---|
| $4,000 | Immediate psychological and technical support; sustained breach confirms bearish momentum |
| $3,900 | Institutional buying zone; central bank accumulation floor identified by analysts |
| $3,400 | Long-term analyst downside target in an extended hawkish scenario |
| $4,500+ | Recovery threshold signalling meaningful improvement in macro conditions |
Frequently Asked Questions: Gold and the Fed Tightening Cycle
Why does gold fall when the Federal Reserve raises interest rates?
Gold falls during Fed tightening cycles primarily because rising interest rates increase the opportunity cost of holding a non-yielding asset. When Treasuries and other fixed-income instruments offer higher real returns, capital rotates away from gold. Additionally, rate hikes strengthen the U.S. dollar, which makes gold more expensive in other currencies and suppresses global demand. The combined effect of higher real yields and a stronger dollar is the most powerful headwind gold can face in any macro environment. As noted by The Star, this precise dynamic has been central to the current correction.
How much has gold fallen from its all-time high?
Gold has declined approximately 29% from its record high of $5,594.82, reached on January 29, 2026. A decline exceeding 20% from a peak is conventionally defined as a bear market, meaning gold has technically entered bear market territory. However, the magnitude of the original rally, driven by an extraordinary geopolitical event, means that contextualising the correction relative to pre-conflict baseline prices is equally important for long-term investors.
Is the current gold correction a buying opportunity?
This depends entirely on individual investment time horizons, risk tolerance, and macro outlook. Historically, gold corrections during Fed tightening cycles have created attractive long-term entry points for investors willing to tolerate short-term volatility. The central bank buying floor near $3,900 and the persistent geopolitical risk premium suggest that structural demand has not evaporated. However, if inflation remains stubborn and the Fed delivers additional hikes beyond current market pricing, near-term downside toward $3,400 remains a credible scenario. This analysis is educational in nature and does not constitute financial advice.
How does dollar strength affect gold prices internationally?
Because gold is globally priced in U.S. dollars, a stronger dollar increases the local currency cost of gold for buyers in Europe, Asia, and emerging markets. This effective price increase in local currency terms reduces affordability and suppresses physical demand from jewellery manufacturers, central banks, and retail investors operating outside the United States. Dollar strength therefore acts as a demand suppressor across the broadest possible buyer base, amplifying the direct downward pressure that higher U.S. real yields already create.
Risk Disclosure: The price data, analyst targets, and probability estimates referenced in this article reflect market conditions as of late June 2026. Forward-looking scenarios involve inherent uncertainty and should not be interpreted as investment advice. All investment decisions should be made in consultation with a qualified financial adviser.
Want to Know Which ASX Mineral Discoveries Are Moving Before the Broader Market Does?
While gold navigates complex macro headwinds driven by real yield dynamics and Fed tightening cycles, Discovery Alert's proprietary Discovery IQ model delivers real-time alerts on significant ASX mineral discoveries — instantly translating complex commodity data into actionable insights for both short-term traders and long-term investors. Explore Discovery Alert's discoveries page to understand how historic mineral discoveries have generated substantial returns, and begin your 14-day free trial today to position yourself ahead of the market.