June 26, 2026
When Consensus Turns Bearish, Smart Money Starts Watching Closely
Commodity markets have a long and well-documented history of punishing the crowd at precisely the wrong moment. Peak pessimism, often accompanied by a chorus of financial media warnings and proliferating bearish narratives, has repeatedly served as a reliable contrarian signal across precious metals cycles. When speculative positioning collapses, technical indicators flash extreme oversold readings, and the dominant narrative centres on structural decline, the conditions for a sharp mean-reversion rally are quietly assembling beneath the surface.
That is the environment surrounding gold in the second half of June 2026. After a remarkable multi-year bull run, gold experienced a technically damaging breakdown that sent bearish sentiment surging and prompted widespread speculation that the precious metal's era of outperformance had reached its conclusion. The data, however, tells a more nuanced and considerably more bullish story for those willing to look beyond the headlines. Furthermore, with gold poised for big reversal, the confluence of technical, structural, and seasonal factors warrants close attention from investors at all levels.
When big ASX news breaks, our subscribers know first
Anatomy of the Breakdown: What the Price Structure Actually Reveals
The Scale of the Preceding Bull Market
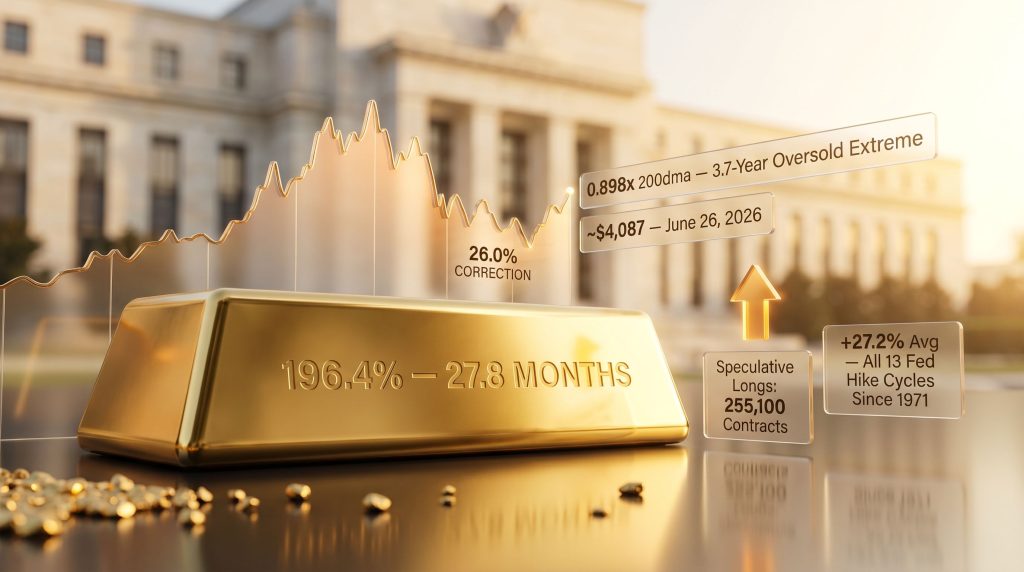
To properly contextualise the current drawdown, it is essential to first appreciate the magnitude of the advance that preceded it. Gold's cyclical bull market peaked in late January 2026, having delivered a staggering 196.4% gain over 27.8 months without experiencing a single correction exceeding 10%. In dollar terms, this represented the largest cyclical gold bull market on record, a distinction that set the stage for an unusually complex corrective phase.
The initial correction from that January peak brought gold down 18.6% over approximately 1.8 months, establishing a trough near $4,390 by late March 2026. Placing that against historical precedent, the ten next-largest gold bull markets in dollar terms since 1971 produced average post-peak corrections of 20.8% over 2.1 months. The March low was, by that measure, approaching the historically normal correction depth, and gold subsequently entered a period of high-level consolidation that held through late May and into early June.
How June's Collapse Became an Anomaly
Three events in rapid succession shattered that consolidation. A four-standard-deviation beat on US non-farm payrolls on June 5th triggered an immediate 3.7% single-day selloff, as gold-futures speculators interpreted the data as increasing the probability of Federal Reserve rate hikes later in 2026. The US Dollar Index surged approximately 0.7% that session, providing the directional cue that futures-market participants use as their primary trading signal.
What followed compounded the damage in ways that historical analysis suggests were disproportionate. According to analysis of precious metals reversals, the speed and severity of these moves raised immediate questions about structural versus sentiment-driven selling:
- A 4.3% single-session selloff on June 10th linked to geopolitical escalation in a paradoxical "backward war trade" dynamic, where gold sold off on conflict intensification despite war-driven inflation historically being a bullish catalyst.
- A 1.6% decline on the June 17th FOMC decision after the new Fed chair's press conference was interpreted as hawkish, despite the rate projection involved amounting to a single projected 25-basis-point increase.
- Subsequent selling pressure across multiple sessions that extended the total drawdown to 26.0% from the January peak, over 4.8 months.
The comparison table below illustrates precisely how unusual this correction has been relative to historical precedent:
| Metric | Historical Average (Top 10 Bulls) | January 1980 Bubble Collapse | June 2026 Drawdown |
|---|---|---|---|
| Peak-to-trough decline | ~17.5 to 20.8% | 43.4% | 26.0% |
| Duration of decline | ~2.1 to 2.2 months | 1.9 months | 4.8 months |
| 200dma ratio at trough | Above 1.0x | Extreme premium (43.4% above) | 0.898x |
The January 1980 peak, the only comparable historical precedent for a correction of this magnitude, occurred from a price that was 138.7% above the 200-day moving average. The January 2026 peak, by contrast, saw gold reach just 43.4% above its 200-day moving average at its most overbought point. The bubble-level excesses that justified a 43% collapse simply did not exist this time, making the current 26% drawdown look structurally excessive.
By mid-June 2026, gold's price had fallen to just 0.898 times its 200-day moving average, the most deeply oversold reading in 3.7 years, last seen in October 2022. That October 2022 low, which registered at 0.946x the 200-day moving average, marked the precise starting point for the subsequent record-breaking bull market. In addition, the gold price forecast picture for the remainder of 2026 hinges heavily on whether this oversold extreme resolves in a similar fashion.
The Futures Market Signal That Most Investors Are Missing
Speculative Positioning as a Contrarian Roadmap
The mechanics of how gold prices move in the short to medium term are inseparable from the behaviour of leveraged speculators in gold futures markets. These participants, who use the US Dollar Index as their primary directional cue, have a well-documented tendency to cluster at extremes in ways that create highly predictable mean-reversion setups.
As of the week ending June 16, 2026, the most recent available reporting period, speculative long contracts in gold futures stood at approximately 255,100 contracts. That figure was less than 3% above the 3.5-year secular low of 247,900 contracts recorded in late May 2026. For context, speculative long positioning reached as high as 441,000 contracts during the peak of the preceding gold bull market.
Rebuilding speculative long positions from current levels back to bull-market highs would require the equivalent of approximately 578 metric tonnes of gold-equivalent buying power entering the futures market. That is not a marginal repositioning; it is a structural re-entry of historic proportions.
The Dollar Crowding Problem
The mirror image of this dynamic sits in US Dollar Index futures. During the same reporting period, speculative long positions in USDX futures reached 34,500 contracts, a 1.8-year high. Simultaneously, short-covering in dollar futures combined to produce the largest single-week USDX futures buying in 2.0 years.
Crowded positioning in any direction creates asymmetric reversal risk. When speculative dollar longs are at multi-year extremes while gold longs are near multi-year lows, the subsequent unwind of those positions historically produces sharp, simultaneous dollar weakness and gold strength. The setup entering late June 2026 matches this pattern with unusual precision. Consequently, the gold-silver ratio analysis further supports the case that precious metals broadly are approaching a meaningful inflection point.
Gold and the Fed: Five Decades of Evidence
What 55 Years of Rate-Hike Cycles Actually Show
The central narrative driving gold's June selloff was straightforward: a projected Federal Reserve rate hike is bearish for gold. Historical analysis spanning all 13 Fed rate-hike cycles since 1971 directly contradicts this assumption.
| Fed Rate-Hike Cycle Category | Number of Cycles | Average Gold Performance |
|---|---|---|
| All 13 cycles since 1971 | 13 | +27.2% average gain |
| Cycles where gold rallied | 9 of 13 | +43.9% average gain |
| Cycles where gold declined | 4 of 13 | -10.5% average loss |
| Last gold decline during a hike cycle | 1988 to 1989 | More than 35 years ago |
Gold has not declined through a single Fed rate-hike cycle in over three and a half decades. The asymmetry is also striking: when gold rises during tightening episodes, it averages a 43.9% gain. When it falls, the average loss is just 10.5%. Even in its worst-case historical scenario, gold's drawdown during a tightening cycle is far smaller than what June 2026 has already delivered in response to a projected single quarter-point move.
Critically, a rate-hike cycle by definition requires three or more consecutive hikes without interruption. A single projected 25-basis-point increase, which is what markets were pricing as of mid-June 2026, does not constitute a cycle. Gold sold off twice in June on the same rate-hike projection, first on the jobs report and again at the FOMC meeting, representing a market inefficiency rather than a rational fundamental reassessment.
The Conditions That Shape Gold's Performance in Tightening Environments
Not all tightening episodes affect gold equally. Three variables consistently determine the outcome:
- Entry-level valuation: The more oversold gold is when a tightening cycle begins, the stronger its subsequent performance tends to be. Entering the current environment at a 3.7-year oversold extreme is historically favourable.
- Pace and depth of hikes: Gradual, shallow tightening episodes have been substantially more gold-friendly than aggressive, front-loaded ones. A single quarter-point move sits at the extreme low end of the historical range.
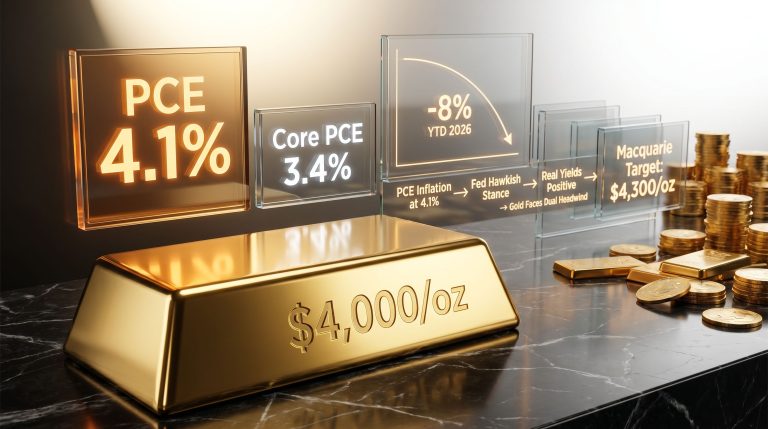
- Inflation backdrop: Supply-side and geopolitically driven inflation tends to support gold even as nominal rates rise, because real yields often fail to increase commensurately. The gold safe-haven appeal remains structurally intact precisely because of this dynamic.
A Structural Shift at the Fed That Changes Everything for Gold
How New Leadership Is Rewiring the Fed's Communication Framework
The June FOMC meeting introduced changes to Fed communications that, paradoxically, sent gold lower in the short term while laying the groundwork for structurally reduced gold volatility over the medium term.
The incoming Fed chair took immediate steps to remove forward guidance on interest rates from official FOMC communications, a significant departure from the approach maintained by previous leadership. The mandate priority was formally shifted back toward price stability over maximum employment promotion. Additionally, a dedicated task force was established to scrutinise Fed communication practices, with particular attention directed at the dot plot framework.
The dot plot has a well-documented track record of inaccuracy in projecting where the federal funds rate ultimately lands. Despite this, markets have repeatedly experienced sharp volatility around dot plot releases, and gold in particular has suffered some of its largest single-day declines in response to dot plot updates implying higher rate trajectories. Analysis from Guardian Gold's market updates highlights how these communication-driven selloffs have become increasingly disconnected from underlying monetary fundamentals.
The Regime Change Implication for Gold Traders
If dot plots and forward rate guidance are progressively de-emphasised or eliminated from the Fed's communication toolkit, the primary trigger mechanism for gold's worst single-day declines is removed. The structural implication is significant:
- Fewer data-driven selloffs: With the FOMC no longer signalling future rate paths in granular detail, traders cannot front-run projected rate changes in the way they did repeatedly through 2025 and 2026.
- Price discovery shifts to actual decisions: Gold repricing becomes driven by real monetary policy actions rather than speculative interpretation of dot plots and employment data.
- Volatility reduction over time: The frequency and magnitude of outsized gold selloffs should structurally decline as the market adjusts to a less communicative Fed.
There is a near-term transition risk: markets conditioned to gaming Fed projections may experience elevated volatility during the adjustment period. However, the direction of travel for gold volatility under this framework is lower, not higher.
Seasonal Dynamics and the Autumn Rally Setup
Why June Breakdowns in Gold Are Systematically Exaggerated
June represents the seasonal trough of gold's annual trading calendar. Institutional participation contracts, liquidity thins, and the same volume of selling produces larger price moves than it would in higher-participation months. The combination of a four-standard-deviation jobs report surprise and a hawkish FOMC meeting landing in this low-liquidity window created conditions that systematically amplified what might otherwise have been a contained pullback.
Historical data from all modern gold bull-market years since 2001 shows that gold averages a 5.5% gain from late June through late September during its seasonal autumn rally. However, years entering this window with deeply oversold technical readings and low speculative futures positioning tend to produce substantially above-average autumn rallies.
When gold's autumn rally reaches its typical late-September peak, it is historically up approximately 12.8% year-to-date. For gold to reach that threshold from its mid-June low near $3,993, it would need to recover to approximately $4,864. That represents a rally of approximately 21.8% from the breakdown low, a magnitude entirely consistent with prior mean-reversion recoveries from comparable oversold conditions. Moreover, with gold poised for big reversal, this seasonal window may prove to be the catalyst that triggers a rapid repositioning across futures markets.
The next major ASX story will hit our subscribers first
The Portfolio Allocation Gap That Could Transform Gold's Long-Term Trajectory
A Stunning Structural Underweight in US Investor Portfolios
Perhaps the most underappreciated aspect of gold's medium-to-long term outlook is the near-complete absence of the asset class from mainstream American investor portfolios, despite gold's historic bull market run.
At the mid-June 2026 price low near $3,993, the combined bullion holdings of the three largest US gold ETFs totalled approximately $217.4 billion. The combined market capitalisation of S&P 500 companies at that same point stood at approximately $66,995 billion. The resulting implied gold allocation in US equity investor portfolios was approximately 0.32%, or roughly one-third of one percent.
An allocation of less than one-third of one percent to gold, in the midst of the largest gold bull market in dollar terms on record, represents a structural underweight of historic proportions. The potential re-entry capacity is enormous.
Furthermore, central bank gold demand continues to provide a structural floor beneath prices, meaning retail and institutional underweighting is occurring against a backdrop of persistent sovereign accumulation.
The AI Bubble Rotation Thesis
Multiple market analysts have characterised the current AI-driven equity market as displaying bubble characteristics that exceed those of the 2000 dot-com bubble across several key valuation metrics. When concentrated technology-sector selloffs occur following bubble-like advances, capital rotation into defensive and alternative assets, including gold, historically accelerates rapidly.
The arithmetic of even modest reallocation is striking. A shift of just 1% of S&P 500 market capitalisation into gold would represent approximately $670 billion in capital inflows at current levels, a figure that would be structurally transformative for gold pricing given the relatively small size of the global gold market. This dynamic is also consistent with how gold in recessions and risk-off environments has historically attracted significant institutional capital rotation.
| Outlook Scenario | Price Target |
|---|---|
| Autumn rally mean-reversion (late September) | ~$4,864 |
| Full-year optimistic (sustained investment demand) | $6,200 to $6,300 |
| Bearish (post-bull cyclical support zone) | ~$4,000 |
| Mid-June 2026 breakdown low | ~$3,993 |
Key Reversal Signals to Monitor
For investors and analysts tracking whether a genuine gold reversal is developing, several specific technical and positioning thresholds are worth monitoring closely. Indeed, with gold poised for big reversal, these are the markers that could confirm the thesis is playing out as the historical evidence suggests:
- Gold reclaiming and sustaining a position above the $4,313 to $4,390 resistance zone, the range that represented both prior support and the zone where the June breakdown began.
- Speculative long contracts in gold futures recovering above 300,000 contracts, signalling meaningful institutional re-entry.
- The US Dollar Index rolling over from its 13.4-month high, releasing the primary mechanical pressure on gold futures positioning.
- Gold ETF holdings stabilising or expanding after weeks of outflows, indicating retail and institutional conviction is returning.
The convergence of technical oversoldness at a 3.7-year extreme, speculative futures positioning near multi-year lows, a 55-year historical record of gold thriving through rate-hike cycles, structural changes to Fed communication that remove the primary trigger for gold's worst selloffs, an approaching seasonal tailwind, and a near-zero portfolio allocation among the world's largest investor base creates a confluence of bullish factors that is historically rare.
Disclaimer: This article is for educational and informational purposes only. It does not constitute financial advice or a recommendation to buy or sell any security or asset. All forecasts, price targets, and scenario projections are analytical in nature and involve inherent uncertainty. Past performance of gold during historical Fed rate-hike cycles does not guarantee future results. Readers should conduct independent research and consult a qualified financial professional before making any investment decisions.
Want to Know When the Next Major ASX Mineral Discovery Hits the Market?
Discovery Alert's proprietary Discovery IQ model delivers real-time alerts on significant ASX mineral discoveries, turning complex data across more than 30 commodities into clear, actionable insights for investors at every level — whether they are navigating gold's next move or seeking exposure to the broader resources sector. Explore Discovery Alert's discoveries page to understand how historic mineral discoveries have generated substantial returns, and begin a 14-day free trial today to position yourself ahead of the market.