May 19, 2026
When Gold Refuses the Gift: What Markets Are Really Signalling
There is a concept in behavioural finance that receives far less attention than it deserves: the idea that what an asset refuses to do often carries more predictive weight than what it actually does. Price movement in response to negative catalysts is expected and easily rationalised. But when an asset sits motionless in the face of conditions that have historically produced strong gains, the market is offering a rare and unambiguous confession about its underlying direction.
That is precisely the situation unfolding in gold markets as of May 18, 2026. Oil declined by more than 4.5% in a single session. The US Dollar Index also weakened. Under these conditions, gold managed a gain of just 0.09%. That near-zero response, occurring within a macro environment that has reliably generated gold rallies of 2-3% or more on comparable oil down-days in recent weeks, represents a textbook gold price bearish signal that technical analysts identify as one of the clearest directional warnings in market analysis.
When big ASX news breaks, our subscribers know first
How the Oil-Gold Transmission Channel Works
To appreciate why gold's non-movement matters so much, it is first necessary to understand the mechanism connecting oil prices to gold performance in the current environment. When oil prices decline sharply, a predictable chain reaction typically unfolds:
- Falling oil suppresses near-term inflation expectations
- Easing inflation reduces pressure on the Federal Reserve to maintain restrictive policy
- Rate-cut expectations revive, which weakens the US dollar
- A weaker dollar reduces the cost of holding dollar-denominated gold
- Safe-haven and inflation-hedge demand accelerates gold buying
This transmission channel has been a consistent and well-documented short-term trading framework throughout the current geopolitical cycle. The historical record from recent sessions is instructive:
| Date | Oil Price Move | Gold Response |
|---|---|---|
| April 17, 2026 | -10% | Significant surge |
| May 1, 2026 | -5% | Notable pop higher |
| May 6-7, 2026 | -8% | Rally of nearly 3% |
| May 18, 2026 | -4.5%+ | +0.09% (near flat) |
The pattern through April and early May was consistent enough that traders were using sharp oil declines as a near-mechanical entry signal for long gold positions. The May 18 session broke that pattern decisively.
When the Channel Works But Gold Doesn't
Oil declining more than 4.5% in a single session represents one of the most favourable single-day setups for gold in the current macroeconomic framework. The macro tailwind was present. The transmission channel was active. And yet gold barely moved.
Furthermore, this refusal to respond carries significant analytical weight. According to real-time gold technical analysis, when an asset consistently refuses to respond to conditions that have historically produced meaningful gains, it is signalling something important about the balance between buyers and sellers.
Key Principle: When an asset consistently refuses to respond to conditions that have historically produced meaningful gains, it is telling participants something important about the balance between buyers and sellers. The buyers are not there in sufficient force to capitalise on the opportunity, which strongly suggests that selling pressure is dominating beneath the surface.
This concept has direct parallels across other markets. In equity analysis, when a stock fails to rally following better-than-expected earnings, experienced traders treat the non-response as a primary bearish indicator. The same interpretive framework applies to commodities. Gold's refusal to use the oil-driven tailwind is not a neutral observation — it is a directional signal.
What Are the Technical Indicators Currently Signalling for Gold?
The macro non-response does not exist in isolation. Multiple technical indicators are converging on the same bearish conclusion, creating the kind of multi-factor confirmation that increases signal reliability substantially.
RSI, Moving Averages, and Momentum Breakdown
The technical picture for gold at present is characterised by a cluster of bearish confirmations that operate independently but point in the same direction:
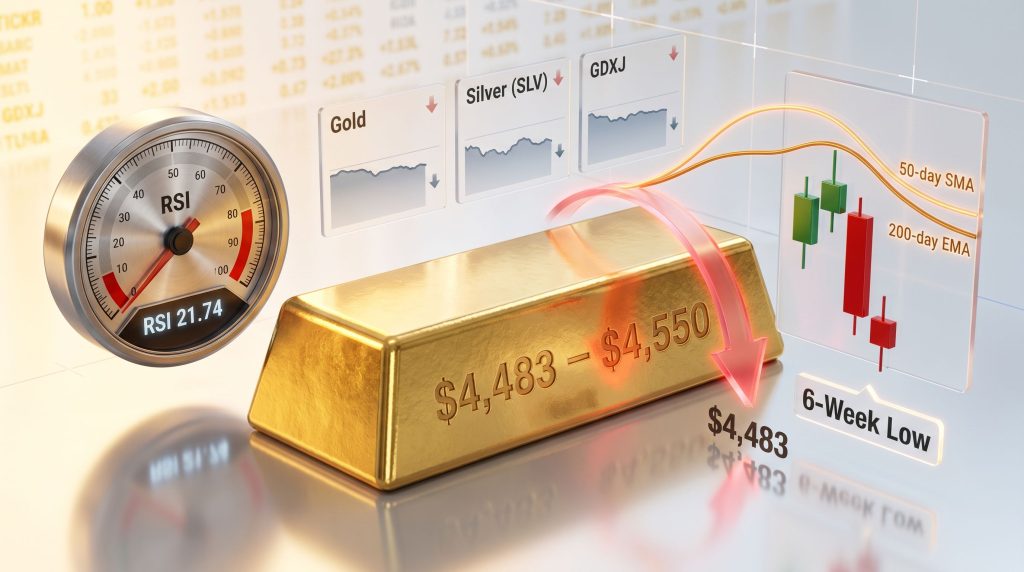
- RSI at 21.74: Deeply oversold territory, yet the lack of price recovery is the critical interpretation. When an asset sits at extreme RSI lows without bouncing, it indicates that selling pressure is overwhelming any technical bounce impulse. This transforms what might typically be read as a bullish oversold setup into a bearish signal of sustained downside pressure.
- 50-day SMA and 200-day EMA both positioned above current price: Dual moving average bearish confirmation, with price trading below both the medium-term and long-term trend indicators simultaneously.
- Price range of $4,483–$4,550: Gold has retreated to a six-week low, having declined approximately 4% over the prior week.
- Bearish Engulfing candlestick pattern: Identified on recent price charts, a classic reversal pattern confirming downside momentum continuation.
- Key support at approximately $4,509: A confirmed break below this level opens the pathway to further downside.
The Stochastic Sell Signal in Mining Stocks
Perhaps the most technically significant confirmation comes not from gold itself but from the broader precious metals complex. The GDXJ ETF, which tracks junior gold mining companies and is closely watched as a leading indicator for gold price direction, has produced a clear Stochastic oscillator sell signal.
This is not the first time this configuration has appeared. The identical signal was visible at both the March 2026 top and the April 2026 top, on both occasions preceding meaningful price declines. Pattern repetition across multiple market cycle peaks significantly strengthens the signal's reliability. The relationship between gold and mining equities suggests that institutional participants are responding to the same technical thresholds in a consistent manner.
Silver, tracked via the SLV ETF, is displaying similarly muted recovery attempts. When gold, silver, and mining equities all simultaneously produce bearish technical configurations while failing to respond to macro tailwinds, the convergence of evidence across asset classes substantially elevates the probability of continued downside.
The Volume Dimension: Why Low-Volume Rallies Are Bearish
Classical technical analysis assigns significant weight to volume confirmation. A rally that occurs on declining volume is conventionally treated as a bearish signal, indicating that institutional conviction is absent and that the recovery is driven by short covering rather than genuine accumulation.
The critical distinction here is between a genuine recovery bounce — supported by expanding volume as buyers step in with conviction — and a low-conviction dead-cat move, characterised by minimal volume and quickly reversed. Any near-term recovery in gold should be evaluated against this framework before being interpreted as a meaningful change in trend direction.
What Macro Factors Are Reinforcing Gold's Bearish Momentum?
Beyond technical analysis, three structural headwinds are operating in the macro environment to compound gold's difficulty in staging any meaningful recovery.
1. US Dollar Dynamics
The US Dollar Index experienced a mild pullback on May 18, which would typically provide additional relief for dollar-denominated gold prices. However, technical analysis of the USD Index suggests this pullback is more consistent with a consolidation of a prior breakout than a genuine trend reversal. If the USD resumes its uptrend, gold faces compounding downward pressure from both the macro transmission channel and direct currency effects.
2. Treasury Yields and Real Rate Dynamics
Higher Treasury yields increase the opportunity cost of holding non-yielding assets like gold. When investors can receive attractive real returns from government bonds, the relative appeal of gold as a store of value diminishes. Hotter-than-expected US inflation data has worked to suppress near-term Federal Reserve rate cut expectations, keeping the real yield headwind for gold firmly in place.
The Fed policy outlook remains the single most powerful driver of gold's medium-term trajectory, and the current outlook does not favour gold bulls. In addition, the gold price forecast for the period ahead remains heavily dependent on how this rate environment evolves.
3. The Frozen Conflict Premium Paradox
This is perhaps the most analytically interesting structural factor currently affecting gold markets. The concept of a frozen conflict creating paradoxically unfavourable conditions for gold requires careful explanation.
The Frozen Conflict Framework: An acute geopolitical shock, such as the sudden outbreak of hostilities or a surprise escalation, generates an immediate fear premium that drives safe-haven buying. However, as a conflict becomes chronic and unresolved, markets gradually reprice the risk. The fear premium erodes not because the situation improves, but because the surprise factor is exhausted.
This framework explains a dynamic that has been building since mid-April 2026. The Strait of Hormuz situation is now in its 79th day as a frozen conflict. On May 5, Iran established the Persian Gulf Strait Authority, a formal regulatory institution to govern all maritime transit through the Strait. This represents the permanent control framework becoming operational — no longer a temporary disruption but a structured regime change in one of the world's most critical shipping lanes.
Is the Geopolitical Backdrop Actually Bullish for Gold?
On paper, the geopolitical environment surrounding gold in mid-May 2026 is extraordinarily bullish. Consider the catalogue of events that accumulated within a single week:
- A drone strike on the UAE's Barakah Nuclear Energy Plant, the Arab world's only nuclear power facility — a $20 billion infrastructure asset providing approximately 25% of UAE electricity. This was the first attack on nuclear infrastructure since the conflict began. UAE air defences intercepted two of three drones; the third struck an electrical generator outside the inner perimeter. The IAEA expressed grave concern.
- Presidential rhetoric threatening severe military consequences, following a direct call between US and Israeli leadership.
- A cargo vessel sinking near Oman, the first ship sinking of the entire Strait crisis.
- A vessel seized and redirected toward Iran.
- A statement from Iran's senior Vice President that the Strait represents permanent Iranian sovereign territory, not subject to negotiation at any price.
- Asian equity markets declining overnight in response.
Every one of these events would historically qualify as a gold-positive catalyst. The absence of a meaningful price response is therefore not a minor technical footnote — it is a fundamental statement about market psychology.
| Geopolitical Event Type | Traditional Gold Response | Current Gold Response |
|---|---|---|
| Nuclear facility attack | Strong safe-haven surge | Minimal reaction |
| Shipping lane seizure | Moderate risk-premium bid | Near-flat |
| Presidential military threat | Short-term spike | Quickly reversed |
| Prolonged conflict (Day 79+) | Sustained elevated floor | Structural headwind |
The Concept of Market Event Fatigue
Financial markets exhibit a well-documented tendency to reduce their sensitivity to repeated stimuli that fail to produce resolution. When geopolitical shocks occur consistently but produce neither escalation to a new phase nor genuine de-escalation, market participants begin pricing them as background noise rather than discrete risk events.
The Trump-Xi summit that concluded the prior week without any concrete progress toward reopening the Strait is instructive in this regard. No enforcement mechanism was established. No sanctions framework was created. No military commitment from major powers materialised. Consequently, the absence of a diplomatic resolution pathway removes the escalation surprise factor while confirming the permanence of the structural disruption — the worst possible combination for gold safe-haven demand.
Gold vs. Silver vs. Mining Stocks: Is the Weakness Sector-Wide?
One of the most important analytical questions when evaluating a gold price bearish signal is whether the weakness is isolated to gold itself or reflects a broader shift in precious metals positioning. Sector-wide weakness is considerably more meaningful than single-asset underperformance, as it eliminates idiosyncratic explanations.
The current evidence points clearly to sector-wide deterioration:
- Gold: Near-flat despite multiple concurrent macro tailwinds and favourable oil price dynamics
- Silver (SLV): Similarly muted recovery attempts, with only minor bounces off recent lows and no meaningful technical recovery
- GDXJ (Junior Gold Miners ETF): Clear Stochastic oscillator sell signal confirmed, replicating the exact pattern observed at both the March and April cycle tops
When all three components of the precious metals complex fail to rally simultaneously, the explanation cannot be asset-specific. It points instead to a macro-level shift in investor positioning, potentially reflecting institutional rotation out of the entire precious metals sector in response to the evolving rate outlook, dollar dynamics, and exhaustion of the geopolitical fear premium.
For investors holding diversified precious metals exposure across bullion, streaming companies, royalty vehicles, and mining equities, this sector-wide pattern warrants serious attention as a risk management signal. Furthermore, monitoring the gold-silver ratio during this period can provide an additional layer of confirmation regarding directional momentum across the complex.
The next major ASX story will hit our subscribers first
Key Support and Resistance Levels Traders Are Watching
| Level | Type | Significance |
|---|---|---|
| ~$4,550 | Resistance | Prior support now acting as ceiling after breakdown |
| ~$4,509 | Near-term support | Short-term floor; confirmed break signals bearish continuation |
| ~$4,483 | Recent low | Six-week low; breach opens deeper downside pathway |
| 50-day SMA | Resistance | Positioned above current price; bearish moving average configuration |
| 200-day EMA | Resistance | Long-term trend indicator above price; confirms bearish structural posture |
The significance of price trading below both major moving averages simultaneously should not be understated. The 50-day SMA and 200-day EMA serve as the two most widely monitored trend indicators in commodity markets. When price trades beneath both, it means the short-term, medium-term, and long-term trend indicators are all aligned bearishly. Algorithmic trading systems that respond to these crossovers can amplify selling pressure once key thresholds are breached.
Critical Level to Watch: A confirmed and sustained break below $4,483 would likely trigger stop-loss orders from leveraged long positions established during the prior rally phase, and potentially activate momentum-based algorithmic selling programmes that compound the initial move. This level represents the near-term gatekeeper between a corrective pullback and a more significant technical breakdown.
What Does History Tell Us About Gold After Failure to Rally Signals?
The current configuration has clear historical antecedents within the 2026 market cycle. The March and April cycle tops both featured the same basic structure: the GDXJ producing a Stochastic sell signal, gold failing to sustain rallies, and broader precious metals showing correlated weakness. On both occasions, meaningful price declines followed.
A pattern of diminishing recoveries is particularly noteworthy as a technical warning. When successive rally attempts produce smaller and smaller bounces from each declining low, it signals exhausted buying pressure. Buyers are either unwilling or unable to bid prices back to prior levels, and each failed recovery leaves a lower high that confirms the degradation of demand.
The current pattern of tiny corrective bounces across gold, silver, and mining stocks — occurring even when macro tailwinds such as oil price declines are present — fits this diminishing recovery structure closely. Analysts tracking daily gold forecasts have noted similar patterns of weakening momentum preceding sustained corrective phases in prior cycles.
What Should Investors and Traders Watch Next?
For participants monitoring gold price direction across the near to medium term, several specific catalysts and confirmation signals deserve priority attention:
- Federal Reserve communications: Any meaningful shift in rate cut expectations would materially alter gold's macro headwind profile. Watch for FOMC minutes, Fed speaker commentary, and inflation data releases.
- USD Index trajectory: A resumption of USD strength following the current consolidation would compound downward pressure on gold through the currency channel.
- Oil price behaviour: If oil stabilises or recovers, the inflation and Fed transmission channel reverses back toward gold-negative conditions. The continued closure of the Strait of Hormuz limits the downside for oil prices.
- Volume confirmation on any gold recovery attempts: Low-volume bounces reinforce the bearish interpretation. High-volume reversals that sustain above $4,509 would warrant genuine reassessment of the bearish case.
- GDXJ and SLV price action: Continued weakness in mining stocks and silver would reinforce the bearish thesis across the complex.
- Geopolitical resolution signals: A genuine diplomatic framework addressing Strait access could restore safe-haven demand. Based on available evidence — including the failed Trump-Xi summit and Iran's establishment of a permanent regulatory authority — no such pathway is currently visible.
The Longer-Term Context: Bearish Signal Within a Structural Bull Market
It is important to position the current gold price bearish signal within the appropriate long-term framework. Gold remains substantially higher on a year-over-year basis, reflecting durable structural demand drivers. These include central bank gold demand, de-dollarisation trends among emerging market economies, and the long-term inflation hedging function that institutional investors assign to bullion.
The bearish signals currently present are best understood as describing a near-to-medium-term corrective phase operating within a longer-term structural uptrend. Gold experiencing a correction of 10-15% while remaining above multi-year support levels would be entirely consistent with the historical pattern of corrections within secular bull markets.
The critical risk management consideration for investors with existing gold exposure is therefore not whether to abandon long-term positioning based on short-term technical signals, but rather how to size and hedge that exposure appropriately while the corrective pressure plays out. Short-term bearish signals and long-term structural bullishness are not mutually exclusive — they frequently co-exist, and the distinction between them determines whether a temporary pullback becomes a regrettable loss or simply a passage through turbulence within an ongoing uptrend.
This article is intended for informational and educational purposes only and does not constitute financial advice or a recommendation to buy or sell any security or commodity. All technical analysis, price levels, and market observations reflect conditions as of May 18, 2026, and are subject to change. Past performance of technical signals does not guarantee future results. Investors should conduct their own due diligence and consult qualified financial advisors before making investment decisions. Readers seeking additional perspectives on gold market analysis can explore related commentary at Gold-Eagle.com, which publishes regular editorials from independent precious metals analysts.
Want To Be First When The Next Major ASX Mineral Discovery Hits The Market?
While gold navigates this complex corrective phase, Discovery Alert's proprietary Discovery IQ model scans ASX announcements in real time, delivering instant alerts on significant mineral discoveries across 30+ commodities — transforming raw data into actionable opportunities for investors at every level. Explore the historic returns major discoveries have generated and begin your 14-day free trial at Discovery Alert to position yourself ahead of the broader market.