May 20, 2026
The Hidden Architecture Behind Gold's Institutional Bull Case
Precious metals markets have a long history of confusing short-term participants. Price corrections that last weeks or months routinely trigger headlines proclaiming the end of bull runs, while the structural forces underpinning multi-year trends quietly compound in the background. Today's gold market is a textbook example of this dynamic in action. The question for serious investors is not whether gold has pulled back, but whether the architecture supporting the long-term thesis remains intact.
Understanding why brokerages stay bullish on gold price despite near-term pressure requires separating two fundamentally different analytical exercises: forecasting where a price will be in three months, and identifying the directional trajectory over a multi-year cycle. Institutional analysts are doing both simultaneously, and the conclusions are pointing in the same direction even as the near-term numbers get trimmed.
When big ASX news breaks, our subscribers know first
What Macro Forces Are Creating Near-Term Headwinds for Gold in 2026?
The current soft patch in gold pricing is not random. Three interconnected macro forces have converged to create a meaningful but arguably temporary ceiling on spot prices.
| Macro Headwind | Mechanism of Impact | Estimated Intensity |
|---|---|---|
| Rising Bond Yields | Increases the opportunity cost of holding non-yielding gold | High |
| U.S. Dollar Strength | Raises the effective cost of gold for non-USD buyers | Moderate to High |
| Reduced Fed Rate-Cut Expectations | Delays the monetary pivot that historically accelerates gold demand | Moderate |
Each of these pressures is interconnected. When yields rise, the dollar typically strengthens, which in turn suppresses demand from international buyers and weighs on ETF inflows. Furthermore, the combination creates a self-reinforcing short-term drag that shows up clearly in the market's positioning data. The relationship between gold and bond yields is therefore one of the most critical dynamics to monitor during periods of monetary uncertainty.
The Counterintuitive Impact of Geopolitical Conflict on Gold Prices
Most investors assume that geopolitical tension is unambiguously positive for gold's safe-haven role as an asset. The reality is considerably more nuanced. The conflict that began on February 28, 2026 between the U.S. and Iran triggered a roughly 14% decline in spot gold from the onset, a move that initially appears paradoxical but becomes logical once the transmission mechanism is understood.
Oil price shocks, which often accompany Middle East conflicts, feed directly into inflation expectations. When markets price in a higher-for-longer interest rate environment in response to energy price surges, bond yields rise and the U.S. dollar strengthens. Both of these outcomes simultaneously suppress gold, even as raw geopolitical fear might otherwise support it. This is one of the more counterintuitive dynamics in precious metals markets and one that many retail investors consistently misread.
The interaction between energy shocks, inflation expectations, and real yield dynamics creates a trap for investors who buy gold purely on geopolitical headlines without accounting for the monetary policy response that typically follows an oil spike.
Reading the COMEX Signal: What Futures Markets Are Telling Us
For those who follow gold at a structural level, the COMEX data tells a revealing story. Aggregate gold futures open interest and trading volumes have remained depressed throughout this period. Net Managed Money positioning on futures markets has stagnated at low levels, and ETF inflows have slowed considerably. This trifecta of subdued metrics points not to an exit from gold by institutional players, but rather to a pause in active accumulation.
Why does this matter for directional conviction?
- Stagnant COMEX open interest indicates that large speculative participants are waiting on the sidelines rather than actively shorting the market
- Depressed ETF flows in a period of macro uncertainty are consistent with prior mid-cycle consolidation phases rather than structural bear turns
- Net Managed Money positioning is a recognised leading indicator: when it reverses upward, it historically precedes significant price moves
The absence of aggressive net short positioning is itself a signal. Bears are not pressing the market with conviction, which suggests the downside is being driven by lack of buying rather than active selling pressure.
Where Are the Major Banks Setting Their Gold Price Targets for 2026?
The institutional gold price forecasts for 2026 reflect the tension between near-term caution and medium-term conviction. The numbers across major banks are worth examining in detail.
| Institution | Revised 2026 Average Forecast | End-2026 Target | Key Rationale |
|---|---|---|---|
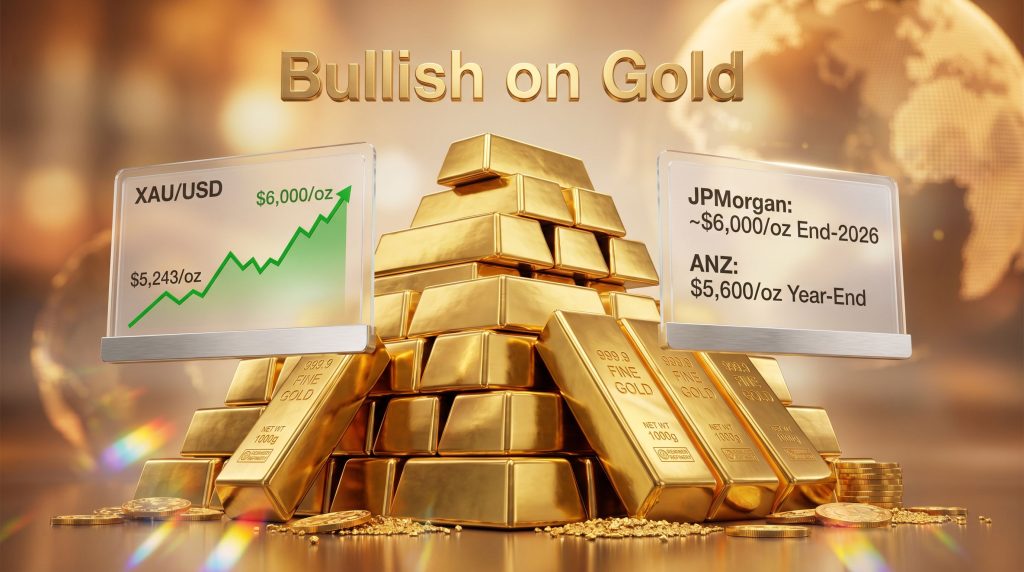
| JPMorgan | $5,243/oz (revised from $5,708/oz) | ~$6,000/oz | Demand recovery expected in H2 2026 |
| ANZ | $5,600/oz year-end target | $5,600/oz | Inflation, yields, and dollar pressure cited |
| ING (Manthey) | ~$5,000/oz by year-end | $5,000/oz | Near-term headwinds to be navigated |
| Goldman Sachs | Long-term upward bias maintained | Elevated long-term target | Safe-haven and diversification flows |
JPMorgan's revision is instructive. The bank cut its 2026 average price forecast from $5,708 to $5,243 per ounce, acknowledging that investor client interest in gold has effectively dried up in the near term. Yet the same research maintained a directional call toward $6,000 per ounce by end-2026, projecting that the energy and inflation uncertainty currently suppressing demand will eventually clear, allowing central bank and investor buying to re-intensify through the second half of the year. According to Reuters, JPMorgan's conviction on this trajectory remains firmly intact despite the revised averages.
ANZ similarly moved its year-end target to $5,600 per ounce, citing the triple headwinds of inflation expectations, higher yields, and dollar strength. ING's analysis points to approximately $5,000 per ounce by year-end as the base case, acknowledging that the path there will require navigating the current headwinds rather than ignoring them.
Why Forecast Cuts Are Not the Same as Bearish Calls
This is perhaps the most important conceptual distinction for investors to internalise. An average annual price forecast reflects the expected mean of daily closes across a twelve-month period. An end-year price target reflects where the price is expected to land at a specific point in time. When analysts cut the average forecast while maintaining a high end-year target, they are explicitly embedding an assumption that H1 will be weak and H2 will be strong.
Put simply: downward forecast revisions applied to the average are entirely compatible with an end-year target that implies significant upside from current levels. Conflating the two leads investors to misread institutional conviction.
What Is Driving the Persistent Bullish Conviction Among Institutional Analysts?
Central Bank Accumulation: The Demand Floor That Anchors the Bull Case
No single demand driver is more important to gold's structural thesis than central bank accumulation. Unlike retail investors or hedge funds, sovereign buyers operate on multi-year mandates and are largely indifferent to short-term price fluctuations. Their buying programs provide a demand floor that absorbs selling pressure during weak periods.
JPMorgan estimates that combined central bank and investor demand is averaging approximately 585 tonnes per quarter through 2026. The scale of this number is significant. Furthermore, emerging market central bank gold reserves remain structurally underweight relative to their developed-market counterparts, and the diversification thesis away from U.S. dollar-denominated reserve assets has been gaining momentum for several years.
The geopolitical logic here is straightforward:
- Countries seeking to reduce exposure to U.S. financial sanctions risk have strong incentives to hold physical gold as a neutral reserve asset
- The freezing of Russian sovereign assets in 2022 accelerated this thinking among non-Western central banks
- Gold cannot be sanctioned, seized, or digitally blocked, making it uniquely attractive for reserve diversification
- The structural underweight position of many emerging market central banks implies a multi-year accumulation runway that is largely insensitive to short-term price action
The Five Structural Pillars Supporting Long-Term Demand
Beyond central bank gold demand, the following demand catalysts remain intact regardless of near-term price movements:
- Persistent inflation uncertainty across developed economies, undermining the real purchasing power of fixed-income alternatives
- Geopolitical fragmentation, with traditional alliances fracturing and trade relationships being restructured
- Tariff and trade-war risk adding layers of supply chain uncertainty that historically support hard assets
- Recession probability remaining elevated in key Western economies, keeping safe-haven demand structurally alive
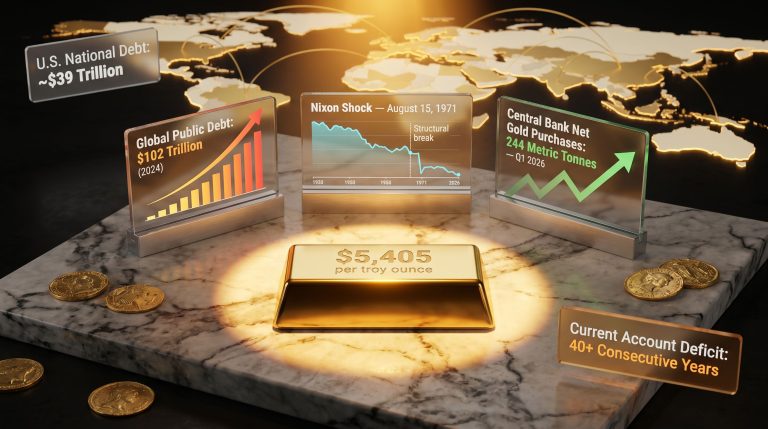
- Eroding confidence in U.S. fiscal credibility, with sovereign debt approaching $40 trillion and no credible long-term stabilisation path in sight
Veteran gold market analyst Pierre Lassonde has publicly argued that the trajectory of U.S. sovereign debt is itself a structural catalyst for dramatically higher gold prices over the long term, suggesting that fiscal deterioration of this magnitude historically correlates with significant gold price appreciation.
The H2 2026 Recovery Thesis: What Needs to Happen
JPMorgan's bullish medium-term case hinges on a specific sequence of events playing out in the second half of 2026. For this thesis to materialise, the following conditions need to coalesce:
- Energy price uncertainty must begin to resolve, reducing the inflation premium embedded in yields
- The Federal Reserve must signal, or credibly move toward, a pivot away from restrictive monetary policy
- Dollar strength must stabilise or reverse, removing the headwind for non-USD gold buyers
- ETF inflows must resume as macro visibility improves, providing the momentum catalyst for institutional positioning to rebuild
None of these conditions requires an extraordinarily optimistic macro scenario. They simply require the current period of peak uncertainty to pass.
Is the Current Gold Price Weakness a Buying Opportunity or a Warning Signal?
Three Scenarios for Gold Through End-2026
Responsible analysis requires acknowledging that institutional consensus can be wrong. The following scenario framework captures the range of plausible outcomes. This analysis is speculative and should not be construed as financial advice.
Scenario A: Bull Case (Probability: Moderate to High)
- Fed signals rate cuts in Q3 2026
- Dollar weakens materially; real yields fall
- ETF inflows resume and central bank buying accelerates
- Gold approaches $5,800 to $6,000 per ounce by year-end
Scenario B: Base Case (Probability: Moderate)
- Macro uncertainty persists but does not escalate further
- Yields stabilise; dollar consolidates around current levels
- Demand recovers gradually through H2 2026
- Gold settles in the $5,200 to $5,600 per ounce range
Scenario C: Bear Case (Probability: Low)
- Inflation re-accelerates; the Fed resumes tightening
- Dollar surges; real yields spike to multi-year highs
- Investor demand remains suppressed for an extended period
- Gold tests $4,500 to $4,800 per ounce support zones
The bear case is considered low probability by most institutional analysts, primarily because central bank buying provides a demand floor that makes sustained moves to those levels structurally difficult to maintain even in adverse macro conditions.
How Does the Global Demand Picture Shape the Long-Term Outlook?
Geographic Demand Drivers Beyond the U.S. Market
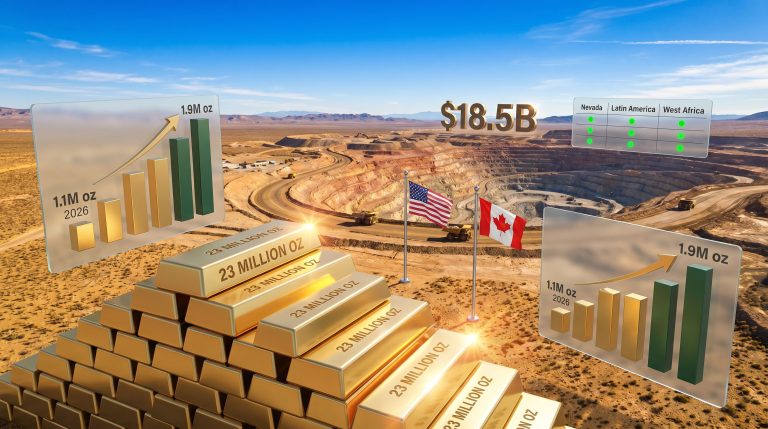
One of the most underappreciated aspects of gold's current bull market is that it is increasingly not a U.S.-dollar-centric phenomenon. Demand is being driven by a geographically diverse set of buyers, many of whom are accumulating for reasons entirely independent of Fed policy.
- European institutional demand has been building through ETF accumulation and sovereign diversification programs that have accelerated since the Russian asset freeze
- Asian physical demand from China and India continues to provide a consumption floor through bar, coin, and jewellery channels that absorbs supply during weak Western investment periods
- Emerging market central banks represent the most structurally durable demand source, with buying programs that operate largely independently of short-term price signals
This geographic diversification of demand is itself a reason why the gold bull market has proven more resilient than prior cycles. Consequently, when Western investor demand weakens, Eastern physical and sovereign buying absorbs the slack with greater consistency than in historical episodes.
The U.S. Debt Overhang as a Long-Term Catalyst
With U.S. sovereign debt approaching $40 trillion, the fiscal backdrop for gold has arguably never been more constructive over a long-term horizon. Historical analysis consistently shows that periods of sustained fiscal deterioration in reserve currency nations correlate with gold price appreciation, as market participants gradually reassess the risk-free status of government bonds. Major brokerages analysing these trends broadly agree that this fiscal dynamic represents one of the most compelling long-term catalysts for gold.
If confidence in U.S. fiscal sustainability continues to erode, gold's role as the only reserve asset without a corresponding liability becomes increasingly valuable in portfolio construction. However, the speed at which this catalyst materialises remains uncertain, underscoring why brokerages stay bullish on gold price despite near-term pressure rather than making aggressive short-term calls.
The next major ASX story will hit our subscribers first
FAQ: Brokerages, Gold Price Forecasts, and What Investors Need to Know
Why are brokerages still bullish on gold even as they cut their price forecasts?
Forecast revisions reflect adjustments to near-term timing assumptions, not the underlying structural demand thesis. Banks are recalibrating for softer short-term demand metrics while maintaining conviction that central bank accumulation and macro uncertainty will drive prices significantly higher over the medium term.
What is the current institutional consensus for gold at end-2026?
Targets vary across institutions, but the directional consensus points materially upward. JPMorgan targets approximately $6,000 per ounce by end-2026, ANZ has set a $5,600 per ounce year-end target, and ING projects approximately $5,000 per ounce, all implying meaningful upside from current levels.
What would cause the bullish gold thesis to break down?
A sustained structural reversal would likely require aggressive Fed tightening, a prolonged dollar bull run, rapid resolution of geopolitical tensions, and a significant reversal in central bank buying programs converging simultaneously. Most institutional analysts consider this combination unlikely.
How does COMEX futures data help predict gold price direction?
COMEX open interest and net Managed Money positioning are recognised leading indicators of institutional sentiment. Stagnant or declining positioning indicates near-term demand weakness, while a resumption of net long positioning has historically preceded meaningful price recoveries.
What role does central bank buying play in supporting gold prices?
Sovereign buyers, particularly in emerging markets, represent one of the most consistent and price-insensitive sources of gold demand globally. Their structural accumulation programs provide a demand floor that limits downside even during periods of subdued investor appetite. Indeed, this is precisely why brokerages stay bullish on gold price despite near-term pressure from macroeconomic headwinds.
Disclaimer: This article is intended for informational purposes only and does not constitute financial advice or a solicitation to buy or sell any financial instrument. All forecasts and price targets referenced are those of the respective institutions cited and are subject to change. Investors should conduct their own due diligence before making any investment decisions.
Want to Know When the Next Major Gold Discovery Hits the ASX?
While institutional analysts debate gold's long-term price trajectory, Discovery Alert's proprietary Discovery IQ model scans ASX announcements in real time, instantly alerting subscribers to significant mineral discoveries before the broader market reacts. Explore historic discovery returns to understand what early positioning can mean for investors, and begin your 14-day free trial today at Discovery Alert.