July 23, 2026
Why Gold Price Corrections Hit Mining Stocks Harder Than Bullion
Commodity markets have a long history of punishing investors who confuse the price of a raw material with the profitability of the companies that extract it. Nowhere is this gap more consequential than in gold mining, where the relationship between the metal price and producer margins operates through a mechanism that amplifies both gains and losses far beyond what the spot price alone would suggest. Understanding that amplification effect, and how it interacts with monetary policy cycles, cost structures, and balance sheet dynamics, is the foundation for evaluating what a gold price correction and gold miners' margins actually mean for investors navigating the mid-2026 environment.
When big ASX news breaks, our subscribers know first
The Operating Leverage Engine: Why Miners Are Not Just a Gold Proxy
Gold mining companies carry largely fixed cost bases. Labour contracts, equipment leases, processing infrastructure, and corporate overhead do not reprice in real time when the gold spot price moves. Revenue, however, does. When gold rises, every additional dollar per ounce flows almost entirely to the margin line. When gold falls, that same fixed-cost structure means profits compress faster than the commodity itself declines.
The single metric that captures this dynamic most precisely is the gross margin per ounce calculation: realised gold price minus All-In Sustaining Cost (AISC). This figure drives equity valuations across the sector because it determines how much cash a producer generates on every ounce sold, and whether that cash can fund sustaining capital, growth investment, and shareholder returns simultaneously. Furthermore, understanding the gold price and mining equities relationship is essential for interpreting how corrections ripple through producer valuations.
What AISC Actually Measures
AISC is the gold industry's standardised measure of total production economics. Unlike simpler cash cost metrics, AISC incorporates sustaining capital expenditure, royalty payments, reclamation costs, and corporate-level overhead, providing a more complete picture of the true cost to maintain ongoing mine operations. Industry-wide AISC has risen approximately 3% in recent quarters to around $1,600/oz, pushed higher by energy cost inflation, tighter labour markets, and declining ore grades at older operations.
Critically, AISC is not uniform across the sector. Three structurally distinct cost profiles define the producer landscape:
-
Heap leach oxide operations process lower-grade ore through a relatively simple irrigation and recovery method, typically requiring less capital than sulfide or refractory processing. This simplicity often translates into lower per-ounce costs and faster cash generation timelines.
-
High-grade underground mines benefit from concentrated mineralisation that reduces the volume of material moved per recovered ounce, partially offsetting the higher per-tonne cost of underground development.
-
Open-pit bulk tonnage operations depend on high volume throughput to dilute fixed costs, making them more sensitive to diesel price movements and haulage intensity.
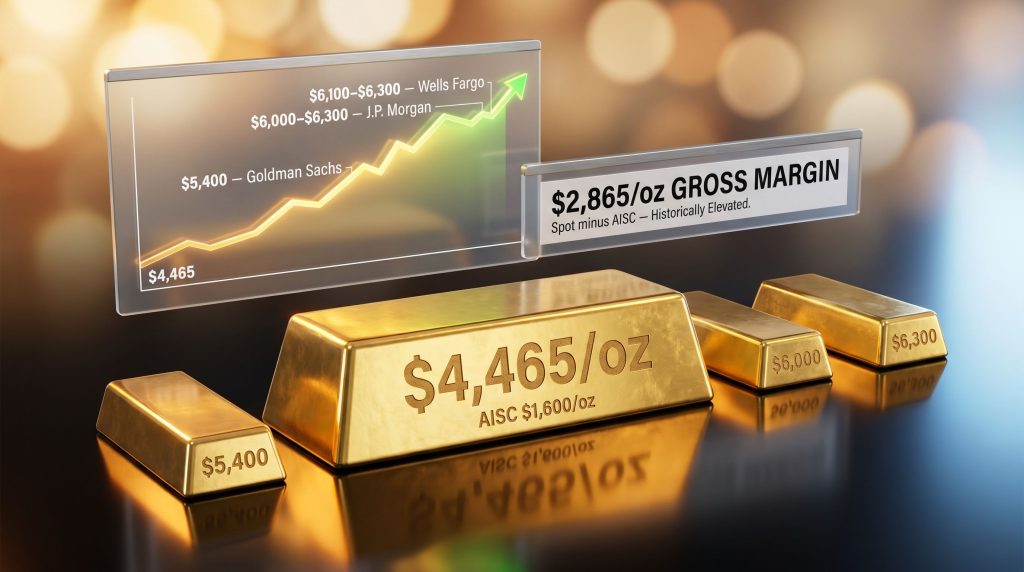
At a spot price of approximately $4,465/oz against an industry-average AISC of ~$1,600/oz, the sector-wide gross margin sits near $2,865/oz. By any historical measure, that is an extraordinarily wide buffer, one that persists even after the recent correction.
Key Insight: A 16% gold price drawdown from the January 2026 peak has not broken producer economics. It has compressed margins from an extreme level to a merely exceptional one. Equity market volatility during a correction can obscure this reality, creating disconnects between stock prices and underlying cash generation that patient investors have historically exploited.
The Monetary Policy Mechanism Behind the Gold Price Correction
Real Yields and the Dollar: Gold's Two-Variable Pricing Model
Gold is a non-yielding asset. Its opportunity cost rises directly in proportion to real Treasury yields because holding gold means forgoing the interest available on government debt. When the US Federal Reserve maintained its policy rate at 3.50% to 3.75% through mid-2026, it kept real yields elevated while simultaneously supporting a stronger US dollar, creating a double headwind for gold.
A stronger dollar compounds the gold price pressure through a secondary channel: it raises the effective price of dollar-denominated gold for buyers using other currencies, reducing international demand. The combined force of higher real yields and dollar strength drove gold from its January 28, 2026 high of $5,589/oz to approximately $4,465/oz, a drawdown of roughly 16%. In addition, the gold and bond dynamics at play during this period illustrate how rising real yields directly suppress bullion valuations.
FOMC minutes from the April 28-29 meeting confirmed that most policymakers do not anticipate rate reductions before Q3-Q4 2026, with US inflation running at 3.8% year-on-year creating a stagflationary backdrop. April non-farm payrolls printed at 115,000, above the 62,000 consensus but well below March's 185,000, reflecting a labour market that is softening without yet justifying a policy pivot. Swaps markets at the time of writing price only a 5% implied probability of a rate cut at the June 16-17 FOMC meeting.
The May Payrolls Scenario Matrix
The May non-farm payrolls report, due June 6, represents the most immediate catalyst for shifting rate-cut expectations and, by extension, gold price direction. The table below maps potential outcomes to their likely market implications:
| Payrolls Scenario | Market Interpretation | Rate-Cut Probability Shift | Likely Gold Direction |
|---|---|---|---|
| Below 100,000 | Labour market deteriorating; pivot closer | Near-zero to 35%-40% (Sept. 2026) | Supportive; real yields likely fall |
| 100,000 to 150,000 | Soft landing narrative intact; Fed on hold | Minimal change | Neutral to slightly positive |
| Above 185,000 | Labour market resilient; hike risk rises | Cut probability falls further | Negative; real yields likely rise |
| Above 200,000 + upward revisions | Strong growth momentum | Q1 2027 hike probability climbs toward 30% | Materially negative near-term |
The June 16-17 FOMC meeting's updated dot plot adds a second layer of potential price movement. If the committee signals a more hawkish trajectory, 10-year Treasury yields could approach new one-year highs, extending the correction. A dovish revision, however, could pull real yields lower and trigger a partial gold price recovery.
Structural Demand: Why the Gold Price Correction Does Not Invalidate the Bull Case
Central Bank and Institutional Demand Remain Intact
The bear case for gold assumes that monetary tightening represents a structural, rather than cyclical, headwind. The demand data complicate that narrative significantly. Central bank gold demand reached 244 tonnes in Q1 2026, reflecting continued reserve diversification away from US dollar assets. Total gold demand reached a record quarterly value of $193 billion in Q1 2026, driven by sovereign buying and a meaningful increase in European institutional allocations.
Mine supply provides no relief valve. Industry consensus suggests that gold prices would need to fall toward $3,500 to $4,000/oz before new project development became genuinely uneconomic at scale, a threshold well below current spot prices. Energy shortages affecting certain operations and low available recycling inventories further constrain the supply response, meaning the market cannot easily self-balance by increasing output.
The Institutional Forecast Gap
The divergence between current spot prices and major bank year-end targets is unusually pronounced by historical standards:
| Institution | Year-End 2026 Target | Implied Upside vs. ~$4,465/oz |
|---|---|---|
| J.P. Morgan | $6,000 to $6,300/oz | 34% to 41% |
| Wells Fargo | $6,100 to $6,300/oz | 37% to 41% |
| Goldman Sachs | $5,400/oz | ~21% |
| Consensus Midpoint | ~$5,243 to $5,900/oz | ~17% to 32% |
Sources: J.P. Morgan; Goldman Sachs; Wells Fargo; publicly available institutional research, June 2026.
If gold recovers to only the lower bound of this institutional consensus (~$5,243/oz), producers operating at industry-average AISC would see gross margins expand by a further $778/oz on every ounce sold. For companies with exposure to multi-hundred-thousand-ounce annual production profiles, that incremental margin translates into material free cash flow growth. However, identifying undervalued mining stocks during this correction window requires careful analysis of both cost structure and balance sheet resilience.
Featured Snippet: What is the institutional gold price forecast for 2026? Major financial institutions including J.P. Morgan, Goldman Sachs, and Wells Fargo have published year-end 2026 gold price targets ranging from $5,400/oz to $6,300/oz, representing 17% to 41% upside from the mid-2026 spot price of approximately $4,465/oz.
How Cost Structure Determines Who Survives a Gold Price Correction
Three Producer Tiers and Their Margin Resilience
Tier 1: Low-Cost Producers (AISC below $1,800/oz)
These operations retain strong margins even during a significant price pullback. Heap leach oxide mines often populate this tier, generating cash flow through lower capital intensity and simpler processing chemistry. At $4,465/oz spot, a producer with $1,600/oz AISC retains a $2,865/oz gross margin, sufficient to fund sustaining capital, growth investment, and dividends simultaneously.
Tier 2: Mid-Cost Producers (AISC $1,800 to $2,600/oz)
This group remains profitable but experiences meaningful margin compression during a correction. Cash margins in the $1,865 to $2,665/oz range at current spot prices leave room for operations but reduce the buffer available for discretionary investment. A gold price recovery toward $4,700 to $4,850/oz would expand free cash flow materially for this tier through direct operating leverage.
Tier 3: Ramp-Up Producers (AISC temporarily above $3,000/oz)
This category is frequently misread by equity markets. Elevated per-ounce costs during early production phases reflect the mechanics of fixed-cost spreading across lower initial throughput volumes, not structural uneconomics. West Red Lake Gold Mines reported Q1 2026 cash costs of US$2,594/oz and AISC of US$4,678/oz at its Madsen Mine in Ontario, with approximately 60% of 2026 production scheduled for H2 as additional mining areas come online. The per-ounce cost trajectory will compress materially as volume increases, a dynamic that forward-looking valuation models must account for but that near-term earnings headlines often fail to convey.
The Energy Cost Multiplier
Diesel and electricity represent a structurally significant share of mine operating costs, particularly for open-pit operations with high haulage requirements. The most challenging margin environment for mid-to-high-cost producers is not a gold price correction in isolation; it is a correction that coincides with elevated oil prices. According to VanEck's analysis of gold miners' margins, producers with fixed-price energy contracts, renewable power arrangements, or inherently lower haulage intensity are meaningfully better positioned to withstand this compounding pressure.
Risk Callout: When a gold price correction and gold miners' margins are simultaneously pressured by rising energy costs and broad equity market weakness, mining stock drawdowns can substantially exceed the percentage decline in bullion itself. This triple-compression scenario represents the key downside tail risk for undercapitalised or high-cost producers.
Four Operational Qualities That Define Outperformance During a Correction
1. AISC Trajectory Direction
A declining AISC trajectory is often more valuable than a low absolute AISC figure. Ramp-up producers scheduled to increase throughput in the second half of a production year can expand margins through volume alone, without any change in the gold price. The market frequently prices these companies as if their early-stage elevated costs are permanent, creating valuation discounts that correct as throughput data confirms the improvement curve.
2. Balance Sheet Insulation from Capital Markets
Producers with fully funded balance sheets can continue advancing exploration, permitting, and development programmes during a correction without issuing equity at depressed valuations. i-80 Gold's $787.5 million recapitalisation completed in Q1 2026, providing $513.5 million in cash and eliminating its going-concern disclosure, exemplifies this principle. The company is targeting 150,000 to 200,000 oz/year from Phase 1 beginning in 2028, scaling toward approximately 600,000 oz/year at Phase 3.
Ownership of one of only two autoclave processing facilities in Nevada provides a strategic infrastructure moat that supports that production growth ambition while reducing marginal per-tonne processing costs for ore from multiple deposits across its portfolio.
3. Processing Infrastructure Ownership
Control over processing capacity is a frequently underappreciated competitive advantage in gold mining. Autoclave facilities, which are required for refractory sulphide ore that cannot be recovered through conventional cyanide leaching, represent significant capital investment and long construction timelines. A company that owns such infrastructure can process ore from adjacent or acquired deposits without incurring third-party tolling costs, materially improving the economics of satellite development projects.
4. Jurisdiction and Permitting Certainty
Assets in established mining jurisdictions such as Nevada or Ontario typically attract lower equity discount rates because permitting frameworks, environmental review timelines, and regulatory requirements are well-understood. The US federal FAST-41 permitting reform framework can shorten National Environmental Policy Act (NEPA) review timelines, reducing development risk and improving investor confidence in the timing of future cash flows.
High jurisdiction risk does not automatically disqualify an investment case, however. Serabi Gold, operating in Brazil, generated a Q1 2026 post-tax profit of $21.0 million on revenue of $50.6 million, its highest quarterly profit on record, while carrying no debt. With AISC of $2,293/oz and a realised gold price of $4,926/oz, the company achieved a cash margin of approximately $2,633/oz, a performance level that compensates for the broader sovereign risk discount embedded in its sector valuation. Cash on hand had grown to approximately $65 million by quarter-end following a period of significant production and profitability growth.
Similarly, Integra Resources reported a 40% operating margin at its Florida Canyon heap leach operation in Q1 2026 at a realised gold price of $4,854/oz, with mine-site AISC of $3,310/oz reflecting lower production volumes and royalty payments indexed to stronger gold prices. The company's guidance projects 80,000 to 90,000 oz/year in both 2027 and 2028, a volume ramp that would spread fixed costs across materially more production and drive AISC toward steady-state economics.
The next major ASX story will hit our subscribers first
EV/oz Multiples, Valuation Compression, and the Re-Rating Pathway
Enterprise value per ounce of resource or reserve (EV/oz) is the primary relative valuation tool for gold equities because it normalises company valuations against the underlying commodity inventory each business controls. During a gold price correction, EV/oz multiples compress across the sector as equity prices decline faster than resource estimates change, creating valuation dislocations for investors with sufficiently long time horizons. Consequently, gold's gold safe-haven appeal during periods of broader market stress can partially offset sentiment-driven selling in the producer equities themselves.
Three catalysts can restore compressed EV/oz multiples:
-
Production volume growth that reduces per-ounce fixed costs, improving reported AISC and demonstrating the path to steady-state economics across ramp-up operations.
-
Permitting milestones such as advancing through NEPA review, securing environmental approvals, or receiving operating permits, all of which reduce project risk and lower the discount rate investors apply to future cash flows.
-
Gold price recovery toward institutional year-end targets, which would expand margins on every ounce produced, drive earnings upgrades, and support multiple expansion simultaneously across the producer universe.
Featured Snippet: Why do gold mining stocks fall more than gold during a correction? Gold mining equities carry operating leverage to the gold price. When gold falls, revenue per ounce declines while fixed costs remain largely unchanged, compressing profit margins at a faster rate than the commodity itself. Additionally, mining stocks are subject to broader equity market sentiment, meaning general risk-off selling can add pressure that extends beyond the gold-specific correction.
Key Macro Catalysts to Monitor Through the Second Half of 2026
The near-term directional case for a gold price correction and gold miners' margins rests on a handful of measurable data points and scheduled events. As noted by Investing.com's analysis of margin pressure, elevated energy costs compound the challenge for producers already navigating a softer gold price environment:
-
May Non-Farm Payrolls (June 6): A sub-100,000 reading could push the implied probability of a September 2026 Fed rate cut from near-zero toward 35% to 40%, reducing real yields and supporting gold price recovery.
-
June 16-17 FOMC Meeting: The updated dot plot will reveal whether the committee's 2026 rate cut expectations have shifted. A hawkish surprise adds further gold price pressure; a dovish revision supports recovery.
-
US CPI Trajectory: With inflation at 3.8% year-on-year, any acceleration reinforces the higher-for-longer policy stance. Deceleration toward 3.0% to 3.5% would increase rate-cut confidence and reduce the opportunity cost of holding gold.
-
Central Bank Purchasing Data: Continuation of the 244-tonne Q1 2026 sovereign buying rate would confirm that structural demand remains insulated from short-term monetary policy dynamics.
-
ETF Flow Trends: European institutional investors increased gold allocations during Q1 and Q2 2026. A decline in US real yields could trigger renewed ETF inflows from North American investors, adding a third demand layer alongside central bank and Asian buying.
-
Q1 2027 Rate Hike Tail Risk: Swaps markets currently price a 30% implied probability of a rate hike in Q1 2027. If growth data strengthen this scenario, real yields could rise further, extending the correction and disproportionately pressuring producers with elevated cost structures or limited cash reserves.
Disclaimer: This article contains forward-looking statements, institutional price forecasts, and scenario modelling that involve inherent uncertainty. Gold prices, AISC figures, payrolls data, and interest rate expectations can change materially and rapidly. Nothing in this article constitutes financial advice. Readers should conduct independent due diligence before making any investment decisions. All financial data referenced reflects publicly available information as of early June 2026.
Want to Capitalise on the Next Major Gold Discovery Before the Market Moves?
Discovery Alert's proprietary Discovery IQ model delivers real-time alerts on significant ASX mineral discoveries, instantly translating complex geological and commodity data into actionable investment insights — giving subscribers a critical edge during both gold price corrections and recovery cycles. Start your 14-day free trial today, or explore Discovery Alert's discoveries page to see how historic mineral discoveries have generated substantial returns even through challenging market conditions.