
July 24, 2026
When Patience Becomes a Strategy: Reading Gold's 2026 Correction With Precision
Precious metals markets have a long history of confounding both bulls and bears at precisely the wrong moments. Corrections within structural uptrends are among the most psychologically demanding environments an investor can navigate, because the surface-level signals point one direction while the underlying architecture points another. Gold price downtrend and Fed rate hike expectations are at the centre of this dynamic in mid-2026, and understanding the forces at work requires looking beyond the headlines and into the mechanics of monetary policy, technical structure, and inflation mathematics.
When big ASX news breaks, our subscribers know first
The Anatomy of a 19% Drawdown Inside a Bull Market
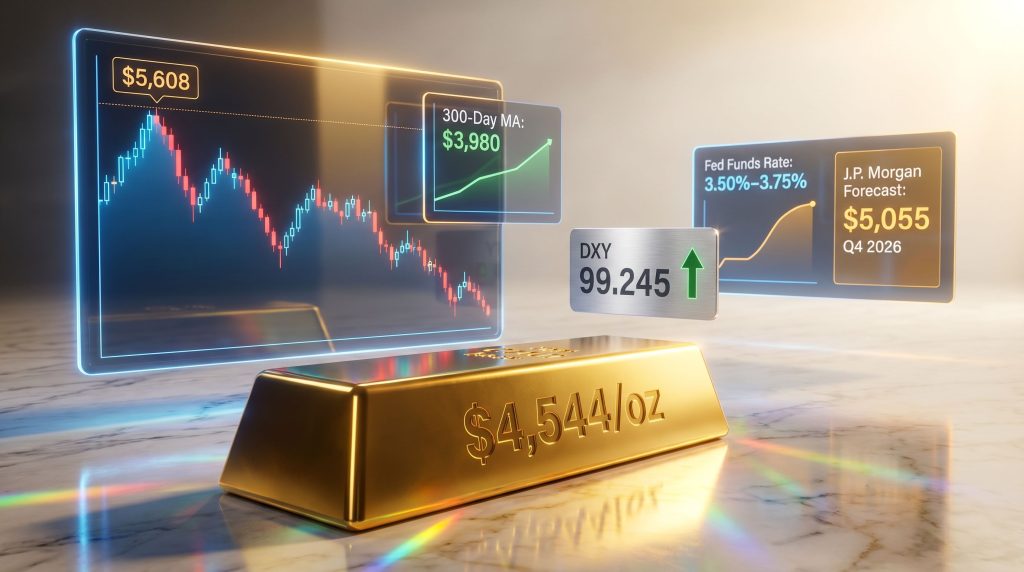
Gold established an intraday all-time high of $5,586/oz on January 29, 2026, with its all-time closing high of $5,411/oz recorded the previous day. From that historic peak, prices have retreated steadily, settling near $4,544/oz by mid-May 2026. That represents a drawdown of approximately 19% from peak levels, a figure alarming enough to attract bearish commentary but insufficient on its own to define a structural trend reversal.
Context matters enormously here. Despite the correction, gold remains roughly 42% higher year-over-year, a statistic that should anchor any objective assessment of the market's condition. The 300-day moving average currently sits at approximately $3,980/oz and continues to rise, confirming that the long-term trajectory has not been compromised. What investors are experiencing is a cyclical pullback within an ongoing bull market, not the beginning of a prolonged bear phase.
The distinction between a cyclical correction and a structural reversal is more than semantic. It determines whether accumulation or liquidation is the appropriate strategic response, and confusing the two has historically been one of the most costly errors in precious metals investing. Furthermore, gold price forecasts from major institutions continue to reflect long-term optimism despite the near-term turbulence.
How the Gold Price Downtrend and Fed Rate Hike Expectations Are Connected
The relationship between interest rates and gold prices is one of the most well-documented dynamics in financial markets. Gold pays no interest or dividends, which means its relative attractiveness fluctuates directly with the opportunity cost imposed by competing yield-bearing instruments. When rates rise, capital gravitates toward bonds, money market instruments, and other yield-generating assets, creating persistent headwinds for gold.
The current environment has crystallised this dynamic with unusual clarity. The Fed Funds target range stands at 3.50% to 3.75%, reflecting a monetary policy stance that has remained restrictive for longer than many market participants anticipated. Markets are now increasingly pricing in the possibility of a further rate increase at the June 17, 2026 FOMC Policy Statement meeting, a scenario that the inflation data strongly supports. According to Investopedia's analysis of Fed rate hikes, this mechanism has historically been among the most reliable suppressors of gold's near-term price performance.
| Monetary Environment | Impact on Gold | Primary Mechanism |
|---|---|---|
| Active rate hike cycle | Bearish pressure | Rising opportunity cost of non-yielding asset |
| Extended rate hold at elevated levels | Neutral to bearish | Sustained real yield compression |
| Rate cut cycle beginning | Bullish tailwind | Falling yields reduce gold's opportunity cost |
| Negative real interest rates | Strongly bullish | Cash loses real purchasing power |
It is worth noting that the 2004 to 2006 period represented a partial exception to the standard rate-hike-equals-gold-weakness rule, a reminder that correlations in financial markets are probabilistic rather than deterministic. However, under current conditions, the directional logic is firmly aligned with downward pressure on gold. In addition, gold and bond dynamics provide further context for understanding how these competing asset classes interact throughout different phases of the economic cycle.
The Dollar's Role in Amplifying the Correction
The US Dollar Index climbed to its highest level since early April 2026, reaching 99.245, with technical analysts identifying scope for further extension toward 99.400. This level is significant because it would close a technical gap created on April 8, 2026, between the 99.400 and 98.975 levels, a pattern that typically attracts price toward completion.
A stronger dollar mechanically suppresses gold demand in two reinforcing ways. First, it makes dollar-denominated gold more expensive for international buyers operating in other currencies. Second, dollar strength during rate-repricing periods signals that capital is actively rotating toward dollar-yielding assets, directly competing with gold's role as a capital preservation vehicle.
The Inflation Mathematics the Market Has Been Ignoring
One of the more striking aspects of the current environment is how persistently above-target inflation data has been dismissed or minimised in mainstream financial commentary. Both the Consumer Price Index (CPI) and Producer Price Index (PPI) for April 2026 printed above the Federal Reserve's +2% annual target, and critically, core inflation measures that strip out food and energy remain substantially elevated. These core readings matter most to the Fed because they filter out the commodity volatility that can distort headline figures.
The Federal Reserve's preferred inflation gauge, Personal Consumption Expenditures (PCE), is due for its April release on May 28, 2026. Based on the upstream signals from CPI and PPI, there is a strong analytical case for expecting PCE to confirm the re-acceleration trend rather than contradict it.
| Inflation Indicator | April 2026 Reading | Signal for Fed Policy |
|---|---|---|
| CPI (headline) | Above +2% Fed target | Rate hike supportive |
| CPI (core) | Well above +2% target | Rate hike supportive |
| PPI | Above market expectations | Upstream price pressure building |
| PCE (April) | Pending, due May 28, 2026 | Watch closely for confirmation |
The FOMC April 28/29 Meeting Minutes, scheduled for release in the week of May 19, 2026, represent an important secondary signal. If the internal deliberations reveal a more hawkish consensus than the public-facing communications have indicated, markets may be forced to reprice rate-hike probabilities more aggressively, placing additional downward pressure on gold in the near term.
Stagflation Risk: The Question Nobody Wants to Answer
Industrial Production for April 2026 rose +0.7% month-over-month, recovering from a -0.3% contraction in March and representing the strongest monthly swing since August 2024. Taken in isolation, this is a constructive reading. However, Business Inventories have now backed up for a second consecutive month, raising a more uncomfortable question: is demand beginning to soften even as prices remain elevated?
The simultaneous presence of persistent inflation and slowing demand momentum is the definitional precondition for stagflation, a scenario that has historically been highly supportive for gold over a multi-year horizon, even if it creates short-term volatility as markets digest conflicting signals. Consequently, understanding how gold in recession periods behaves becomes increasingly relevant as leading indicators continue to deteriorate.
The Economic Barometer, a composite tracking incoming economic data, shows 9 of 15 metrics improving in the most recent reporting week and remains in an uptrend. Yet the Conference Board's Leading Indicators have failed to produce a positive reading since July 2025, a divergence that deserves close monitoring.
Divergences between coincident and leading indicators often resolve in the direction the leading indicators point. When a forward-looking composite has gone this long without a positive reading, the presumption of continued economic strength warrants scrutiny.
Technical Deterioration: What the Charts Are Actually Communicating
Gold's weekly parabolic short trend has now extended through nine consecutive weeks as of mid-May 2026. The weekly parabolic system is a structured momentum tool that generates directional signals based on price behaviour relative to trailing stop levels. Flipping this trend from short back to long requires gold to reclaim approximately $5,172/oz, a level currently $628 above the mid-May trading price of $4,544/oz.
Based on gold's expected weekly trading range of approximately 329 points, reaching $5,172 from current levels would require at minimum two consecutive strongly directional up-weeks. That is a meaningful threshold, and it illustrates why traders and short-term investors should not confuse near-term stabilisation with a genuine trend recovery.
| Technical Reference Level | Price (USD/oz) | What It Represents |
|---|---|---|
| All-time intraday high | $5,586 | January 29, 2026 peak |
| All-time closing high | $5,411 | January 28, 2026 |
| Weekly parabolic flip-to-long level | $5,172 | Required for trend reversal signal |
| BEGOS Market Value estimate | $4,769 | Proprietary fair value model |
| 10-session volume-weighted average | $4,667 | Near-term price magnet |
| Key volume resistance (Market Profile) | $4,707 | Dominant near-term resistance |
| Current mid-May price | $4,544 | Active trading level |
| 2026 year-to-date low | $4,100 | March 23, 2026 |
| Fair value per dollar debasement | $4,017 | Structural valuation anchor |
| 300-day moving average | $3,980 | Rising long-term trend support |
The 10-session directional range spans from $4,510 to $4,983, representing a swing of +273 points or +6.1%. The volume-dominant price of the past two weeks sits at $4,707, which has shifted from a support level into active resistance, a classic technical transition that adds weight to the near-term bearish case.
The Relief Rally That Failed: A Masterclass in Momentum Psychology
An instructive episode unfolded in early May 2026. Gold's regression trend consistency indicators, often referred to in technical analysis circles as Baby Blue dots, began turning upward from oversold territory. This is a historically reliable early signal that a trend's internal momentum is shifting before the trend itself formally changes direction.
The resulting rally was genuine in appearance but shallow in substance:
- Gold gained approximately +1.7%, moving from $4,702 to $4,783 between May 7 and mid-week.
- Silver surged +15.8% from 77.83 to 90.11 in just five trading sessions, appearing to confirm broad precious metals momentum.
- Both metals then reversed sharply within days, with gold falling -5.6% from its rally peak and silver declining -15.6% from its high.
- The episode has since been classified by technical analysts as a relief rally, a temporary counter-trend bounce within an ongoing downtrend, rather than a genuine reversal signal.
When early momentum signals emerge in a market where the overriding trend remains firmly negative, the probability of a false positive is elevated. Confirmation from multiple independent technical frameworks, not just a single oscillator turning up, is the professional standard before reclassifying a bounce as a structural shift.
Silver's Amplified Warning: Reading the White Metal's Message
Silver's price action in 2026 has been more dramatic than gold's by virtually every measure. Its weekly parabolic short trend has now extended to 15 consecutive weeks, nearly double the duration of gold's current short signal. Silver's May rally of 15.8% reversed into a 15.6% decline within the same week, illustrating the volatility premium that characterises the white metal.
Silver's greater sensitivity to both industrial demand signals and speculative positioning means it frequently acts as an amplified version of gold's directional moves. In a corrective environment, this amplification works against investors. Furthermore, the gold-silver ratio analysis for this period highlights just how extreme the divergence between the two metals has become relative to historical norms. Position sizing and risk management are therefore critical considerations for anyone using silver as a precious metals exposure vehicle during downtrend phases.
The next major ASX story will hit our subscribers first
What Major Banks Forecast for Gold Through the Rest of 2026
Despite the near-term technical headwinds, longer-horizon forecasts from major institutions remain constructive. J.P. Morgan has forecast gold averaging approximately $5,055/oz by Q4 2026, with a trajectory toward $5,400/oz over an extended timeframe and potential upside toward $6,000/oz over a longer horizon. These projections are grounded in structural demand factors: persistent dollar debasement, continued central bank gold demand, and geopolitical risk premiums that are unlikely to fully normalise.
Gold's fair value anchored to dollar debasement metrics is currently estimated at approximately $4,017/oz, which means current market prices carry a meaningful premium above fundamental value. This premium reflects the geopolitical and monetary uncertainty premiums the market has embedded in the price, premiums that may compress in the near term but are unlikely to disappear entirely given the structural backdrop.
Three Scenarios Investors Should Be Stress-Testing
Scenario 1: Fed Raises Rates in June 2026
The dollar extends its recent strength, potentially closing the technical gap at 99.400 and moving higher. Gold faces additional selling pressure, with analysts flagging a potential correction toward the $4,100 to $4,200 range. Silver likely underperforms gold given its higher volatility profile. This scenario is supported by the current inflation trajectory.
Scenario 2: Fed Holds, Inflation Shows Early Signs of Moderating
Gold stabilises in the $4,500 to $4,700 range. The weekly parabolic trend remains short but begins to lose downward momentum. The Baby Blue regression indicators resume their tentative recovery, setting the stage for a more durable reversal attempt in subsequent weeks. This scenario is contingent on the April PCE reading due May 28, 2026.
Scenario 3: Inflation Surprises to the Downside, Fed Signals Future Cuts
Gold reclaims the $5,000 level and begins the process of flipping its weekly trend back to long. Silver outperforms on the upside. The dollar weakens, providing an additional tailwind. This scenario carries the lowest near-term probability given current data, but represents the setup that long-term bulls are ultimately positioned for.
Key Catalysts and Dates to Monitor
| Date | Event | Relevance to Gold |
|---|---|---|
| May 28, 2026 | April PCE inflation data | Fed's preferred gauge; critical for rate-hike probability |
| Week of May 19, 2026 | FOMC April 28/29 Meeting Minutes | Potential hawkish tone revelation |
| June 17, 2026 | FOMC Policy Statement | Potential rate hike decision |
| Ongoing | Conference Board Leading Indicators | Diverging from Economic Barometer |
| Ongoing | CME FedWatch rate probabilities | Real-time pricing of Fed policy expectations |
The Structural Argument for Long-Term Gold Investors
The gold price downtrend and Fed rate hike expectations dominating the mid-2026 narrative represent a convergence of near-term headwinds, not a dismantling of the long-term investment case. The 300-day moving average remains at $3,980/oz and is still rising. Dollar debasement fair value sits at $4,017/oz. Central bank demand continues to underpin structural buying across multiple regions. These are not the characteristics of a market in structural decline.
History provides a useful guide here. Gold's most powerful multi-year bull runs have typically been preceded by exactly the kind of rate-sensitive correction currently playing out. When Federal Reserve tightening cycles reach their terminal point, the reversal in rate expectations tends to unleash the very capital that had been held in yield-bearing alternatives, and that capital frequently flows back into gold with significant force.
The challenge for investors is that identifying the terminal point of a tightening cycle in real time is genuinely difficult. It requires monitoring not just inflation prints but the interaction between inflation, employment, credit conditions, and the Fed's own evolving communication. In the current environment, that means May 28's PCE release and June 17's FOMC statement carry outsized significance.
For long-term investors with a multi-year horizon, the current correction zone between $4,000 and $4,200 may ultimately be viewed as a structurally compelling accumulation window. For short-term traders, the technically negative environment, with resistance at $4,707 and the weekly trend firmly short, argues for patience over aggression until gold demonstrates the capacity to reclaim $5,172.
Disclaimer: This article is for informational and educational purposes only and does not constitute financial advice. All forecasts, price levels, and scenario projections involve inherent uncertainty and should not be relied upon as the basis for investment decisions. Past performance of any asset class, including gold, is not indicative of future results. Readers should conduct their own due diligence and consult a licensed financial adviser before making investment decisions.
Want to Track the Next Major Mineral Discovery Before the Broader Market Does?
While gold's structural bull market plays out across multi-year cycles, significant mineral discoveries on the ASX can generate substantial returns in far shorter timeframes — and Discovery Alert's proprietary Discovery IQ model delivers real-time alerts the moment those discoveries are announced, turning complex geological data into actionable insights for investors at every experience level. Explore historic discovery returns to understand what early positioning in major finds has meant for investors, then begin your 14-day free trial to ensure you're never last to the opportunity.