
July 10, 2026
The Paradox Holding Gold Hostage Near $4,100
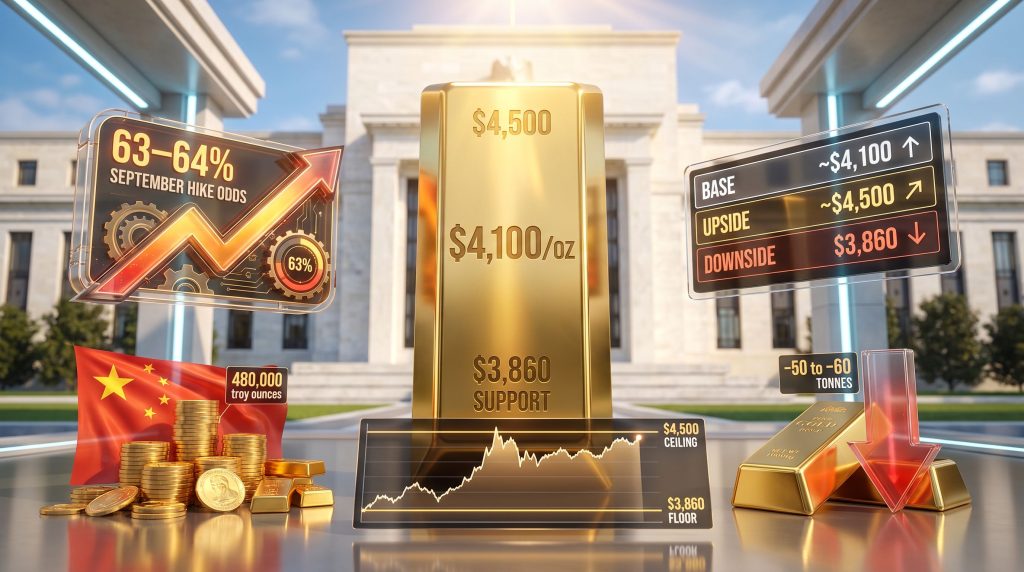
There is a rarely discussed structural irony embedded in gold's current price behaviour. The very forces that have historically been gold's greatest allies, namely geopolitical conflict, inflationary pressure, and monetary uncertainty, are now conspiring against it through an indirect but powerful mechanism. When geopolitical risk drives inflation expectations higher, it hands the Federal Reserve a justification to tighten monetary policy further, and that tightening, in turn, suppresses the non-yielding metal through the yield and dollar channels. This feedback loop is what makes gold's position near $4,100/oz in mid-2026 so analytically complex, and why September Fed hike odds pressure gold price dynamics in ways that defy simple bullish or bearish framing.
When big ASX news breaks, our subscribers know first
Why Gold Cannot Simply Be Labelled a Safe-Haven Trade Right Now
The textbook narrative positions gold as the instinctive beneficiary of uncertainty. Conflict erupts, investors flee to safety, gold rises. That relationship still holds at the margins, but the 2026 macro environment has introduced a competing dynamic that fundamentally complicates the directional trade. Understanding gold safe-haven dynamics has never been more nuanced for investors trying to position accurately.
Iranian military strikes on U.S. infrastructure in Gulf states did not simply add a geopolitical risk premium to gold. They triggered a secondary response through inflation expectations. Energy supply disruptions tied to Gulf instability feed into consumer prices, which then show up in CPI data, which then influences Federal Reserve posture. The June 2026 FOMC minutes revealed that policymakers were already expressing heightened concern about persistent inflation before those strikes fully materialised in the data. The geopolitical shock essentially accelerated a policy calculus that was already trending hawkish.
The result: September Fed rate hike probability climbed from approximately 54% to 63-64% within a single week. Markets simultaneously began pricing as many as three full rate increases across 2026, a trajectory that structurally disadvantages non-yielding assets. Spot gold reflected this pressure, declining 0.2% to $4,113.02/oz while August futures slipped 0.4% to $4,121.90, with the metal tracking toward a 1.5% weekly loss.
The same events creating uncertainty are simultaneously building the case for tighter monetary policy, a dynamic that strips gold of the clean directional conviction it typically enjoys during geopolitical stress periods.
The Dollar Amplification Effect Most Investors Underestimate
Rate hike expectations do not pressure gold through a single channel. The dollar amplification effect is a distinct but reinforcing mechanism that many retail investors fail to account for when building gold positions. Furthermore, the geopolitical gold price forecast adds another layer of complexity that demands careful analysis.
As the Fed signals tighter policy relative to other major central banks, capital flows toward U.S. fixed income, strengthening the greenback. A stronger dollar, now near 13-month highs, creates a structural demand headwind for gold that operates independently of sentiment. Because gold is priced in dollars globally, dollar appreciation mechanically makes the metal more expensive for buyers operating in euros, yuan, rupees, and yen. The price sensitivity to currency-adjusted cost is particularly acute in Asia, where price elasticity in jewellery demand is well-documented.
This dual compression, higher opportunity cost through rising yields, combined with reduced international purchasing power through dollar strength, creates a compounding headwind. According to CNBC's market analysis, gold slipped to two-week lows as Fed rate hike bets buoyed the dollar, reinforcing how tightly these mechanisms are linked. Technical support levels alone cannot fully absorb this kind of macro pressure.
Gold's Probabilistic Price Architecture for H2 2026
The World Gold Council's mid-year analytical framework provides one of the more rigorous publicly available tools for understanding where gold's fair value sits across different macro outcomes. Rather than offering a single price target, the framework establishes a scenario-weighted probability distribution built around current macro assumptions.
| Scenario | Core Macro Conditions | Gold Price Target |
|---|---|---|
| Base Case | Moderate growth, cooling but elevated inflation, limited tightening | ~$4,100/oz (±5% range) |
| Upside Case | Economic deterioration, dovish Fed pivot, geopolitical escalation | ~$4,500/oz |
| Strong Upside Signal | Severe macro shock or sustained Fed reversal | ~$5,000/oz |
| Downside Case | Resilient growth, rising bond yields, subsiding volatility | $3,860/oz support floor |
With September hike probability now sitting at 63-64%, the current rate environment already strains the base case assumptions. The base case presupposes limited central bank tightening, a condition increasingly at odds with market pricing. This means gold is trading near its fair value ceiling under a scenario that is itself becoming less likely. In addition, the interplay of gold and bond dynamics further complicates the outlook for H2 2026.
Understanding the $3,860/oz Threshold and Why It Matters
The $3,860/oz level is frequently cited as technical support, but its significance runs deeper than chart patterns. It represents the intersection of three fundamental assumptions: rising U.S. 10-year Treasury yields reducing gold's relative appeal, sustained U.S. economic resilience suppressing safe-haven demand, and a compression of the geopolitical risk premium as speculative long positions face unwinding pressure.
Risk Alert: A sustained close below $3,860/oz would not simply represent a technical breakdown. Under the WGC's framework, it would trigger the downside scenario and potentially open a further 5-15% decline from that level, a range that would push gold toward $3,280-$3,660/oz territory.
How Individual Macro Variables Move Gold Prices
The WGC's quantitative sensitivity model offers a structured way to evaluate the marginal impact of specific data changes on gold pricing, a tool that is particularly valuable when assessing incoming economic releases:
| Macro Variable Change | Estimated Gold Price Impact |
|---|---|
| +100 points in GPR Geopolitical Risk Index (monthly) | +2.5% |
| +1% increase in CPI | +0.5% |
| -25bp decline in U.S. 10-year Treasury yield | +1.75% |
| +20-30 tonnes above 600t annual central bank buying baseline | +~1% |
These sensitivity estimates illustrate why the upcoming U.S. economic data calendar carries such outsized significance for gold positioning.
Institutional Forecasts: What the Gap Between Targets and Spot Prices Reveals
Major institutions have revised their gold outlooks in response to the shifting rate environment, but their targets still sit meaningfully above current spot prices, implying a required re-rating catalyst.
| Institution | 2026 Gold Price Forecast | Key Assumption Shift |
|---|---|---|
| HSBC | $4,560/oz (full-year average) | Revised down; hawkish Fed expectations and stronger USD |
| ING | $4,300/oz (Q3 2026 average) | Revised down from $4,850 |
| ING | $4,600/oz (Q4 2026 average) | Revised down from $5,500 |
| World Gold Council | $4,100/oz base case (H2 2026) | Moderate growth, limited tightening |
HSBC's $4,560/oz forecast represents approximately 10.8% upside from current spot levels near $4,113/oz. Critically, this forecast is itself a downward revision driven by hawkish Fed dynamics, meaning the bank's bullish case is conditional on catalysts that remain absent. Closing the gap between spot and the HSBC target requires at least one of the following:
- A dovish shift in Fed forward guidance driven by softening economic data
- New geopolitical escalation generating safe-haven demand strong enough to outweigh rate-hike headwinds
- Significant U.S. economic deterioration reducing September hike probability below 50%
None of these conditions are currently in play, which is precisely why gold remains range-bound rather than trending.
The Physical Gold Market: A Tale of Two Giants
China's Counter-Cyclical Reserve Accumulation
China's People's Bank of China has emerged as one of the most consequential single actors in global gold markets, and its June 2026 behaviour reinforced that status. The PBoC purchased 480,000 troy ounces (approximately 14.9 metric tonnes) of gold during the month, its largest single-month reserve addition in more than 2.5 years, extending an unbroken buying streak to 20 consecutive months and lifting total reserves to 75.44 million ounces.
Bernard Sin, regional director of Greater China at MKS PAMP, noted that this type of counter-cyclical accumulation is helping stabilise prices at the physical level. The assessment is supported by market data: Chinese domestic bullion prices traded between a $1/oz discount and a $5/oz premium to global spot during the period, a tight spread reflecting healthy physical market absorption rather than the kind of wide discounts that signal oversupply stress.
The WGC's sensitivity model contextualises this buying: every 20-30 tonnes of central bank purchasing above the 600-tonne long-term annual average adds approximately 1% to gold prices. Central bank gold buying of this magnitude, with China's June purchase of 14.9 metric tonnes, represents a meaningful contribution to that floor-building dynamic, even if it cannot single-handedly offset broader demand-side weakness.
India's Import Duty Shock and Its Market Consequences
India's decision to raise gold import duties from 6% to 15% represents one of the more structurally disruptive policy shifts in the global gold consumption landscape. The World Gold Council estimates the measure will reduce Indian jewellery, bar, and coin demand by 50-60 tonnes, approximately a 10% year-over-year decline in total Indian gold demand.
The market impact was immediate and severe. Indian bullion dealers shifted from offering premiums of up to $5/oz to offering discounts of up to $19/oz relative to global spot prices within a single week, a 24-point swing that illustrates the depth of demand contraction. Retail market dynamics shifted accordingly, with transactions increasingly involving old jewellery exchanges rather than net new purchases, compressing demand further without appearing in headline import data.
Net Physical Balance: Does China Offset India?
| Demand Factor | Volume Estimate | Market Direction |
|---|---|---|
| India demand reduction (import duty effect) | -50 to -60 tonnes | Bearish |
| China PBoC June purchase | +14.9 metric tonnes | Bullish |
| Estimated net physical impact | ~-35 to -45 tonnes (near term) | Net Bearish |
The arithmetic is instructive. China's buying, while historically significant and psychologically important as a price floor signal, does not fully absorb the scale of India's structural demand contraction in the near term. The net physical balance tilts bearish for the balance of 2026 unless Indian policy is reversed or additional central bank buyers emerge to supplement PBoC volumes.
The next major ASX story will hit our subscribers first
Mining Economics: How Gold's Price Scenarios Translate Into Operator Reality
AISC Margins Across the Cost Curve
Gold price scenarios are not abstract for mining companies. They translate directly into All-In Sustaining Cost margins, capital allocation decisions, and project viability thresholds. The interplay between gold and mining equities becomes particularly acute when the $3,860/oz downside scenario creates materially different operating environments depending on where an operator sits on the global cost curve:
- Low-cost producers (AISC below $1,200/oz): Retain substantial margins in all scenarios, providing insulation against macro headwinds
- Mid-cost producers (AISC $1,500-$2,000/oz): Margins compress but remain positive at $3,860/oz, though capital reinvestment slows
- High-cost producers (AISC above $2,800/oz): Approach breakeven territory if gold tests the downside support level, raising questions about project viability
A recovery toward $4,500/oz would fundamentally change this calculus. Expanded free cash flow at major producers typically triggers a cascade of secondary effects: renewed M&A appetite, higher development-stage project valuations, and increased feasibility study activity as previously marginal deposits cross economic thresholds.
The Data Calendar That Will Determine Gold's Direction Before September
The window between now and the September FOMC meeting is the most consequential data period for gold price direction in the second half of 2026. Investors should monitor the following catalysts in sequence:
- U.S. PCE (Personal Consumption Expenditures) data: The Federal Reserve's preferred inflation gauge. A softer-than-expected reading could reduce September hike probability below 50%, triggering a meaningful gold rally.
- ADP private payrolls: A leading indicator for broader employment conditions. Weakness signals labour market cooling and shifts the Fed calculus toward caution.
- Nonfarm payrolls (NFP): The single most market-moving employment data point for rate expectations. A miss relative to consensus could reprice September hike odds sharply lower.
- U.S. 10-year Treasury yield movements: A 25 basis point decline has historically added 1.75% to gold prices based on WGC sensitivity modelling.
- Gulf geopolitical developments: Further Iran-related escalation could either reinforce inflation fears (bearish via the rate channel) or trigger safe-haven demand surges (bullish via the GPR channel), creating a paradoxical outcome.
Scenario Map: Gold's Path to the September FOMC Decision
| Data Outcome | September Hike Probability Impact | Gold Price Direction |
|---|---|---|
| Hot PCE + Strong NFP | Rises above 70% | Pressure toward $3,860 support |
| Soft PCE + Weak NFP | Falls below 50% | Rally toward $4,300-$4,500 |
| Mixed signals | Stays in 55-65% range | Consolidation near $4,100 base case |
| New geopolitical escalation | Inflation fears reinforce hawkish Fed | Volatility spikes with paradoxical suppression |
Frequently Asked Questions: September Fed Hike Odds and Gold Prices
Why do rising Fed rate hike odds push gold prices lower?
Gold generates no interest income or dividends. When the probability of Federal Reserve rate increases rises, yield-bearing alternatives such as U.S. Treasuries become more attractive on a risk-adjusted basis, raising the opportunity cost of holding gold. Simultaneously, hawkish rate expectations strengthen the U.S. dollar, making dollar-denominated gold more expensive for international buyers and mechanically suppressing global demand.
What is the current September Fed rate hike probability?
As of early July 2026, financial markets are pricing approximately 63-64% probability of a Federal Reserve rate increase at the September FOMC meeting, up from roughly 54% one week prior. The shift was driven by inflation concerns tied to geopolitical developments in the Gulf region and hawkish signals embedded in the June FOMC meeting minutes. Consequently, September Fed hike odds pressure gold price expectations across all major institutional forecasts.
What is the key support level for gold if selling pressure intensifies?
The World Gold Council's mid-year analytical framework identifies $3,860/oz as the primary technical and fundamental support level for gold in H2 2026. A sustained break below this level would activate the downside scenario, potentially opening a further 5-15% decline from that point.
How much gold did China's central bank purchase in June 2026?
China's People's Bank of China purchased 480,000 troy ounces (approximately 14.9 metric tonnes) in June 2026, its largest single-month reserve addition in more than 2.5 years. This extended the PBoC's uninterrupted buying streak to 20 consecutive months, bringing total reserves to 75.44 million ounces. Crux Investor's analysis highlights how central bank buying surges of this scale are being outweighed by Fed hike bets in the current environment.
What is the effect of India's import duty increase on gold demand?
India raised its gold import duty from 6% to 15%, which the World Gold Council estimates will reduce jewellery, bar, and coin demand by 50-60 tonnes, approximately a 10% year-over-year decline. The impact was immediately visible in bullion dealer pricing, with Indian dealers shifting from offering premiums of up to $5/oz to discounts of up to $19/oz relative to global spot within days of the policy change.
Gold's $4,100 Range Is Waiting for a Policy Resolution
Gold's current consolidation is not equilibrium. It is suspension. Three competing structural forces are holding the metal in a compressed range, each powerful enough to break the current stalemate if it shifts materially:
- Monetary policy trajectory: September Fed hike odds above 63% represent the dominant near-term headwind. A dovish data surprise would be the single most powerful bullish catalyst available to gold markets before year-end. It is precisely why September Fed hike odds pressure gold price sentiment so decisively at this juncture.
- Physical demand rebalancing: China's structured accumulation provides a meaningful price floor, but India's import duty-driven demand destruction creates a net bearish physical balance until either policy normalises or alternative demand centres fill the gap.
- The geopolitical paradox: Iran-related conflict simultaneously supports safe-haven demand and reinforces the inflation narrative justifying Fed tightening, a self-cancelling dynamic that limits clean directional conviction from either side of the trade.
The $3,860-$4,500/oz range defines gold's risk envelope for the remainder of 2026. Within that corridor, macro data releases carry more pricing power than geopolitical headlines, and the September FOMC decision stands as the single most significant catalyst on the horizon. Until that uncertainty resolves, gold markets will continue rewarding patience over conviction.
Readers seeking additional context on gold market dynamics, monetary policy interactions, and mining sector analysis can explore institutional-grade commodity research at Crux Investor.
Want to Catch the Next Major ASX Mineral Discovery Before the Broader Market Does?
While gold's macro dynamics play out across the $3,860–$4,500/oz range, Discovery Alert's proprietary Discovery IQ model scans ASX announcements in real time, instantly translating complex mineral data into actionable opportunities across more than 30 commodities — explore historic discoveries and their exceptional returns, then begin your 14-day free trial to position yourself ahead of the market.