
July 22, 2026
The precious metals market stands at a pivotal juncture as we enter 2026, with gold price forecast models indicating unprecedented momentum driven by institutional conviction, monetary policy uncertainty, and structural changes in global reserve allocation. Traditional portfolio construction methodologies face disruption as conventional correlations break down, forcing institutional investors to reconsider long-held assumptions about asset class behaviour during periods of systemic stress. This transformation creates both opportunities and challenges for market participants seeking to navigate an increasingly complex investment landscape where monetary debasement concerns intersect with geopolitical uncertainty.
What Are the Leading Gold Price Predictions for 2026?
Institutional Forecasting Consensus
The precious metals market enters 2026 with extraordinary momentum, reflecting institutional conviction that extends far beyond traditional valuation metrics. Gold opened 2026 at $4,342 per ounce, representing continuation of the most volatile precious metals cycle in decades. The metal's 2025 gold price surge demonstrated unprecedented price discovery, with an annual range spanning from $2,625 to $4,584, creating a 74.7% percentage swing that exceeded all historical precedents across the past 25 years.
This extreme volatility pattern suggests fundamental shifts in market structure rather than temporary speculation. The second-largest annual range occurred during 2009's post-financial crisis period, reaching 53.2% ($802-$1,228), indicating that current market conditions parallel major systemic stress periods.
COMEX contract volume exceeded 50 million contracts during 2025, matching levels last seen during the COVID-19 market panic of 2020, demonstrating sustained institutional participation across both speculative and hedging strategies. Leading market analysts project continuation of this upward trajectory throughout 2026, with professional forecasts targeting a year-high of $5,546 per ounce.
This represents approximately 27.8% appreciation from January 2026 opening levels, suggesting institutional expectations for sustained precious metals momentum despite current overvaluation signals. Furthermore, the record high gold prices witnessed throughout 2025 provide a foundation for continued strength.
Price Target Breakdown by Quarter
Quarterly progression analysis reveals an acceleration pattern throughout 2026, with institutional forecasters applying sophisticated seasonal and cyclical modelling:
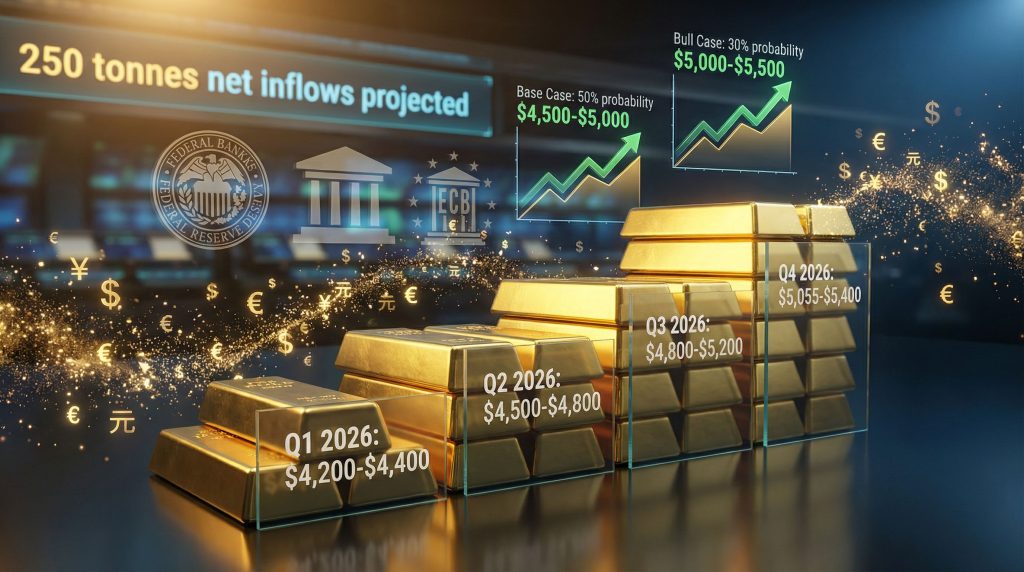
Q1 2026 Expectations:
- Target range: $4,200-$4,400
- Seasonal consolidation anticipated following year-end rallies
- Historical precedent suggests Q1 profit-taking dynamics
- 3.1% decline from January opening at range midpoint
Q2 2026 Projections:
- Target range: $4,500-$4,800
- Central bank policy meeting calendar supports upward momentum
- 7.1% appreciation from Q1 midpoint levels
- International monetary policy divergence creates volatility opportunities
Q3 2026 Estimates:
- Target range: $4,800-$5,200
- Geopolitical risk premium embedded in pricing models
- 7.5% appreciation from Q2 midpoint levels
- Traditional seasonal strength period for precious metals
Q4 2026 Targets:
- Target range: $5,055-$5,400
- Full-year momentum culmination anticipated
- 4.5% appreciation from Q3 midpoint levels
- Year-end institutional positioning effects
Probability-Weighted Scenarios
Professional risk management frameworks apply sophisticated scenario analysis to gold price forecast 2026, revealing institutional conviction patterns:
| Scenario | Probability | Price Range | Midpoint | Expected Value Contribution |
|---|---|---|---|---|
| Base Case | 50% | $4,500-$5,000 | $4,750 | $2,375 |
| Bull Case | 30% | $5,000-$5,500 | $5,250 | $1,575 |
| Bear Case | 20% | $3,500-$4,000 | $3,750 | $750 |
| Total Expected Value | 100% | $4,700 |
This probability weighting reveals 80% favourable scenario probability versus 20% bearish outcomes, indicating measured institutional conviction rather than speculative excess. The probability-weighted expected value of $4,700 represents 8.2% upside from January 2026 opening prices whilst maintaining 15.3% downside protection to bear case scenarios.
When big ASX news breaks, our subscribers know first
How Do Central Bank Policies Impact Gold Valuations in 2026?
Federal Reserve Monetary Stance
United States fiscal dynamics create structural support for precious metals through currency debasement mechanisms that transcend traditional monetary policy tools. Federal government spending reached $7.01 trillion during calendar 2025 against generated revenues of $5.23 trillion, producing a $1.78 trillion fiscal deficit representing 25.4% of total expenditures.
This fiscal imbalance creates profound implications for gold valuations through multiple transmission mechanisms. Consequently, institutional analysis reveals compelling patterns when examining spending velocity against hard asset production.
The federal government's average two-week spending approximately equals the full-year increase in global gold tonnage production when marked to current market values, demonstrating the scale of monetary expansion relative to hard asset supply constraints.
Equity Market Valuation Concerns:
The S&P 500 price-to-earnings ratio expanded from 46.1x to 55.1x during 2025, representing an 18.4 percentage point increase that occurred alongside 16.4% index appreciation. This indicates earnings growth failed to support valuation expansion, creating potential rotation pressure toward defensive assets including gold.
Liquidity Constraint Analysis:
Market capitalisation of the S&P 500 currently stands at 2.7 times the liquid money supply available to support equity valuations. This relationship suggests structural vulnerabilities that could trigger volatility and safe-haven demand during market stress periods.
Global Central Bank Coordination
International monetary policy coordination has fundamentally shifted toward precious metals accumulation, creating sustained demand pressure that exceeds traditional market-clearing mechanisms. Central bank quarterly gold purchases average 190 tonnes, representing a 100% increase compared to pre-2022 baseline levels of approximately 95 tonnes per quarter.
Official Sector Demand Impact:
- Annual central bank accumulation: ~760 tonnes (4 quarters × 190 tonnes)
- Historical baseline: ~380 tonnes annually
- Growth trajectory: Doubling of official sector demand
- Supply impact: 28-32% of global annual mining production
This accumulation rate indicates that official sector demand alone consumes nearly one-third of newly mined gold supply, creating structural supply-demand imbalances that support higher price trajectories independent of speculative demand. Moreover, the implications extend beyond simple supply dynamics.
De-dollarisation Documentation:
China's State Administration of Foreign Exchange documented gold holdings expansion from 1,948 tonnes (December 2022) to 2,171 tonnes, representing 223 tonnes of accumulation or 11.4% growth over 24 months. This measurable de-dollarisation demonstrates practical implementation of reserve diversification strategies beyond theoretical policy discussions.
Interest Rate Sensitivity Analysis
Historical analysis of gold's relationship to real interest rates provides quantitative frameworks for 2026 projections, though current market conditions suggest traditional correlations may be undergoing structural shifts:
Historical Correlation Patterns:
| Period | Real Rate Change | Gold Performance | Sensitivity Factor |
|---|---|---|---|
| 2008-2011 | -400 bps | +117.5% | 29.4% per 100 bps |
| 2019-2020 | -200 bps | +37.2% | 18.6% per 100 bps |
| Traditional Model | -100 bps | 8-12% | 8-12% per 100 bps |
Current market dynamics suggest sensitivity factors exceed traditional models during periods of systemic stress, monetary policy uncertainty, or geopolitical tension. The 2008-2011 period demonstrates that gold can appreciate 29.4% per 100 basis points of real rate decline during crisis periods, substantially exceeding normal correlation expectations.
Which Geopolitical Factors Drive Gold Demand in 2026?
Regional Conflict Assessment
Multiple geopolitical flashpoints create sustained uncertainty that supports precious metals demand through safe-haven mechanisms and portfolio insurance strategies. Current conflict zones demonstrate persistence rather than resolution, indicating ongoing support for defensive asset allocation:
Eastern European Theatre:
- Russia-Ukraine dynamics maintain elevated defence spending requirements
- NATO member states increasing military expenditure allocations
- Energy supply chain vulnerabilities create ongoing market volatility
- Sanctions enforcement requires alternative payment system development
Middle Eastern Instability:
- Israel-Palestine tensions affect regional energy transportation routes
- Iran nuclear programme negotiations create periodic market disruption
- Saudi Arabia-Iran regional competition influences oil market dynamics
- Red Sea shipping lane security concerns impact global trade flows
Asia-Pacific Strategic Competition:
- China-Taiwan tensions escalate periodically with military exercises
- South China Sea territorial disputes affect international shipping
- US-China technology competition drives supply chain diversification
- Regional military modernisation programmes increase defence spending
De-dollarisation Trends
Central bank reserve diversification represents a structural trend rather than cyclical phenomenon, creating sustained demand for alternative reserve assets. The increasing use of economic sanctions as geopolitical tools encourages nations to reduce dependence on traditional reserve currencies, benefiting gold's role as politically neutral monetary insurance.
Quantified De-dollarisation Evidence:
International Monetary Fund COFER (Currency Composition of Official Foreign Exchange Reserves) data indicates systematic reduction in USD reserve concentrations across emerging market central banks. This trend accelerated following 2022 geopolitical developments, with gold serving as the primary beneficiary of reserve diversification strategies.
Sanctions and Financial Weaponisation
The expanding use of financial sanctions as policy tools creates unintended consequences for global monetary architecture. Nations subject to sanctions or concerned about future sanctions increasingly view gold as insurance against financial system exclusion, driving structural demand beyond traditional investment motivations.
This dynamic transcends current conflict zones, as countries worldwide recognise the strategic importance of maintaining reserve assets beyond the reach of foreign government control. Gold's physical nature and historical neutrality position it as the preferred alternative during periods of financial weaponisation concerns.
What Role Does Institutional Investment Play in Gold's 2026 Outlook?
ETF Flow Projections
Exchange-traded fund activity serves as a sophisticated barometer for institutional sentiment, with 2026 projections indicating approximately 250 tonnes of net ETF inflows. This represents sustained institutional appetite despite elevated price levels, suggesting conviction extends beyond momentum-driven speculation.
ETF Demand Analysis:
- Projected 2026 inflows: 250 tonnes
- Historical average: 150-200 tonnes annually
- Growth driver: Portfolio diversification mandates
- Institutional participation: Pension funds, endowments, sovereign wealth funds
Pension Fund Allocation Strategies
Large institutional investors are systematically increasing precious metals allocations as portfolio diversifiers, driven by modern portfolio theory applications and risk parity frameworks. Target allocations of 5-10% in precious metals are becoming standard practice among sophisticated institutional portfolios seeking uncorrelated returns during periods of equity and bond market stress.
Institutional Allocation Drivers:
- Correlation breakdown between traditional asset classes
- Inflation protection requirements for defined benefit obligations
- Geopolitical risk hedging mandates from investment committees
- Alternative asset allocation expansion beyond real estate and private equity
Hedge Fund Positioning
Macro hedge funds utilise gold through multiple strategic frameworks, extending beyond traditional safe-haven applications to include currency debasement protection, inflation hedging, and volatility trading strategies. Net long positioning among managed money accounts suggests continued institutional support across diverse trading strategies.
Professional Trading Applications:
- Macro economic hedge strategies
- Currency basket diversification
- Volatility arbitrage opportunities
- Systematic trend-following systems
- Options market making activities
How Do Supply and Demand Fundamentals Affect 2026 Gold Prices?
Mining Production Constraints
Global gold production faces structural challenges that extend beyond cyclical market dynamics, creating supply-side support for higher prices independent of demand fluctuations. These constraints represent long-term industry trends rather than temporary disruptions:
Production Limitation Factors:
- Declining ore grades: Average gold concentrations at existing mines continue falling
- Extended development timelines: New project development requires 7-15 years from discovery
- Environmental regulations: Permitting processes become increasingly complex
- Capital allocation discipline: Mining companies prioritise shareholder returns over expansion
- Energy costs: Rising electricity and fuel costs impact extraction economics
- Water availability: Mining operations face increasing water scarcity in key regions
Quantified Production Data:
| Factor | Impact | Timeframe |
|---|---|---|
| Ore Grade Decline | 2-3% annually | Ongoing |
| New Mine Development | 10-15 years average | Project-specific |
| Environmental Compliance | 15-25% cost increase | Regulatory-dependent |
| Capital Discipline | 30-40% lower exploration spending | 2022-2026 period |
Central Bank Purchasing Patterns
Official sector demand demonstrates unprecedented consistency and scale, with quarterly purchases maintaining 190 tonnes average throughout 2025. This represents a fundamental shift from historical patterns where central banks served as net sellers during 1990-2010 periods.
Historical Context Analysis:
- 1999-2009: Net selling averaging 400 tonnes annually
- 2010-2021: Modest net buying averaging 450 tonnes annually
- 2022-2025: Accelerated buying averaging 760 tonnes annually
- 2026 projection: Sustained 750-800 tonnes based on current quarterly rates
This doubling of official sector demand creates structural supply-demand imbalances that traditional market mechanisms struggle to resolve through price discovery alone. Additionally, understanding these gold prospects & challenges helps contextualise current market dynamics.
Consumer Demand Evolution
Jewellery demand in key markets demonstrates price elasticity resilience despite substantial appreciation, indicating underlying demographic and cultural support for gold consumption. India and China represent approximately 60% of global jewellery demand, with both markets showing adaptation to higher price levels rather than demand destruction.
Technology Demand Growth:
Electronic miniaturisation trends continue expanding gold utilisation in:
- Semiconductor manufacturing applications
- Medical device component requirements
- Aerospace and defence system specifications
- Renewable energy infrastructure components
- Electric vehicle electrical system applications
What Economic Scenarios Could Impact Gold's Performance?
Inflation Trajectory Analysis
Gold's relationship with inflation expectations remains complex but generally supportive during 2026, though specific outcomes depend on inflation persistence, central bank responses, and economic growth trajectories. Persistent above-target inflation across major economies supports precious metals as purchasing power protection mechanisms.
Inflation Scenario Matrix:
| Scenario | Probability | Gold Impact | Price Range |
|---|---|---|---|
| Persistent High Inflation (4-6%) | 35% | Highly Positive | $5,200-$5,800 |
| Moderating Inflation (2-4%) | 45% | Moderately Positive | $4,500-$5,200 |
| Deflationary Pressure (<2%) | 20% | Mixed to Negative | $3,800-$4,500 |
Currency Debasement Concerns
Fiscal expansion across major economies raises fundamental questions about long-term currency stability, particularly when debt-to-GDP ratios continue expanding without corresponding economic growth acceleration. Gold benefits from concerns about fiat currency debasement, especially when monetary policy remains accommodative despite inflationary pressures.
Fiscal Sustainability Metrics:
- US debt-to-GDP ratio: Approaching 130% threshold
- European Union fiscal constraints: 3% deficit limits frequently exceeded
- Japanese monetary policy: Yield curve control creating currency volatility
- Chinese local government debt: Estimated 80-100% of GDP in aggregate
Economic Growth Scenarios
Different macroeconomic environments create varying implications for gold performance, with stagflationary conditions providing the most favourable backdrop for precious metals appreciation:
Growth Scenario Analysis:
Stagflation Environment (Low growth, High inflation):
- Highly favourable for gold prices
- Central banks face policy dilemmas between growth and inflation targets
- Traditional portfolio diversification becomes challenging
- Gold serves as both inflation hedge and growth insurance
Recession with Deflation:
- Mixed outcomes depending on policy responses
- Initial safe-haven demand followed by potential selling pressure
- Central bank accommodation typically supportive medium-term
- Dollar strength could create headwinds for gold pricing
Robust Economic Growth:
- Potentially negative for gold relative to risk assets
- Higher real interest rates reduce gold's relative attractiveness
- Strong dollar typically accompanies growth acceleration
- Technology and equity markets capture investment flows
The next major ASX story will hit our subscribers first
How Should Investors Position for Gold's 2026 Performance?
Portfolio Allocation Strategies
Financial advisors increasingly recommend 5-15% precious metals allocation depending on investor risk tolerance, age demographics, and economic outlook assumptions. This represents a substantial increase from traditional 2-5% allocations recommended during previous decades, reflecting recognition of gold's enhanced portfolio benefits during periods of monetary uncertainty.
Allocation Framework by Investor Type:
| Investor Profile | Recommended Allocation | Primary Rationale |
|---|---|---|
| Conservative Retirees | 10-15% | Capital preservation, inflation protection |
| Moderate Growth | 5-10% | Portfolio diversification, risk management |
| Aggressive Growth | 3-7% | Tail risk hedging, currency diversification |
| Institutional Endowments | 8-12% | Long-term purchasing power maintenance |
Dollar-Cost Averaging Implementation:
Systematic accumulation approaches help manage volatility whilst building positions over 12-18 month periods. Monthly purchase programmes reduce timing risk whilst providing disciplined exposure building during both price strength and weakness periods.
Physical vs. Financial Exposure
Investors can access gold exposure through multiple vehicles, each offering different risk-return profiles, liquidity characteristics, and operational considerations:
Physical Bullion Advantages:
- Maximum security against systemic financial risk
- No counterparty exposure or credit risk
- Direct ownership without third-party intermediation
- Historical precedent during extreme market stress
- Tangible asset with intrinsic value preservation
ETF Investment Benefits:
- Superior liquidity for active trading strategies
- Lower transaction costs for smaller position sizes
- Professional storage and insurance arrangements
- Tax-advantaged account compatibility
- Fractional share investment capability
Mining Equity Leverage:
- Amplified exposure to gold price movements
- Dividend income potential from profitable operations
- Operational improvement upside beyond metal prices
- Higher volatility suitable for growth-orientated investors
- Company-specific risk requiring individual analysis
Futures Contract Applications:
- Sophisticated hedging and arbitrage strategies
- Leverage capabilities for experienced traders
- Short-term tactical positioning opportunities
- Professional money management applications
- Margin requirements and rollover considerations
Risk Management Considerations
Gold positions require careful risk management protocols given inherent volatility potential and correlation dynamics with other portfolio holdings. Professional portfolio construction emphasises position sizing, correlation analysis, and systematic rebalancing procedures.
Risk Control Framework:
- Position sizing limits: Maximum 15% portfolio allocation prevents concentration risk
- Stop-loss protocols: Technical levels for downside protection (typically 15-20% below entry)
- Correlation monitoring: Regular analysis of gold's relationship with equities and bonds
- Rebalancing disciplines: Quarterly or semi-annual portfolio rebalancing procedures
- Tax considerations: Understanding of tax implications for different gold investment vehicles
What Are the Key Risks to Bullish Gold Forecasts?
Dollar Strength Scenarios
A resurgent US dollar poses the primary downside risk to gold appreciation forecasts, given the inverse correlation between dollar strength and precious metals pricing. Economic outperformance, monetary policy tightening, or improved geopolitical stability could strengthen the dollar substantially and create sustained pressure on gold prices.
Dollar Strength Catalysts:
- Economic outperformance: US GDP growth exceeding international peers
- Interest rate differentials: Federal Reserve maintaining higher rates than ECB/BOJ
- Geopolitical stability: Resolution of major international conflicts
- Fiscal discipline: Unexpected improvement in US budget deficit trajectory
- Energy independence: Reduced dependence on commodity imports
Policy Normalisation Risks
Faster-than-expected monetary policy normalisation could substantially increase opportunity costs for holding non-yielding assets like gold. Central bank communication shifts toward hawkish stances or economic data surprises supporting policy tightening represent significant risks to bullish precious metals forecasts.
Policy Risk Scenarios:
- Federal Reserve accelerating interest rate increases beyond market expectations
- European Central Bank maintaining restrictive policies longer than anticipated
- Central bank balance sheet reduction proceeding more aggressively
- Inflation declining more rapidly than projected, reducing accommodation rationale
Technical Correction Potential
Gold's substantial 2025 appreciation (+65%) creates vulnerability to technical corrections and profit-taking dynamics. Traditional technical analysis suggests markets rarely advance in straight lines, with periodic consolidations representing normal price discovery processes.
Correction Risk Factors:
- Overvaluation signals: Current pricing exceeds Fair Value by approximately 11.5%
- Momentum exhaustion: Parabolic price advances historically face reversion
- Profit-taking pressure: Long-term holders may monetise substantial gains
- Seasonal patterns: Q1 historically experiences precious metals weakness
- Speculative excess: Excessive bullish sentiment creates contrarian risks
Technical Support Levels:
- Initial support: $4,000-$4,100 zone (previous resistance becoming support)
- Major support: $3,800-$3,900 (Fair Value proximity)
- Critical support: $3,500-$3,600 (bear case scenario threshold)
How Do Technical Indicators Support 2026 Gold Projections?
Chart Pattern Analysis
Long-term precious metals charts display constructive technical patterns supporting higher price projections, with multi-year consolidation phases historically preceding significant breakout movements. Current formations suggest upward resolution potential, though short-term overbought conditions require monitoring.
Pattern Recognition Analysis:
- Multi-year ascending triangle: Higher lows with resistance at previous highs
- Breakout confirmation: Volume expansion supporting price advancement
- Trend line support: Systematic higher low formation across major corrections
- Moving average alignment: All major moving averages (50, 100, 200-day) trending upward
Support and Resistance Levels
Professional technical analysis identifies key price levels for 2026 monitoring and position management decisions:
Critical Technical Levels:
| Level Type | Price Range | Significance |
|---|---|---|
| Primary Support | $4,000-$4,100 | Previous resistance zone conversion |
| Secondary Support | $3,800-$3,900 | Fair Value proximity and 200-day MA |
| Immediate Resistance | $4,400-$4,500 | January 2026 highs and round numbers |
| Major Resistance | $5,000 | Psychological milestone and target level |
| Breakout Targets | $5,400-$5,500 | Measured move projections from patterns |
Momentum Indicators
Relative strength indicators and momentum oscillators suggest gold maintains positive trend characteristics despite short-term overbought warnings. Professional trend-following systems remain constructively positioned, though tactical timing requires attention to momentum divergences.
Momentum Analysis Summary:
- RSI (Relative Strength Index): Above 50 indicating upward momentum bias
- MACD (Moving Average Convergence Divergence): Positive crossover maintaining
- Stochastic Oscillators: Overbought but not showing negative divergence
- Volume Indicators: Expansion supporting price advancement authenticity
What Does Gold's 2026 Performance Mean for Broader Markets?
Correlation Analysis
Gold's performance provides sophisticated insights into broader market sentiment and institutional risk appetite dynamics. Strong precious metals performance often accompanies equity market uncertainty, bond market volatility, and currency instability, creating valuable information for portfolio allocation decisions.
Cross-Asset Correlation Patterns:
- Gold vs. S&P 500: Typically negative correlation during stress periods
- Gold vs. US Dollar: Strong inverse relationship historically
- Gold vs. Treasury Bonds: Variable correlation depending on inflation environment
- Gold vs. Emerging Markets: Positive correlation during risk-off periods
Inflation Expectations
Gold price movements serve as real-time inflation expectations indicators, often providing earlier signals than traditional economic data releases. Sustained precious metals strength suggests markets anticipate persistent price pressures across the global economy, regardless of official central bank communications.
Inflation Signal Analysis:
Current gold strength indicates market expectations for:
- Sustained inflation above central bank targets
- Currency debasement concerns across major economies
- Potential policy errors in inflation management
- Structural inflationary pressures beyond temporary factors
Currency Market Implications
Gold's dollar-denominated price reflects complex international currency dynamics and relative economic performance across major trading blocs. Strong gold performance often accompanies dollar weakness and emerging market currency strength, providing insights into global capital flow patterns.
Currency Market Signals:
- Dollar depreciation expectations: Gold strength suggests dollar weakness anticipation
- Emerging market resilience: Strong gold typically supports EM currency stability
- European monetary stability: Gold performance reflects ECB policy effectiveness
- Asian currency dynamics: Regional central bank gold purchases influence local currencies
The confluence of institutional demand, supply constraints, geopolitical uncertainty, and monetary policy accommodation creates a uniquely supportive environment for precious metals appreciation throughout 2026. Whilst traditional valuation metrics suggest caution, the structural transformation of global monetary architecture, persistent fiscal imbalances, and evolving geopolitical landscape indicate that conventional analytical frameworks may underestimate gold's strategic importance in modern portfolio construction. The comprehensive gold stock market guide demonstrates these complex relationships, whilst professional commodities analysis and institutional gold outlooks support the bullish gold price forecast 2026.
Disclaimer: This analysis contains forward-looking projections and scenario modelling that involves inherent uncertainty and risk. Gold price forecasts represent professional opinions based on current market conditions and historical analysis, but actual results may vary significantly from predictions. Investors should conduct independent research and consult qualified financial advisors before making investment decisions. Past performance does not guarantee future results, and precious metals investments carry volatility risk including potential for substantial losses.
Searching for Your Next Gold Investment Opportunity?
Discovery Alert's proprietary Discovery IQ model delivers real-time alerts on significant ASX mineral discoveries, instantly empowering subscribers to identify actionable opportunities ahead of the broader market. Understand why historic discoveries can generate substantial returns by visiting Discovery Alert's dedicated discoveries page, showcasing exceptional outcomes from major mineral finds.