June 5, 2026
The Structural Forces Rewriting Gold's Long-Term Demand Architecture
Commodity bull markets rarely end where most investors expect them to. They tend to persist far longer than consensus forecasts suggest, draw in capital from an ever-widening pool of participants, and produce corrections severe enough to shake out short-term holders before resuming their upward trajectory. The mechanics that drive sustained multi-year appreciation in precious metals are rarely visible in day-to-day price action.
They operate at the level of institutional policy, sovereign reserve strategy, and macroeconomic architecture — forces that build slowly, then compound.
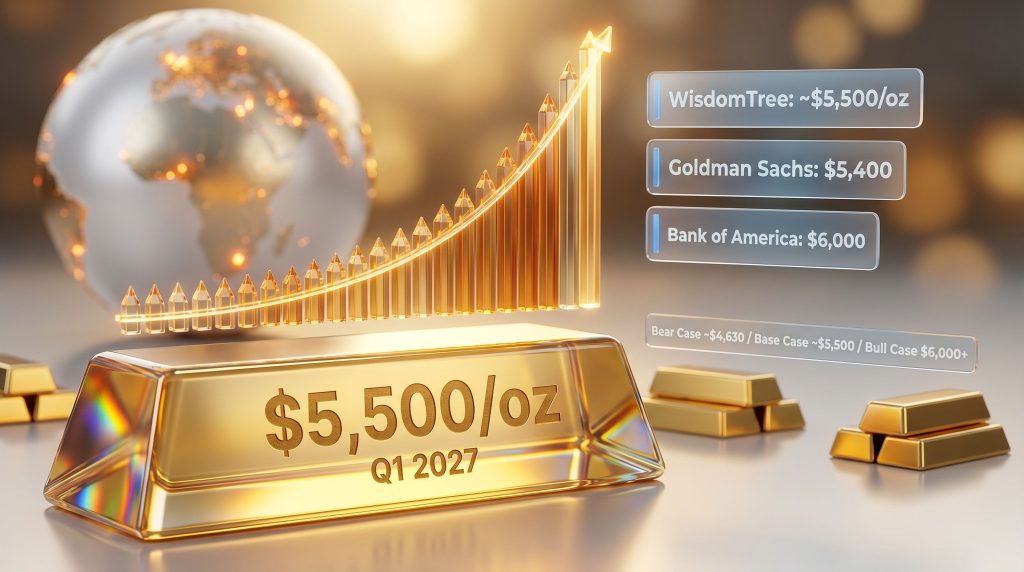
That structural dynamic is precisely what underpins the gold price forecast to $5,500 by Q1 2027 that has emerged from a growing convergence of institutional analysis. Understanding why that target is credible requires stepping back from short-term price noise and examining the demand composition, policy risk landscape, and monetary system transitions that are reshaping gold's role in global finance.
When big ASX news breaks, our subscribers know first
Why Institutional Demand Has Replaced Retail Sentiment as the Dominant Price Driver
The post-2022 period represents a meaningful discontinuity in how gold prices are set at the margin. For much of the preceding decade, retail participation cycles and ETF inflows served as the primary swing variables in gold demand. Price-sensitive buyers would enter during perceived undervaluation, take profits near cycle highs, and rotate out when real yields improved or equities outperformed.
That dynamic has been displaced. The dominant marginal buyer is now sovereign, institutional, and fundamentally price-insensitive in a way retail investors never are. Central bank gold demand operates as a policy instrument to fulfil reserve diversification mandates. Central banks do not liquidate holdings when spot prices correct, nor do they react to quarterly earnings misses or short-term technical breakdowns.
That behavioural difference creates a structurally different demand floor than anything observable in prior gold bull cycles.
The statistical confirmation of this shift is substantial. Central banks globally purchased 863 tonnes of gold in 2025 according to the World Gold Council's Gold Demand Trends: Full Year 2025 report. That figure represents the fourth-largest annual sovereign acquisition total on record and sits more than 80% above the 2010–2021 annual average of 473 tonnes. The breadth of participation reinforces the structural reading: more than 22 sovereign institutions were active buyers throughout the year, spanning multiple geographies and policy mandates.
The De-Dollarisation Mandate Driving Reserve Rebalancing
Several BRICS+ member nations have been systematically reducing their exposure to U.S. Treasury holdings as a primary reserve asset. This is not a short-cycle tactical adjustment. It reflects a multi-year policy reorientation driven by geopolitical risk management, specifically the vulnerability that dollar-denominated reserve assets create when bilateral tensions escalate.
A milestone in this transition occurred in late 2025: gold surpassed U.S. Treasuries to become the world's largest reserve asset by value for the first time in the modern financial era. This is a generational inflection point in sovereign portfolio construction, and it fundamentally reshapes the understanding of gold in the global monetary system.
China's People's Bank of China officially disclosed 27 tonnes of additions in 2025, a figure most independent analysts consider a material understatement of actual accumulation. Poland led all sovereign buyers with 102 tonnes, while Brazil returned to the market as a meaningful buyer for the first time since 2021. These are not peripheral actors making opportunistic trades. They represent credible signals of distributed, institutionally mandated demand.
What Is the $5,500 Gold Price Forecast Based On? The Multi-Analyst Consensus Explained
The gold price forecast to $5,500 by Q1 2027 did not originate from a single outlier projection. It emerges from a convergence of institutional analysis across multiple major research platforms, each employing different methodological frameworks but arriving at broadly consistent price trajectories. Furthermore, the geopolitical and central bank drivers behind this momentum have been building for several years.
Mapping the Institutional Forecast Landscape
| Institution | Price Target | Timeline | Primary Driver |
|---|---|---|---|
| WisdomTree (Nitesh Shah) | ~$5,500/oz | Q1 2027 | Policy error risk, investment demand |
| J.P. Morgan Global Research | $5,055/oz avg rising to $5,400/oz | Q4 2026 to Q4 2027 | Combined CB and investor demand ~585t/quarter |
| Goldman Sachs | $5,400/oz | Year-end 2026 and 2027 | CB accumulation and normalising ETF inflows |
| Bank of America | $6,000/oz | 12-month target | Structural reserve diversification |
Nitesh Shah, head of commodities and macroeconomic research at WisdomTree, positions the $5,500 figure as the conservative lower boundary of his projected range, not a peak estimate. His modelling framework incorporates a bear-case floor of approximately $4,630/oz, constructed under assumptions of dollar strengthening, rising real yields, and inflation returning to 2% target. Even under those pessimistic conditions, Shah's analysis suggests the downside is meaningfully contained relative to the upside potential, according to WisdomTree's Gold Outlook to Q2 2026 commentary.
From approximately $4,867/oz in mid-May 2026, reaching $5,500 requires a gain of roughly 12–15%. That is a materially smaller appreciation than the approximately 65% gain gold delivered through 2025 alone, which represented its strongest annual performance in over four decades, according to data sourced from the World Gold Council and Trading Economics.
The Demand Architecture Underpinning J.P. Morgan's Trajectory
J.P. Morgan's Global Research division has constructed its price trajectory around combined central bank and investor demand averaging approximately 585 tonnes per quarter. Goldman Sachs has separately quantified the scale of potential institutional capital reallocation: a rotation of just 1% of the approximately $57 trillion in private U.S. Treasury holdings into gold would inject roughly $570 billion into a comparatively small market. That is not a theoretical edge case. It is a scenario with real policy-level motivations behind it.
The 2025 gold bull market itself provides important technical context. The rally produced 53 separate all-time highs across the calendar year. Corrections of 13–15% magnitude occurred multiple times within the broader uptrend before the market resumed its advance. The current pullback from January 2026's peak of $5,589.38 to the mid-May trading range fits precisely within this established pattern.
The 2025 bull run embedded repeated 13–15% corrections within its structure. Each one felt conclusive in the moment. None of them were. The underlying demand architecture that produced 53 all-time highs has not materially changed.
What Is Central Bank Policy Error Risk, and Why Does It Function as a Gold Catalyst?
Policy error risk refers to the probability that major central banks make a consequential monetary misjudgement during a period of heightened macro complexity. In the current environment, that risk operates in two distinct directions, and critically, both are bullish for gold.
Error Type 1: Overtightening. If central banks raise rates aggressively enough to successfully suppress inflation, the collateral damage is likely a meaningful growth contraction. Recession triggers risk-off capital rotation, undermines confidence in equities and credit, and increases gold's appeal as a non-correlated store of value.
Error Type 2: Premature Easing. If central banks cut rates before inflation is durably contained, they risk reigniting price pressures. That outcome reduces real yields, weakens the currency, and strengthens gold's role as an inflation hedge.
Nitesh Shah has characterised the bind facing monetary authorities as one where adjusting interest rates in either direction carries significant collateral risk regardless of which path is chosen, as noted in commentary published by Invezz. That constraint effectively narrows the policy corridor to a degree unusual in modern central banking history.
Three Macro Scenarios and Their Projected Gold Outcomes
Scenario A: Soft Landing (Bearish for Gold)
- Inflation returns durably to 2% without triggering recession
- Real yields rise as nominal rates hold and inflation expectations decline
- Dollar strengthens on relative economic outperformance
- Two primary gold tailwinds simultaneously removed
- Projected gold floor under this scenario: approximately $4,630/oz (WisdomTree bear case)
- Assessment: requires near-perfect policy calibration in a historically demanding environment
Scenario B: Stagflation / Policy Paralysis (Base Case)
- Central banks unable to tighten sufficiently without damaging growth
- Persistent above-target inflation alongside decelerating economic activity
- Gold benefits from inflation hedging and safe-haven demand simultaneously
- Real yields remain near zero or negative, eliminating opportunity cost of holding gold
- Supports the $5,500 target trajectory by Q1 2027
Scenario C: Hard Landing / Recession (Strongly Bullish)
- Overtightening triggers meaningful economic contraction
- Risk-off capital rotation accelerates into gold
- Dollar credibility concerns intensify sovereign reserve diversification momentum
- Bank of America's $6,000 target enters realistic scope
The stagflation scenario deserves particular attention because it combines two conditions that independently support gold into a single compounding environment. Historical precedent from the 1970s demonstrated that stagflation — where price pressures persist alongside economic stagnation — produced the most sustained gold appreciation in the modern era. Current macroeconomic conditions in several major economies exhibit meaningful parallels.
How Sovereign Gold Buying Reshapes the Market's Structural Demand Floor
The analytical significance of sovereign purchasing extends well beyond the raw tonnage figures. The key distinction is behavioural. Unlike institutional investors or retail participants who acquire gold as a return-seeking investment, sovereign central banks purchase gold as a policy instrument. They operate under reserve management mandates that are reviewed across multi-year planning horizons, not quarterly performance cycles.
Sovereign buyers do not liquidate gold holdings when spot prices pull back. This price-insensitive, directionally consistent demand creates a structural demand floor that was largely absent from gold markets prior to 2022, and it fundamentally alters how gold markets behave during corrections.
The evidence for sustained institutional commitment is visible in the purchasing breadth, not just the volume. The 2025 total of 863 tonnes spanning more than 22 institutions demonstrates that reserve diversification toward gold is a distributed, coordinated policy direction rather than a single large buyer's tactical decision that could reverse course. In addition, tracking central bank gold reserves reveals just how entrenched this diversification mandate has become.
Why the China Disclosure Gap Matters
China's official disclosure of 27 tonnes of PBOC gold additions in 2025 sits well below what most independent analysts assess as the actual accumulation figure. China has a documented history of updating reserve figures in irregular intervals and at levels that lag underlying acquisition activity. The gap between disclosed and estimated actual purchases means the structural demand floor may be materially more robust than official figures suggest.
What Role Does Dollar Weakness Play in the Path to $5,500?
Gold's global denomination in U.S. dollars creates a mechanical relationship between currency moves and precious metals demand. Dollar depreciation reduces the effective price of gold for all non-dollar buyers, expanding the accessible international buyer pool and reinforcing price support from multiple geographic directions simultaneously.
The DXY has been under sustained downward pressure as foreign governments reassess the composition of their reserve portfolios. This currency weakness reflects the same underlying concerns that are driving sovereign gold accumulation: questions about long-term U.S. fiscal sustainability, the trajectory of debt-to-GDP ratios, and the geopolitical use of dollar-denominated financial infrastructure as a policy lever.
Foreign central bank demand for U.S. government debt has structurally declined, shifting the marginal buyer composition toward domestic institutions. That dynamic simultaneously reinforces gold's appeal as a reserve asset carrying no sovereign counterparty obligation and applies ongoing pressure to dollar valuations.
The next major ASX story will hit our subscribers first
Risk Assessment: What Could Prevent the $5,500 Target From Being Reached?
A credible bull case requires an equally rigorous examination of the scenarios that could invalidate it. The bearish risks for the gold price forecast to $5,500 by Q1 2027 are real and worth naming with precision. However, understanding these risks also clarifies the broader gold price forecast drivers that give institutional analysts confidence in the target.
Key Risk Factors
- Credible soft landing: Inflation returning durably to 2% target without triggering recession would lift real yields and strengthen the dollar, removing two core gold tailwinds simultaneously
- Geopolitical de-escalation: A meaningful reduction in regional tensions could compress safe-haven premium components in the near term
- Sovereign buying deceleration: A publicly announced reduction in central bank gold purchases from a major institution would create a negative sentiment catalyst
- Dollar recovery: A sustained DXY rally driven by relative U.S. economic outperformance would suppress gold's international price appeal
- ETF outflows: Institutional ETF liquidation at scale could temporarily overwhelm the price floor created by sovereign buying
The structural counterpoint to each of these risks is that the bear-case floor remains meaningfully contained. Even under WisdomTree's most pessimistic assumptions, gold maintains approximately $4,630/oz as a modelled support level. The asymmetry between limited modelled downside and a 12–15% path to $5,500 defines the risk/reward structure of the current entry environment.
| Scenario | Projected Gold Price | Key Assumptions |
|---|---|---|
| Bear Case (Soft Landing) | ~$4,630/oz | Inflation to 2%, dollar strengthens, yields rise |
| Base Case (Policy Uncertainty Persists) | ~$5,500/oz | Stagflation risk elevated, CB buying sustained |
| Bull Case (Hard Landing / Recession) | $6,000/oz+ | Risk-off rotation, dollar credibility concerns |
How Investors Can Think About Portfolio Positioning
The current gold price level, trading roughly 12–15% below the $5,500 target and approximately 18% below January 2026's all-time high of $5,589.38, represents a position within a structural bull market that has historically been characterised as a re-entry zone rather than a warning signal.
The 2025 gold market produced 53 all-time highs. Each of the multiple 13–15% corrections that occurred within that trend felt conclusive at the time. None invalidated the underlying demand architecture. The structural drivers — including policy uncertainty, monetary debasement pressure, and sovereign reserve diversification — remain intact.
Physical Gold vs. ETF Exposure: A Framework for Thinking About Allocation
Physical Bullion (Bars and Coins)
- Carries zero counterparty risk by design
- No issuer, no default exposure, no institutional dependency
- Represents the foundational layer of a precious metals allocation for long-term wealth preservation objectives
- Appropriate for investors whose primary objective is systemic risk insurance
Gold ETFs
- U.S.-listed gold ETFs added 437 tonnes in 2025, pushing total assets under management to a record $280 billion, according to the World Gold Council's Gold Demand Trends: Full Year 2025 report
- Provide efficient, liquid market exposure without storage logistics
- Suitable for tactical allocation adjustments and investors prioritising accessibility
- Subject to institutional counterparty relationships absent from physical ownership
The ETF inflow data is particularly significant from a structural perspective. The record $280 billion in AUM does not represent a single concentrated position but a diversified institutional commitment across multiple fund vehicles. That breadth of participation confirms the investment demand component of J.P. Morgan's combined quarterly demand model of 585 tonnes is not a theoretical construct.
Frequently Asked Questions: Gold Price Forecast to $5,500 by Q1 2027
What is the primary catalyst behind the $5,500 gold price forecast?
Three converging forces underpin the forecast: the elevated probability of central bank monetary policy misjudgement in a stagflationary environment, sovereign gold purchases sustained well above historical averages, and persistent U.S. dollar weakness driven by reserve diversification and fiscal trajectory concerns. WisdomTree's research positions the policy error risk as the most underpriced bullish catalyst in current gold valuations.
How much would gold need to appreciate from current levels to reach $5,500?
From approximately $4,867/oz, reaching $5,500 requires a gain of roughly 12–15%. That is a materially smaller move than the approximately 65% appreciation gold delivered through 2025 alone, according to World Gold Council and Trading Economics data.
How many central banks are actively buying gold, and why does that breadth matter?
More than 22 sovereign institutions purchased gold in 2025. The distribution across different geographies and institutional mandates is analytically significant because it confirms demand is structurally motivated and diversified rather than concentrated in one or two large buyers whose reversal would materially alter market dynamics.
What happens to the forecast if the U.S. achieves a soft landing?
Under WisdomTree's bear-case modelling, even a scenario incorporating inflation returning to 2%, a strengthening dollar, and rising bond yields still supports gold at approximately $4,630/oz. The modelled downside is meaningfully contained relative to the upside potential.
How does ETF demand fit into the $5,500 forecast trajectory?
ETF inflows added 437 tonnes in 2025, bringing total AUM to a record $280 billion. J.P. Morgan's price model incorporates combined central bank and investor demand of approximately 585 tonnes per quarter as the basis for its $5,055 to $5,400 price trajectory. ETF participation broadens the demand base beyond sovereign buyers and provides a liquid, responsive component to the overall demand structure.
The Multi-Year Macro Architecture That Extends Beyond Q1 2027
The structural thesis supporting the gold price forecast to $5,500 by Q1 2027 does not terminate at that target. The forces driving gold appreciation are not short-cycle phenomena that resolve within a single forecasting horizon. Consequently, three structural dynamics operate across a multi-decade timeframe:
- Monetary debasement: The long-term trajectory of global money supply expansion has not reversed. Gold's role as a debasement hedge is structurally supported by the fiscal and monetary policy architecture of major economies
- Reserve system reconfiguration: The transition away from dollar-centric reserve construction is a generational shift, not a cyclical adjustment. Gold's ascent to the position of the world's largest reserve asset by value marks an early stage of that transition, not its conclusion
- Geopolitical fragmentation: The increasing use of dollar-denominated financial infrastructure as a geopolitical instrument continues to accelerate sovereign demand for assets outside that framework
Bank of America's $6,000 12-month target and the more aggressive scenarios modelled by other institutions suggest that sophisticated institutional analysis does not treat $5,500 as a terminal value. It positions it as a waypoint within a larger structural transition.
Each successive all-time high established in 2025's 53-high bull run created new technical support levels and drew additional institutional participation into the market. The compounding effect of broadening participation, sustained sovereign accumulation, and an unresolved macro policy dilemma has not weakened since January 2026's peak. It has deepened.
For further institutional-level context on the demand dynamics discussed above, the World Gold Council's Gold Demand Trends: Full Year 2025 report and WisdomTree's Gold Outlook to Q2 2026 commentary provide detailed quantitative frameworks for sovereign purchasing trends and price modelling methodologies.
This article is intended for informational and educational purposes only and does not constitute financial or investment advice. All forecasts referenced represent third-party analyst projections and are subject to change without notice. Past performance is not indicative of future results. Readers should seek guidance from a qualified financial adviser before making any investment decisions.
Want to Capitalise on the Next Major ASX Mineral Discovery Before the Broader Market Notices?
While gold's structural bull market continues to reshape global portfolios, Discovery Alert's proprietary Discovery IQ model delivers real-time alerts on significant ASX mineral discoveries — instantly translating complex data across 30+ commodities into actionable insights for both short-term traders and long-term investors. Explore how historic discoveries have generated substantial returns on Discovery Alert's dedicated discoveries page, and begin your 14-day free trial today to position yourself ahead of the market.