June 16, 2026
When the Charts Align With the Banks: A Rare Moment in Precious Metals History
Rarely do technical analysis frameworks and institutional bank research point in the same direction simultaneously. In most market cycles, chartists and Wall Street strategists diverge sharply on both price targets and timing. Yet in mid-2025, something unusual has emerged: a broad convergence between classical pattern analysis and major bank forecasting, both pointing toward a gold price forecast to 6000 and silver to 100 as credible near-term targets rather than speculative outliers.
Understanding why this alignment has occurred requires examining the architecture of the current precious metals cycle from multiple angles, including the macro forces reshaping reserve demand, the technical frameworks that define price structure, and the volatility dynamics that distinguish gold from silver as investment vehicles.
When big ASX news breaks, our subscribers know first
The Macro Architecture Driving Precious Metals Higher
The current bull market in gold and silver is not a simple response to any single variable. Instead, it represents a convergence of structural forces that are reinforcing each other simultaneously.
The dollar index (DXY) declining from levels above 100 represents one of the more significant currency dynamics at play. As veteran technical analyst Gary Wagner, executive producer of The Gold Forecast and a practitioner with over 35 years of chart analysis experience, explained in a recent interview with The Daniela Cambone Show, the important distinction is not day-to-day dollar movement but rather the dollar's relationship to the basket of currencies that compose the index.
A one percent move in the dollar index represents a tremendously large move by currency standards, because currencies simply do not exhibit the same percentage volatility as commodities. A two to three percent decline in the dollar index over approximately one month, as observed in 2025, carries outsized implications for gold pricing given this structural difference.
The rationale behind central bank gold buying is perhaps best understood through a direct question: why hold an excessive amount of fiat currency, even the world's reserve currency, when gold has maintained recognised intrinsic value not for two hundred years but for thousands of years? Wagner articulates this logic not as a fringe position but as the reasoning increasingly adopted by sovereign institutions that are now net buyers of gold rather than sellers. This represents a fundamental reversal from the 1990s and 2000s era when central banks were net sellers of gold reserves.
Several reinforcing forces characterise the current environment:
- Structural dollar weakness driven by fiscal expansion and monetary policy constraints
- Central bank diversification away from fiat reserve concentration
- Real interest rate compression reducing the opportunity cost of holding non-yielding assets
- Mounting fiscal obligations across G7 economies amplifying safe-haven allocation
- Expanding institutional participation through ETF inflows and hedge fund positioning
From $3,000 to $5,600: The Scale of Gold's 2025 Move
Gold futures surpassed the $5,600 per ounce level in early 2025, representing approximately an 87% gain from the $3,000 level observed roughly twelve months prior. For context, Wagner notes this dwarfs the prior cycle's defining moment when gold broke above $1,000 and ultimately reached approximately $1,900 during the 2011 to 2012 period.
The pace of price discovery during the ascent was unprecedented in Wagner's assessment. New all-time highs were being set almost weekly and monthly, with no clear technical ceiling establishing itself during the rally. This characteristic, while impressive in terms of directional momentum, also created a forecasting challenge: without a confirmed top and a confirmed bottom in place, technical frameworks like Elliott Wave analysis become significantly less reliable as predictive tools.
"For the longest time, we would trade to a new record high, a new record high. It got to be almost a broken record because as gold increased in value really from about $3,000 up, it was breaking records almost weekly, monthly, and there was no end in sight." – Gary Wagner, The Daniela Cambone Show
Volume patterns during the rally showed strong institutional participation, though Wagner notes this has begun to moderate as markets move into summer months, a seasonal pattern consistent with historical commodity trading cycles. The critical development from a technical perspective is that gold now has both reference points in place: a confirmed top above $5,600 and a confirmed corrective low just above $4,100.
What Is the Gold Price Forecast for 2026? The $6,000 Target Explained
Wall Street's Consensus: Major Bank Price Targets
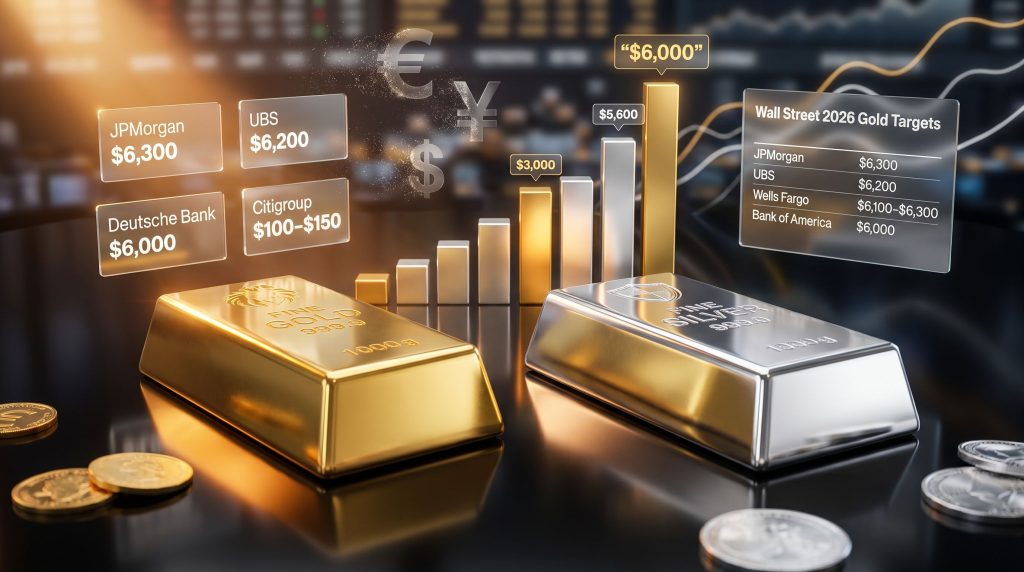
The clustering of institutional forecasts around the $6,000 level is striking. Multiple major Wall Street institutions have published gold price forecasts for 2026 that centre on or exceed this threshold.
| Institution | 2026 Gold Price Target | Notable Detail |
|---|---|---|
| JPMorgan | $6,300 | Year-end 2026 |
| UBS | $6,200 | Mid-2026; $7,200 extreme upside scenario |
| Wells Fargo | $6,100 to $6,300 | Range forecast |
| Bank of America | $6,000 | Spring 2026 |
| Deutsche Bank | $6,000 | Base case |
| Societe Generale | $6,000 | Characterised as potentially conservative |
| Goldman Sachs | $5,400 | Most conservative major bank forecast |
Six of the seven institutions in this analysis align at or above the $6,000 level. UBS maintains the highest base case at $6,200 alongside an extreme upside scenario of $7,200 linked to geopolitical escalation. Goldman Sachs remains the outlier at $5,400, though this still represents meaningful appreciation from current levels. For further context on these projections, JPMorgan's commodity research provides detailed institutional analysis supporting these targets.
Disclaimer: Institutional price forecasts represent research estimates and are subject to revision. They should not be interpreted as investment advice or guarantees of future performance.
Technical Analysis: Elliott Wave and Classical Pattern Signals
Wagner's $6,000 year-end target is derived from Elliott Wave pattern analysis rather than fundamental valuation models. Understanding how this framework applies to gold's current structure provides important context.
Elliott Wave theory, developed by Ralph Nelson Elliott in the 1930s, describes market price movements as a series of eight waves. The first five waves constitute the motive phase: waves 1, 3, and 5 move in the direction of the primary trend (in gold's case, upward), while waves 2 and 4 represent corrective pullbacks. Once the five-wave motive phase completes, a three-wave corrective pattern follows, labeled A, B, and C.
Applied to gold's current structure:
- Waves 1 through 5 completed during the advance from approximately $3,000 to above $5,600
- The A-wave correction brought gold down from the $5,600+ peak to just above $4,100, representing a 61%+ retracement from intraday high to intraday low
- The B-wave produced a recovery to approximately $5,400, forming a lower high than the original peak
- The C-wave represents the current consolidation phase, with the final low yet to be confirmed
A critical element of Wagner's methodology involves ratio analysis for projecting corrective wave extent. Once the A-wave amplitude is established as a benchmark, the model typically projects the C-wave to reach between 60% and 75% of the A-wave measurement. This mathematical framework, rather than subjective judgement, drives target calculations for the subsequent motive wave.
"It's much easier to predict where it might go if we have that range of a top and a bottom. And that's now in place." – Gary Wagner, The Daniela Cambone Show
Has Gold Bottomed? Key Support and Resistance Levels
| Level | Classification | Significance |
|---|---|---|
| $5,600+ | Prior all-time high | Hard resistance ceiling |
| $5,400 | B-wave lower high | Interim resistance |
| $4,900 | Short-term resistance | Prior lower high |
| $4,400 to $4,600 | Major support floor | High-conviction technical base |
| $4,100+ | Corrective A-wave low | Likely corrective floor |
Wagner's assessment is that gold is unlikely to break below the $4,400 to $4,500 zone even in a worst-case near-term correction, describing the probability of a breach below this level as very low given the scale of the prior correction already observed.
Furthermore, considering gold as a safe haven remains a compelling case when viewed through this technical lens, particularly as institutional support floors continue to be defended.
Bullish vs. Bearish Scenarios for Gold in 2026:
| Scenario | Price Range | Key Trigger |
|---|---|---|
| Base Case (Bullish) | $5,800 to $6,000 | Dollar weakness continues, central bank buying sustained |
| Extreme Upside | $6,500 to $7,200 | Geopolitical escalation, systemic financial stress |
| Corrective Downside | $4,100 to $4,400 | Short-term technical pressure, dollar recovery |
| Bear Case | Below $3,500 | Aggressive Fed tightening, significant dollar surge |
On the subject of $7,000 gold, Wagner frames it explicitly as a matter of timing rather than probability. Whether it arrives in two years or five years remains uncertain, but the directional outcome is considered by his analysis to be a structural inevitability given the sustained forces at play.
What Is the Silver Price Forecast for 2026? The Path to $100
Breaking the $50 Ceiling That Held for Over a Decade
Silver's behaviour in 2025 represents one of the more extraordinary price events in the metal's modern trading history. For years following the 2011 peak, silver maintained a hard technical ceiling near the $50 per ounce level. Gold consistently broke through its equivalent record highs during the intervening years, but silver did not follow. This divergence created a sustained period of relative underperformance that lasted over a decade.
That ceiling broke decisively in 2025. Silver not only cleared $50 but surged past $100 and briefly exceeded $120 on a futures basis. Using October 2024 as a baseline when silver was trading near $40 per troy ounce, the subsequent move to above $120 represents a gain of more than 200% in under twelve months.
Wagner acknowledges the $120 level caught even experienced analysts by surprise. His own prior probability assessment for silver breaching $100 was around 40% in favour, meaning the minority outcome materialised. This candid acknowledgment from a practitioner with over three decades of experience underscores the genuine difficulty of forecasting parabolic price moves even when the directional bias is correct.
Bank and Analyst Silver Price Forecasts
| Source | Silver Price Target | Timeframe |
|---|---|---|
| Deutsche Bank | $100 | End of 2026 |
| Citigroup | $100 to $150 | Q2 2026 |
| BNP Paribas | Potential to double | Year-end 2026 |
| Bank of America | $65 | 2026 |
| HSBC | $68.25 | 2026 |
| JPMorgan | $58 average | 2026 |
| UBS | $55 | Mid-2026 |
| Robert Kiyosaki | $100 to $200 | 2026 |
| Keith Neumeyer (First Majestic) | $100+ | 2026 |
A clear consensus split is evident. Mainstream institutional banks cluster at $55 to $68, while more bullish forecasters including Deutsche Bank and Citigroup target $100 or above. The $100 level functions as the critical psychological and technical threshold: currently acting as resistance but broadly targeted to transition into a support base.
Disclaimer: Price forecasts carry significant uncertainty and reflect individual analysts' views at a point in time. Precious metals investments carry risk of capital loss. These figures should not be construed as investment recommendations.
Why Silver Is More Volatile Than Gold: The Structural Explanation
Wagner's framework for understanding silver's amplified volatility is illuminating. He uses an analogy that captures the dynamic effectively: a candle lit at both ends is twice as bright but lasts half as long. Silver's volatility is not random noise; it is a structural consequence of specific market characteristics.
The key factors driving silver's volatility differential include:
- Liquidity differential: Gold futures trading volume significantly exceeds that of silver. Smaller capital flows therefore create proportionally larger price dislocations in silver markets
- Dual market identity: Silver functions simultaneously as a monetary metal and an industrial commodity, with demand from solar panel manufacturing, electric vehicle components, electronics, and medical applications all intersecting with investment demand
- Market size: The overall silver market is considerably smaller than gold's, meaning the same dollar amount of buying or selling pressure produces a larger percentage move
- Percentage move asymmetry: Silver routinely outperforms gold on the upside during rallies and underperforms on the downside during corrections, making both the reward potential and the drawdown risk materially higher
Risk Warning: Silver's parabolic behaviour during 2025 included a single-month period in March where the price opened near $96 per ounce and closed near $75 per ounce. This represents a roughly 22% decline within a single monthly candle, occurring within a confirmed primary bull market. This illustrates that short-term positioning in silver carries substantially higher drawdown risk than gold, even when the long-term directional thesis remains intact.
What $100 Silver Actually Means: The Critical Technical Level
Wagner's silver target for the end of 2026 is not a nominal $100 print but rather the establishment of $100 as a sustained support base. This distinction matters considerably for interpretation.
Silver briefly exceeded $120, but Wagner characterises that level as unlikely to be sustainable in the near term. The $120 move represents what technical analysts classify as a parabolic move: a near-linear price ascent at approximately a 90-degree trajectory on a monthly chart. Parabolic moves, by their structural nature, are followed by sharp corrections before sustainable trends can continue.
The real bullish confirmation signal would be $100 establishing itself as durable support, concurrent with gold challenging $5,800 to $6,000 by year-end. For Wagner, these two outcomes arriving simultaneously would be the technical evidence that the next major motive wave is underway. Analysts tracking silver versus gold performance note that this kind of synchronised confirmation has historically preceded the most powerful phases of precious metals bull markets.
Gold vs. Silver: Which Offers Better Value in 2026?
A Comparative Framework for Investors
| Factor | Gold | Silver |
|---|---|---|
| Volatility | Moderate | High |
| 2026 Upside Range | $5,800 to $6,300 | $55 to $150 (wide range) |
| Downside Risk Floor | $4,100 to $4,400 | Higher drawdown potential |
| Industrial Demand | Minimal | Significant (solar, EVs, electronics) |
| Liquidity | Very high | Moderate |
| Central Bank Demand | Strong | Negligible |
| Physical Accumulation Case | Strong | Strong |
The Gold-Silver Ratio: What It Signals About Relative Value
The gold-silver ratio, which measures how many ounces of silver are required to purchase one ounce of gold, has historically ranged between approximately 15:1 and 100:1. At current price levels, the ratio remains elevated relative to its long-term historical average, which many analysts interpret as silver carrying greater percentage upside potential relative to gold. A reversion toward historical ratio norms would imply silver outperforming gold on a percentage basis over the medium term.
Portfolio Allocation Considerations
Wagner's guidance on physical precious metals allocation is consistent across different market environments. His recommendation of 5% to 15% of a portfolio in physical metals, calibrated by age and risk tolerance, applies to physical accumulation specifically, not paper exposure through ETFs or futures contracts. This distinction matters because physical metal provides outright ownership without counterparty risk, whereas ETF and futures exposure involves additional layers of financial structure.
His long-term perspective draws an explicit parallel to real estate: steady underlying demand, periodic wide price swings, but consistent value appreciation when viewed across compressed multi-year timeframes. Gold declining from $1,900 in mid-2011 to approximately $1,000 by end-2015 before recovering and ultimately multiplying several times over is cited as the structural precedent.
The next major ASX story will hit our subscribers first
The Key Drivers That Could Push Gold Past $6,000
Structural Catalysts Supporting the Bull Market
1. Central Bank Accumulation
The institutional logic behind sovereign gold buying has shifted fundamentally. Central banks that spent the 1990s and 2000s selling gold reserves are now net buyers. The reasoning Wagner articulates reflects a multi-century value preservation argument rather than short-term return optimisation. This is not momentum chasing; it is strategic reserve allocation.
2. Dollar Index Deterioration
The DXY's decline from above 100 represents a significant shift in the currency landscape. Because gold and silver are priced against the dollar, currency basket erosion creates a structural tailwind that operates independently of commodity-specific demand. Even modest dollar index moves of one to two percent carry outsized implications for precious metals pricing.
3. Fiscal and Monetary Policy Architecture
Post-2008 monetary expansion has compounded across more than fifteen years, creating a backdrop that some analysts characterise as the potential end of a monetary era rather than a cyclical downturn. The distinction matters because cyclical corrections eventually reverse, while structural monetary shifts reshape asset valuations permanently.
4. Geopolitical Risk Premium
Elevated geopolitical uncertainty creates sustained safe-haven demand. UBS's $7,200 extreme upside scenario is explicitly conditional on geopolitical escalation, suggesting that even the most optimistic institutional forecasts require additional catalysts beyond current baseline assumptions.
5. Institutional and ETF Inflows
Professional investor and hedge fund participation has expanded meaningfully, with ETF inflows reaching multi-year highs as institutional allocation frameworks increasingly incorporate gold as a macro hedge against currency and fiscal risk.
The Long-Term Thesis: A Generational Precious Metals Cycle
What Compressed Charts Reveal About Multi-Decade Trends
Wagner's analytical technique of compressing monthly charts to view long-term price structures reveals patterns that are invisible on shorter timeframes. Silver's extended consolidation between approximately $14 per ounce during 2016 to 2019, followed by a breakout to $30, a correction, and then a parabolic advance, fits a pattern of accumulation preceding explosive moves that has repeated across multiple commodity cycles.
What technical analysts refer to as noise dominates short-term price action. Day-to-day and week-to-week movements are genuinely difficult to predict with reliability. However, compressing the timeframe to decades transforms the signal-to-noise ratio dramatically. Over ten-year periods, the directional case for both gold and silver as value preservation vehicles becomes considerably more consistent. Broader analyst gold price forecasts for 2026 and 2027 similarly reflect this long-horizon perspective.
The Nixon Shock as a Historical Inflection Point
The 1971 decoupling of gold from the dollar under President Nixon marked the beginning of gold's modern price discovery era. Prior to that structural break, gold was effectively pegged and therefore unable to reflect monetary dynamics in its price. The current fiscal environment, characterised by expanding money supply, persistent deficits, and structural debt obligations, draws some analytical parallels to an equivalent inflection point in the long-term monetary framework.
Analytical Framework: When the very institutions responsible for creating fiat currency are structurally increasing their gold holdings, this represents a signal about the long-term trajectory of paper money systems that extends well beyond typical investment cycle analysis. Wagner frames this as a multi-century confidence argument, not a short-term trade.
Frequently Asked Questions: Gold and Silver Price Forecasts
What is the gold price forecast to 6000 and silver to 100 — is it realistic?
The majority of major Wall Street institutions forecast gold reaching $6,000 to $6,300 per ounce by year-end 2026, with JPMorgan at $6,300 and UBS projecting $6,200 by mid-2026. Technical analyst Gary Wagner independently targets $6,000 as a high-probability year-end outcome based on Elliott Wave corrective pattern completion analysis. Note that futures pricing is slightly above spot pricing; spot gold will trade at a modest discount to the figures cited.
Will silver reach $100 per ounce in 2026?
Deutsche Bank and Citigroup both forecast silver reaching $100 by end of 2026 and Q2 2026 respectively. Mainstream bank consensus remains more conservative, with JPMorgan, UBS, and HSBC forecasting $55 to $68. Wagner's target is not merely a $100 price print but rather $100 establishing itself as durable support, which he sees as concurrent with gold approaching $5,800 to $6,000.
Why is silver more volatile than gold?
Silver's higher volatility stems from its lower market liquidity relative to gold, its dual function as both a monetary and industrial metal, and the smaller overall market size, which means capital flows create proportionally larger price dislocations. Wagner describes this as a structural characteristic rather than a temporary phenomenon.
What technical indicators suggest gold has more upside?
Elliott Wave analysis shows gold completing an ABC corrective pattern from its $5,600+ peak, with major technical support at $4,400 to $4,600. The establishment of both a confirmed top and confirmed bottom provides the reference points needed for reliable target projection, an advantage that was absent during the uninterrupted record-breaking ascent.
How much of a portfolio should be in precious metals?
Wagner's guidance suggests 5% to 15% of a portfolio in physical precious metals, adjusted for individual age, risk tolerance, and investment horizon. This allocation recommendation applies to physical bullion and coins rather than paper instruments, and is intended as a long-term preservation strategy rather than a short-term speculative position.
Could gold reach $7,000?
Wagner explicitly frames $7,000 gold as a question of timing rather than probability. UBS maintains a $7,200 extreme upside scenario. Wagner's own assessment is that this level could arrive within two to five years, though he does not expect it within the current calendar year. He distinguishes this measured view from more aggressive forecasts of $10,000 within a few years, which he characterises as beyond what his technical framework supports.
Key Takeaways: The Summary Case for Gold to $6,000 and Silver to $100
- Gold consensus target: $6,000 to $6,300 per ounce by year-end 2026 across six major Wall Street institutions, with independent technical analysis arriving at the same destination
- Silver consensus split: Mainstream banks cluster at $55 to $68; Deutsche Bank and Citigroup target $100 or above; the $100 level must transition from resistance to support to confirm the next major bull leg
- Technical support for gold: $4,400 to $4,600 floor identified as high-conviction technical base, with Elliott Wave ABC correction structure nearing completion
- Silver's critical threshold: $100 establishing itself as durable support, rather than merely being touched, is the confirmation signal analysts are watching
- Primary macro drivers: Dollar weakness, central bank accumulation, ETF inflows, fiscal pressure, and geopolitical risk premium all operating simultaneously
- Long-term trajectory: Both metals expected to be materially higher across a ten-year horizon; $7,000 gold viewed as a structural inevitability with a timing uncertainty rather than a speculative outlier
- Physical allocation guidance: 5% to 15% of portfolio in physical metals remains Wagner's consistent recommendation across market environments
This article is intended for informational and educational purposes only and does not constitute financial or investment advice. Precious metals investments carry risk, including the risk of capital loss. Past price performance is not indicative of future results. Readers should consult a qualified financial adviser before making investment decisions.
Want to Know When the Next Major Precious Metals Discovery Hits the ASX?
While gold and silver price forecasts point toward $6,000 and $100 respectively, the real leverage often lies in the exploration companies making significant mineral discoveries before the broader market takes notice — Discovery Alert's proprietary Discovery IQ model delivers real-time ASX alerts on exactly these opportunities, turning complex discovery data into actionable insights for both short-term traders and long-term investors. Explore historic mineral discovery returns to understand the scale of opportunity, then begin your 14-day free trial to position yourself ahead of the market.