August 6, 2026
The Hidden Architecture of Precious Metals Cycles: Reading the Signals in August 2026
Most investors approach gold and silver by watching headlines: inflation prints, central bank statements, geopolitical flare-ups. But seasoned technical analysts argue that price structure itself tells a more reliable story than any news cycle. The discipline of reading moving averages, Fibonacci extensions, and momentum crossovers strips away emotional noise and reveals the underlying architecture of a market trend. In August 2026, that architecture is sending a nuanced message for the August precious metals projections and gold silver outlook: technically challenged in the near term, but carrying the seeds of a potentially significant future move.
Understanding what those signals actually mean, and what conditions would need to change to flip the longer-term thesis, is the central challenge for gold and silver investors right now.
When big ASX news breaks, our subscribers know first
What Are the Key Forces Shaping Precious Metals in August 2026?
The Macro Backdrop: A Critical Inflection Point
Gold and silver have spent several months navigating a complex intersection of currency dynamics, equity market momentum, and shifting institutional positioning. Three dominant macro forces are competing simultaneously in August 2026:
- A technically strengthening US dollar, now exhibiting the classic characteristics of a new bull market phase
- A broadening equity market rally, with institutional capital rotating out of high-volatility technology names into broader market sectors
- Persistent safe-haven demand underpinned by geopolitical uncertainty and ongoing sensitivity to Federal Reserve policy expectations
Historically, August represents a seasonal transition period for precious metals. It is often a pause before Q4 repositioning accelerates, and 2026 appears to be following that pattern with unusual precision.
Understanding the Dollar Index: The Variable Most Investors Underestimate
The US Dollar Index (DXY) is a trade-weighted basket of major fiat currencies. The euro carries the largest weighting, followed by the Japanese yen, the British pound, and several others. A coordinated policy arrangement between the US Treasury and the Bank of Japan introduced yen-specific volatility into the index during mid-2026, creating short-term distortions that technical analysts describe as emotionally driven rather than structurally significant.
From a pure chart structure perspective, the dollar has technically entered a new bull market phase, forming higher highs and higher lows off a January 2026 base. The long-term 150-day moving average, a key trend-classification tool, is now sloping upward with price trading above it. The critical observation from technical analyst Christopher Vermeulen of technicaltraders.com is that the dollar bottomed in January 2026, and precious metals peaked at almost exactly the same time. That coincidence of timing is not accidental; it reflects the well-established inverse relationship between dollar strength and metal prices.
The dollar is now testing critical support near the 99 level on the DXY, a zone that previously acted as multi-year resistance and has now converted to structural support following a high-volume, emotionally driven pullback. The technical interpretation is significant:
A dollar that stabilises and trades sideways is not a tailwind for precious metals, but it does remove the active headwind that has been suppressing prices for several months.
The expectation among technical analysts is that the dollar will trade sideways in the near term while equity markets absorb capital, before potentially resuming its uptrend once the equity rally stalls. That sequence, if it plays out, would represent a delayed resumption of pressure on metals rather than relief. Furthermore, understanding gold and bonds dynamics during this phase can provide additional context for how institutional portfolios are responding to these currency pressures.
Gold Price Forecast for August 2026: Technical Structure and Professional Projections
Where Gold Stands Right Now
Gold's long-term trend remains technically bearish following a peak in early 2026. Both the 50-day and 20-day moving averages are sloping downward, and price is trading below the long-term trend line. The current price action mirrors a classic bear market structure that technical analysts describe with a Bitcoin analogy: a leg down, a pause, another leg down, another pause. Each rally within this structure functions as a counter-trend bounce rather than a new bull market impulse.
A particularly instructive technical framework being applied to gold in August 2026 is the Fibonacci extension model. The same mathematical approach that successfully mapped gold's prior upside rally, with the 61.8% golden ratio level acting as a key upside target, is now being applied to the downside. The precision with which Fibonacci levels guided the bull run is expected by some analysts to define the bear phase with equal accuracy.
August Gold Price Range: What Professional Forecasters Are Projecting
| Forecasting Source | August 2026 Gold Range | Methodology / Notes |
|---|---|---|
| CBS News / Expert Survey | $3,900 – $4,350/oz | Bullish Q4 setup if August holds |
| CPM Group (via Kitco) | $3,800 – $4,150/oz | Consolidation base case |
| IndexBox Consensus | ~$4,000 – $4,200/oz | Near-term sideways drift |
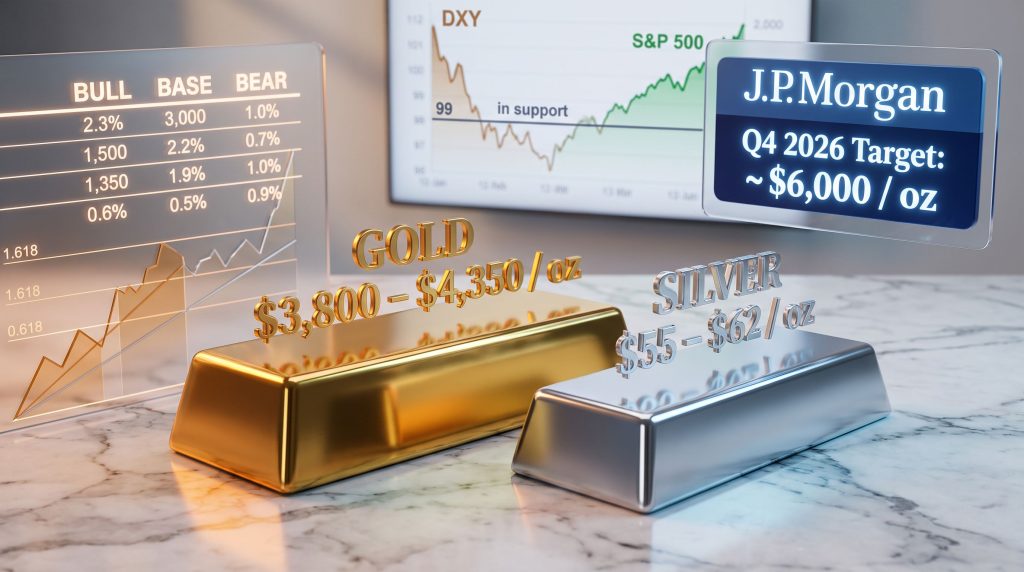
| J.P. Morgan (Q4 2026 avg.) | ~$6,000/oz | Longer-term institutional bull case |
| LBMA Survey Range | Wide dispersion | Reflects deep uncertainty in magnitude |
Featured Snippet: Gold's most widely cited August 2026 price range sits between $3,800 and $4,350/oz, with near-term consolidation expected before a potential Q4 acceleration. The most bullish institutional forecast, J.P. Morgan's Q4 2026 average target, approaches $6,000/oz, but this reflects a full-year positioning thesis rather than an August-specific call.
For a broader perspective on how these numbers compare across asset classes, expert silver and gold price forecasts from CBS News offer useful corroboration of the consensus range, reinforcing the consolidation thesis heading into Q4.
What Would Confirm a New Gold Bull Market?
Technical analysts are precise about what conditions must be met before a genuine trend reversal can be declared. The criteria are sequential and non-negotiable from a charting perspective:
- A strong impulse move that breaks through two consecutive significant resistance highs in sequence, not just one
- The 5-day moving average crossing above the 20-day, followed by the 20-day crossing above the 50-day, with all three simultaneously sloping upward
- Higher lows forming on the daily chart, establishing a visible launch-pad base structure
- Critically, the 50-day moving average requires approximately 50 consecutive sessions of higher average pricing before it can technically reverse direction, meaning any genuine trend change takes considerable time to confirm even after it begins
This last point is rarely appreciated by retail investors who see a short-term price spike and interpret it as the start of a new bull run. The mathematics of moving averages means trend changes are always confirmed in retrospect, never in real time.
Silver Price Forecast for August 2026: Higher Beta, Wider Swings
Silver's Technical Position: Bounce or Breakout?
Silver is exhibiting an almost identical technical structure to gold in August 2026. Downtrending moving averages, a pause in the decline, and a nascent short-term uptick that remains unconfirmed as a trend reversal. The 5-day moving average has crossed above the 20-day, generating a minor momentum signal. However, the 50-day remains in a downtrend, meaning the broader trend classification is still bearish.
Silver's higher beta nature relative to gold is a critical characteristic for investors to understand. Any directional move, up or down, is likely to be amplified in percentage terms relative to gold. This makes silver a more attractive vehicle for traders seeking leveraged exposure to a metals rally, but a significantly more dangerous position to hold through a continued bear market. In addition, reviewing gold-silver ratio analysis can help investors gauge whether silver is historically over- or undervalued relative to gold at current levels.
August Silver Price Range: Consensus Forecasts
| Forecasting Source | August 2026 Silver Range | Key Notes |
|---|---|---|
| CBS News / Expert Commentary | $55 – $68/oz | Resistance near $68; possible retest of $55 |
| StoneX / Kitco-Style Coverage | $55 – $60/oz | Downside risk to $54–$56 if weakness continues |
| CPM Group | ~$54 – $60/oz | Base case consolidation |
| Broader Market Commentary | $56 – $62/oz | Breakout only above low-$60s |
Featured Snippet: Silver's August 2026 base-case range is broadly $55–$62/oz, with resistance clustered near $68 and downside support around $54–$56. A decisive close above the low-$60s would be required to signal a meaningful shift in trend momentum.
Key Silver Price Levels to Watch
- $54–$56/oz: Structural support zone; a breakdown here signals continuation of the bearish trend and would likely accelerate selling pressure
- $60–$62/oz: Near-term resistance; a clean break above this zone would improve the short-term technical picture meaningfully
- $68/oz: Major resistance level; a sustained move above this price would represent a significant technical development and would likely trigger broader market attention and momentum-driven buying
- For a genuine bull market re-entry signal: look for a strong impulse move that clears two consecutive significant highs, followed by a healthy consolidation and a second breakout attempt, confirming the new trend rather than just testing it
How Is the Equity Market Rally Affecting Precious Metals in August 2026?
The Rotation Story: Where Institutional Capital Is Moving
The S&P 500 broke to new all-time highs in early August 2026, while the equal-weighted S&P 500 advanced simultaneously. This is a technically meaningful divergence from the pattern seen during much of 2024 and 2025, where large-cap technology and AI stocks drove the headline index while the broader market lagged. The fact that equal-weighted indices are now advancing alongside the cap-weighted benchmark signals that institutional capital is rotating into broader market sectors rather than exiting equities entirely.
The NASDAQ 100, tracked via the QQQ ETF, experienced a cluster of cycle lows in mid-2026 followed by a sharp recovery. Fibonacci extension analysis applied to this recovery structure points to a potential 8% upside at the 61.8% golden ratio extension and an 18% upside at the full 100% measured move from early August levels. Small-cap (IWM) and micro-cap indices are also approaching multi-year highs, with strong momentum signals suggesting institutional risk appetite remains elevated well beyond the mega-cap technology sector.
The behavioural dynamic driving this rotation is significant. Large institutional managers are migrating out of high-volatility, bubble-adjacent technology names not because they are pessimistic on equities, but because concentration risk in AI and big tech has reached a level where the risk-reward calculus no longer favours continued overweighting. The money is not leaving markets; it is seeking better-valued entry points within markets.
What Does an Equity Bull Market Mean for Gold and Silver?
Historically, precious metals and equities have shown periods of positive correlation during broad risk-on phases. Both can rise together when liquidity is abundant and investor confidence is elevated. The current environment suggests metals may drift modestly higher alongside equities in the near term. Consequently, gold in volatile markets has demonstrated that its safe-haven characteristics can coexist with equity strength during certain market phases.
However, technical analysts caution strongly against interpreting this as a fundamental re-rating of the metals bull case. The more critical question concerns what happens after the equity rally peaks. Two distinct scenarios emerge:
- If stocks roll over and the dollar accelerates higher, precious metals face renewed downward pressure
- If a sharp equity correction triggers a flight-to-safety dynamic, gold in particular could receive a genuine fundamental bid
Scenario Watch: Technical cycle analysis suggests the equity market may be approaching a final blow-off phase. If that materialises, precious metals could temporarily benefit from the associated liquidity and risk-on sentiment before facing renewed pressure when the cycle turns. Investors positioned heavily in metals anticipating this scenario should be aware of the reversal risk that follows.
Gold Mining Equities in August 2026: Reading the GDX Chart Honestly
GDX Technical Assessment: Still a Bear Market
Gold mining equities, proxied by the GDX ETF, remain in a technical bear market as of early August 2026. The long-term moving average is sloping downward, the 50-day is declining, and the 20-day is positioned below it. A very early-stage momentum signal has emerged: the 5-day moving average has crossed above the 20-day, suggesting a possible short-term bounce toward the $80.50 area. But this represents limited upside within a broader downtrend, not the beginning of a sustained recovery.
One of the more important analytical distinctions that separates disciplined technical trading from retail enthusiasm is the difference between a bounce within a downtrend and a genuine trend reversal. The mining sector is currently experiencing the former. Understanding gold miners sensitivity to underlying metal prices helps explain why equities cannot decouple from commodity trends for any sustained period.
There is also a sequencing logic that governs mining equity recoveries. Metal prices themselves must demonstrate a genuine trend reversal before mining equities can sustainably outperform. The equities leverage the underlying commodity; they cannot decouple from it for long. This means the technical confirmation criteria outlined for gold and silver above are prerequisites for any durable mining equity bull market, not just supporting factors.
The Strategic Philosophy Behind Waiting for Confirmation
A specific investment philosophy worth examining here is the concept of buying at a higher price after a trend has been confirmed, rather than attempting to buy at the bottom during an ongoing downtrend. This runs counter to the intuition of most retail investors, who are conditioned to think of lower prices as better entry points.
The counter-argument from technical analysts is that the opportunity cost of holding a declining or sideways asset for one, two, or even three years is substantial, particularly in an environment where other sectors are generating strong returns. A strategy that buys at a slightly higher confirmed price but avoids the carrying cost of a prolonged downtrend can outperform dramatically over a full cycle.
Disciplined risk management means accepting that you will sometimes miss the exact bottom in exchange for far greater certainty about the direction of the trend when you do enter.
The next major ASX story will hit our subscribers first
Bull, Base, and Bear Case Scenarios for August 2026
Three-Scenario Framework for Gold and Silver
| Scenario | Gold August Range | Silver August Range | Key Trigger |
|---|---|---|---|
| Bear Case | $3,600 – $3,800/oz | $50 – $55/oz | Dollar breaks higher; equities stall; risk-off rotation |
| Base Case | $3,800 – $4,200/oz | $55 – $62/oz | Sideways dollar; equities grind higher; metals drift up |
| Bull Case | $4,200 – $4,350/oz+ | $62 – $68/oz | Dollar breaks down; Fed pivot signals; geopolitical shock |
The J.P. Morgan Q4 2026 target of approximately $6,000/oz for gold represents an extreme bull case that extends well beyond August and reflects a full-year institutional positioning thesis built on the assumption of significant monetary policy shifts and sustained dollar weakness materialising over the second half of the year. The precious metals market analysis for prior cycles further contextualises why such targets, whilst ambitious, are not without historical precedent during major macro inflection points.
What Are the Biggest Risks and Catalysts for Precious Metals in Q3–Q4 2026?
Upside Catalysts
- A Federal Reserve pivot toward rate cuts or meaningfully dovish forward guidance, historically one of the most powerful drivers of gold demand as real yields compress
- A breakdown in the US dollar below the 99 support level, reversing the nascent dollar bull market and releasing the suppressive pressure on metal prices
- Escalation of geopolitical risk through military conflict, trade disruption, or sovereign debt stress, driving safe-haven flows into gold specifically
- A sharp equity market correction that triggers flight-to-safety buying and reverses the current rotation dynamic
Downside Risks
- Dollar strength resuming after the current consolidation phase, capping metal price appreciation even if other conditions are supportive
- An equity market blow-off phase absorbing capital that might otherwise flow into metals, delaying rather than preventing a metals recovery
- Seasonal August softness extending into September before any Q4 recovery materialises, a pattern consistent with historical seasonal behaviour in gold
- Continued underperformance of mining equities dampening retail investor enthusiasm and reducing the capital inflows that amplify metals bull markets
The Monetary Policy Variable
Fed policy expectations remain among the most sensitive inputs to precious metals pricing in the current environment. Any shift in the rate path, inflation data surprises, or changes in real yield dynamics could rapidly alter the technical picture in either direction. The yen-dollar dynamic, shaped by Bank of Japan policy decisions, adds an additional layer of currency complexity capable of generating short-term volatility spikes that confuse trend signals and create false breakout patterns. For further context, silver price forecast predictions from GoldSilver.com offer a useful reference point for how monetary policy scenarios are being priced into the silver market specifically.
Frequently Asked Questions: August 2026 Precious Metals Outlook
What is the gold price forecast for August 2026?
The consensus range from professional forecasters sits between $3,800 and $4,350/oz for August 2026, with most base-case projections clustering around $3,800–$4,200. More bullish institutional forecasts reflect a longer-term thesis rather than an August-specific projection.
What is the silver price forecast for August 2026?
Silver's August 2026 base-case range is broadly $55–$62/oz, with resistance near $68 and downside support around $54–$56. Silver is expected to exhibit wider percentage swings than gold due to its higher beta characteristics.
Is gold in a bull market or bear market in August 2026?
From a pure technical standpoint, gold remains in a technical bear market as of early August 2026, with declining moving averages and a pattern of lower highs and lower lows since its early 2026 peak. Current price action is being classified by technical analysts as a counter-trend bounce rather than the beginning of a new bull market.
What would trigger a new precious metals bull market?
A new bull market in gold and silver would require: (1) a strong impulse move breaking through two consecutive significant resistance levels, (2) moving average alignment with the 5-day above the 20-day above the 50-day, all sloping upward, and (3) the establishment of higher highs and higher lows on the daily chart confirming a structural trend change.
How does the US dollar affect gold prices?
Gold and the US dollar have historically exhibited an inverse relationship. A stronger dollar makes gold more expensive in other currencies, reducing global demand. With the dollar testing support near the 99 level after entering a technically defined bull market, it is acting as a neutral-to-mildly suppressive force on metals in August 2026, rather than the active headwind it presented in prior months.
Should investors buy gold or silver in August 2026?
This depends entirely on individual risk tolerance and time horizon. Gold offers more stability and is holding up better on a relative percentage basis. Silver offers higher upside potential with significantly more volatility in both directions. Technical analysts broadly suggest waiting for confirmed trend reversal signals before establishing significant new positions in either metal. This is not financial advice. Investors should consult a licensed financial adviser before making investment decisions.
Key Takeaways: August 2026 Precious Metals Summary
- Gold is consolidating in the $3,800–$4,200 range with limited near-term upside unless a meaningful catalyst forces a trend change; the long-term institutional bull case remains intact but is a Q4 story, not an August story
- Silver is tracking gold's pattern with amplified volatility; the $55–$62 range represents the near-term base case, with $68 as the key resistance level to monitor
- The dollar is at a technical inflection point, holding support near 99 and likely to trade sideways before potentially resuming its uptrend when equity momentum fades
- Equity markets are in a broadening rally phase with potential for further upside of 8–18% on the NASDAQ based on Fibonacci extension targets, which may temporarily lift metals but is not a substitute for a genuine metals bull market signal
- Mining equities remain in a technical bear market; any bounce should be treated as a trading opportunity within a downtrend until moving average structure confirms otherwise
- The critical watch signal for the August precious metals projections and gold silver outlook thesis: a strong impulse move in gold or silver that breaks through two consecutive resistance highs would be the earliest reliable indicator that the next major bull phase is genuinely beginning
Disclaimer: This article is for informational and educational purposes only and does not constitute financial advice. All price forecasts referenced are sourced from third-party analysts and institutions and carry inherent uncertainty. Past performance of any asset is not indicative of future results. Readers should conduct their own due diligence and consult a qualified financial professional before making any investment decisions.
Want to Be First When the Next Major Mineral Discovery Hits the ASX?
While precious metals cycles unfold across months of technical analysis, mineral discovery opportunities on the ASX can emerge in a single trading session — and timing is everything. Discovery Alert's proprietary Discovery IQ model scans ASX announcements in real time, instantly converting complex geological data across 30-plus commodities into clear, actionable insights, so subscribers are positioned ahead of the broader market. Explore historic discovery returns to understand the scale of opportunity, then begin a 14-day free trial at Discovery Alert to secure your market-leading edge.