July 18, 2026
The Mechanics Behind Gold's Sensitivity to Monetary Policy
Few financial relationships carry as much analytical weight as the connection between central bank interest rate decisions and the price of gold. Understanding the gold price forecast and Fed rate hike impact requires looking beyond the surface-level cause-and-effect narrative and examining the underlying transmission mechanisms that have shaped precious metals markets across multiple economic cycles.
Gold does not pay a dividend. It generates no coupon. Its entire investment proposition rests on capital appreciation and its function as a store of value during periods of monetary or geopolitical stress. This structural characteristic makes it uniquely sensitive to changes in the real cost of money, and by extension, to every signal that emerges from the Federal Reserve's policy apparatus.
When big ASX news breaks, our subscribers know first
Why Fed Policy Remains the Single Biggest Variable in the Gold Price Forecast
The Opportunity Cost Mechanism: How Rate Hikes Suppress Gold Demand
When interest rates rise, investors holding gold face an increasingly visible opportunity cost. Every basis point added to the federal funds rate makes US Treasuries, money market instruments, and high-grade corporate bonds comparatively more attractive. The capital that might otherwise flow into bullion instead gravitates toward yield-generating assets. This dynamic is not merely theoretical. It has played out repeatedly across tightening cycles, producing measurable drawdowns in gold prices whenever real yields move decisively higher.
The critical phrase here is real yields, not nominal rates. This distinction is often misunderstood by retail investors and carries significant implications for how to interpret the gold price forecast and Fed rate hike impact in any given environment. Furthermore, understanding how interest rate hikes affect gold's price helps investors contextualise these movements within broader monetary cycles.
Real Yields vs. Nominal Rates: Why the Distinction Matters for Bullion Holders
Nominal interest rates describe the stated rate of return on a bond or deposit. Real yields subtract the prevailing inflation rate to reveal the actual purchasing power return an investor receives. When nominal rates rise but inflation rises faster, real yields can actually fall, creating a paradoxically bullish environment for gold even during a formal tightening cycle.
This nuance is central to understanding why gold can sometimes appreciate alongside rising nominal rates. If the Federal Reserve is raising rates at a pace that investors perceive as insufficient to contain inflation, the market effectively prices in a declining real yield, which removes one of the primary headwinds for bullion. Conversely, aggressive rate hikes that outpace inflation expectations push real yields sharply higher, compressing gold's appeal considerably.
Dollar Strength as a Secondary Transmission Channel from Fed Tightening
Rate hikes strengthen the US dollar by increasing demand for dollar-denominated assets from international investors seeking higher returns. Because gold is priced globally in US dollars, a stronger greenback raises the effective cost for buyers in other currencies, reducing international demand. This secondary channel amplifies the bearish pressure on gold during tightening cycles and helps explain why dollar index movements are closely tracked by precious metals analysts as a leading indicator.
Furthermore, gold and bond dynamics interact in ways that reinforce this relationship, particularly when investors rotate between fixed-income instruments and precious metals in response to shifting yield expectations.
Where Is Gold Headed? Mapping the 2026 Price Trajectory
Gold's 2026 Performance Snapshot: From All-Time High to Correction Territory
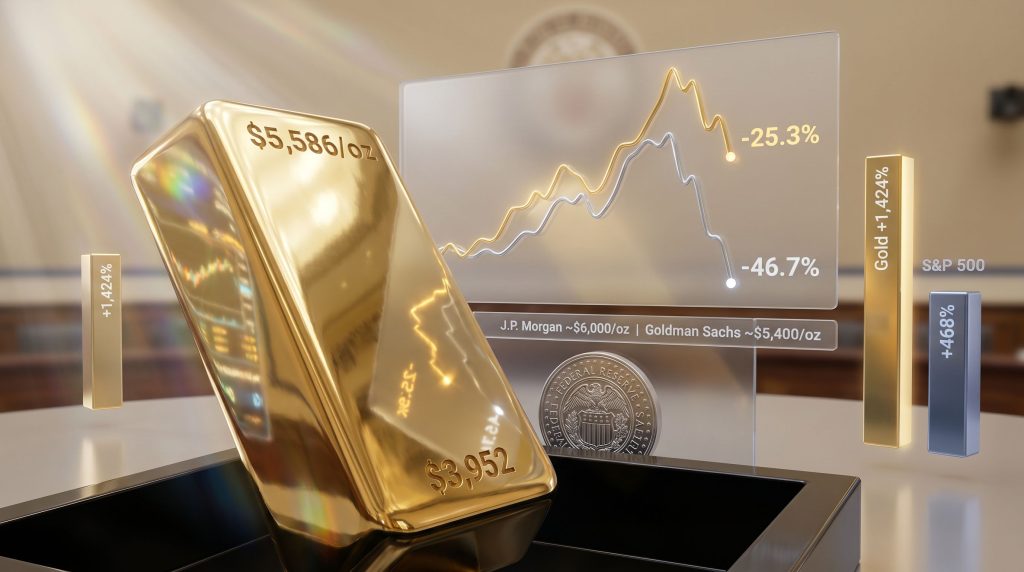
The gold price trajectory in 2026 has been defined by an extraordinary peak followed by a sustained technical retreat. After reaching a year-to-date high of approximately $5,586/oz in late January 2026, gold entered a prolonged correction phase that extended through the first half of the year. By mid-June 2026, prices had settled in the $4,173 to $4,228 range, representing a drawdown of approximately -25.3% from the all-time high and a year-to-date decline of roughly -3.7% from the prior year's settlement near $4,332.
An important structural observation: seven of the past ten weekly settlements through mid-June 2026 have printed net negative, reinforcing the technically deteriorating near-term posture without negating the broader multi-year bull thesis.
Technical Signals Pointing Toward a Near-Term Fair Value Zone Around $3,952
Regression-based trend modelling applied to gold's price history has identified a fair value zone near $3,952/oz as a potential gravitational level during the current correction. This places a further -211 points of downside from the mid-June 2026 level of approximately $4,173, within an environment where the expected weekly trading range has been running at approximately 281 points and the daily range near 119 points. The proximity of current prices to this technical fair value level has significant implications for both tactical positioning and longer-term entry point analysis.
What a 14-Week Parabolic Short Trend Tells Us About Market Momentum
As of mid-June 2026, gold's parabolic trend indicator had registered 14 consecutive weeks in a short configuration, placing this corrective phase among the more extended negative momentum sequences observed since July 2021. Prolonged parabolic short trends do not automatically precede major reversals, but they do accumulate the technical conditions that can make sustained short positioning increasingly dangerous. History suggests that the longer these configurations persist, the more violently they tend to resolve when event-driven catalysts emerge.
What Are the Major Investment Banks Forecasting for Gold in 2026?
Bullish Institutional Targets: J.P. Morgan and Goldman Sachs Projections
Despite the near-term technical headwinds, major institutional forecasters maintain structurally bullish long-term price targets for gold. According to J.P. Morgan's commodity research, the structural case for gold remains compelling through 2026 and beyond:
| Institution | 2026 Target (End-Year) | 2027 Projection | Key Assumption |
|---|---|---|---|
| J.P. Morgan | ~$6,000/oz (Q4 2026) | ~$6,300/oz | Easing cycle, central bank demand |
| Goldman Sachs | ~$5,400/oz | Not specified | Fed pivot, weaker USD |
| Near-term technical fair value | ~$3,952/oz | Not applicable | Regression-based trend modelling |
Why the Gap Between Near-Term Technical Levels and Long-Term Forecasts Is So Wide
The divergence between near-term technical models pointing toward $3,952 and institutional end-year targets above $5,400 reflects the fundamental tension between cyclical positioning and structural demand. Technical models are inherently backward-looking, extrapolating from observed price behaviour. Institutional forecasts, by contrast, embed assumptions about policy reversals, central bank accumulation trends, and geopolitical risk premiums that do not yet fully appear in price data.
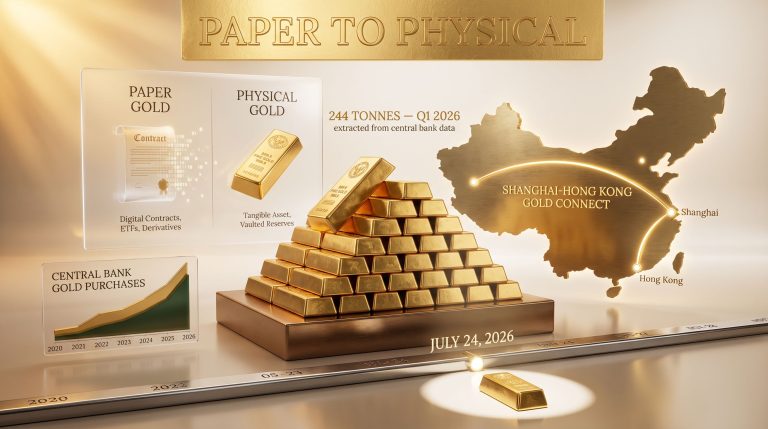
Central Bank Accumulation as the Structural Underpinning Behind Bullish Targets
One of the most consequential shifts in the gold market over the past several years has been the sustained increase in central bank gold demand, particularly from emerging market reserve managers seeking to reduce exposure to US dollar assets. This structural demand floor distinguishes the current cycle from earlier corrections and provides an economic justification for the wide gap between near-term technical weakness and long-term bullish institutional targets.
How Does a Fed Rate Hike Directly Impact Gold Prices? A Scenario Framework
Understanding the gold price forecast and Fed rate hike impact requires thinking in scenarios rather than single-path projections. Three distinct paths present themselves heading into the second half of 2026:
Scenario 1: Continued Fed Tightening ("Higher for Longer")
- Expected gold impact: Near-term bearish pressure
- Mechanism: Rising real yields increase the opportunity cost of non-yielding bullion; a stronger USD compresses dollar-denominated gold prices
- Key risk: Inflation remaining elevated while the Fed tightens creates a contradictory environment where gold faces headwinds despite a broadly bullish macro backdrop
Scenario 2: Fed Pause or Pivot to Rate Cuts
- Expected gold impact: Materially bullish
- Mechanism: Falling real rates reduce yield competition from bonds; dollar softening makes gold cheaper in non-USD terms, lifting global demand
- Historical precedent: When the Federal Reserve announced a major expansion of its money supply in March 2009, gold gapped higher by approximately +5.9% in a single session, demonstrating the asymmetric upside potential from unexpected policy pivots
Scenario 3: Inflation Persists but Fed Signals a Ceiling on Hikes
- Expected gold impact: Mixed to moderately bullish
- Mechanism: Persistent inflation supports gold as a purchasing power hedge, while rate ceiling signals reduce the urgency of defensive positioning
What Macro Signals Should Gold Investors Be Watching Right Now?
The Role of PCE, CPI, and PPI in Shaping the Next Fed Decision
With both the Consumer Price Index and Producer Price Index running materially above the Federal Reserve's 2.0% annualised target, the May Personal Consumption Expenditures release carries outsized significance as the final major inflation data point before the anticipated late-July Federal Open Market Committee rate decision. A reading that exceeds expectations would reinforce the case for a rate increase toward 4%, applying additional near-term pressure on gold prices.
Why the July 2026 FOMC Meeting Could Be a Pivotal Catalyst for Gold
The late-July FOMC meeting represents the most concentrated near-term risk event for precious metals positioning. Analysis of the current rate environment suggests the committee may vote, potentially not unanimously, to raise the federal funds target range toward 4%. The precise wording of accompanying forward guidance could matter as much as the rate decision itself, since markets will be parsing every signal for evidence of whether this represents a final hike or the beginning of a sustained new tightening phase.
Geopolitical Wildcards: Energy Market Disruptions and Their Inflationary Feedback Loop
Energy market disruptions carry a dual inflationary mechanism that gold investors should monitor closely. Elevated oil prices flow directly into transportation, manufacturing, and food production costs, pushing headline inflation higher and complicating the Fed's calculus on rate decisions. As of mid-June 2026, renewed tensions affecting the Strait of Hormuz have reintroduced supply-side inflation risks that could influence both PCE data and subsequent Fed deliberations.
In addition, gold as a safe haven becomes increasingly relevant during such geopolitical disruptions, as investors seek assets that preserve purchasing power amid heightened uncertainty.
S&P 500 Valuation Risk and Its Indirect Effect on Safe-Haven Gold Demand
The US equity market's current valuation presents a meaningful systemic risk variable for gold positioning:
- Current S&P 500 price-to-earnings ratio: approximately 48.5x, a historically elevated level
- A projected -10% equity correction into the 6,800s range would redirect capital flows toward defensive assets including gold
- Across a comprehensive basket of major financial markets covering bonds, currencies, commodities, and equities, directional trend signals have become unusually sparse, with trend-following models generating only one clear buy or sell signal across a 36-trading-day window that would normally produce approximately four such signals
When directional clarity evaporates simultaneously across multiple asset classes, it has historically preceded periods of sharper repricing rather than smooth trend continuation. This environment of low signal frequency warrants elevated caution.
The next major ASX story will hit our subscribers first
Is the Current Gold Correction a Buying Opportunity or a Warning Sign?
Reading the Technical Evidence: What Trend Regression Models Are Signalling
The 21-day linear regression trend consistency framework, which measures trend coherence across major financial markets, has deteriorated meaningfully through mid-2026. Rather than generating the expected frequency of directional signals, the model has been producing wandering readings that fail to confirm sustained momentum in either direction across bonds, currencies, commodities, and equities. This cross-market confusion is itself an informational signal, suggesting that the market environment preceding a significant repricing event may be developing.
The Bear Market Threshold: How Close Is Gold to Formal Correction Classification?
With gold having declined more than -25% from its January 2026 all-time high, the metal sits in close proximity to the conventional bear market classification threshold. Financial media has begun acknowledging this proximity, though market analysts tracking gold's structural drivers have been flagging the technical deterioration since February 2026. Whether this constitutes a bear market or an extended consolidation phase within a longer secular bull cycle depends significantly on the analytical framework applied and the timeframe considered.
Historical Parallels: What Past Gold Drawdowns Reveal About Recovery Timelines
Gold's history is punctuated by corrective phases that appeared technically decisive at the time but were subsequently absorbed within longer-term bull trends. The 2008 correction, the 2011-2015 bear market, and the 2020 consolidation each produced periods of sustained negative technical signals before producing sharp reversals, often triggered by specific monetary policy events rather than gradual fundamental improvements. Investors who exited positions during these consolidation phases frequently missed the asymmetric repricing episodes that followed.
Silver's Parallel Decline: A Supporting Data Point for Precious Metals Analysis
Silver's 2026 Drawdown: From Record High to a -46.7% Decline
Silver's corrective trajectory in 2026 has been considerably more severe than gold's on a percentage basis, reflecting the metal's historically higher beta to precious metals sentiment.
Silver reached a record high of approximately $121.79/oz on 29 January 2026 before entering an extended parabolic downtrend spanning 20 consecutive weeks by mid-June 2026. At approximately $64.91/oz, the decline of -46.7% from the peak dramatically outpaces gold's correction, underscoring the amplified volatility characteristics that distinguish silver from its more monetarily oriented counterpart.
Gold-to-Silver Ratio as a Market Stress Indicator
The gold-silver ratio analysis functions as a barometer of precious metals market stress and relative investor preference. When the ratio rises sharply, as it has through mid-2026, it typically reflects a flight toward gold's monetary characteristics at the expense of silver's industrial demand component. Historically, extreme ratio levels have preceded periods of silver outperformance, though the timing of such reversals is notoriously difficult to predict.
What Silver's Underperformance Tells Us About Industrial Demand vs. Monetary Demand
Silver occupies an unusual position in commodity markets, serving simultaneously as a monetary metal and an industrial input with significant applications in solar panel manufacturing, electronics, and medical equipment. During risk-off periods, silver tends to underperform gold because its industrial demand component softens in tandem with broader economic uncertainty. The current magnitude of silver's underperformance relative to gold suggests markets are pricing in meaningful industrial demand concerns alongside the monetary metals correction.
Long-Term Gold Performance: The Century-to-Date Case for Precious Metals
Gold vs. Equities: A Multi-Decade Return Comparison
The long-term performance context for gold places the current correction in a strikingly different light when viewed against alternative asset classes:
| Asset | Approximate Century-to-Date Return (2000-2026) |
|---|---|
| Gold | +1,424% |
| Silver | +1,299% |
| S&P 500 (including dividends) | +631% |
| S&P 500 (ex-dividends) | +468% |
Gold's century-to-date return of +1,424% represents more than double the total return of the S&P 500 including dividend reinvestment over the same period, a comparison that frequently surprises investors conditioned to view equities as the default long-term wealth accumulation vehicle.
Why Long-Term Structural Outperformance Persists Despite Cyclical Corrections
The structural case for gold's long-term outperformance rests on several interconnected factors that do not diminish during cyclical corrections:
- Monetary debasement – Persistent expansion of global money supply reduces the real purchasing power of fiat currencies over extended periods
- Fiscal deterioration – Sovereign debt levels across major economies have reached levels that structurally constrain governments' ability to tighten monetary conditions without risking financial system stress
- Dedollarisation trends – A growing share of global trade and reserve management is occurring outside the US dollar system, supporting alternative stores of value
- Supply constraints – Gold mining faces persistent challenges in replacing depleted reserves, maintaining a long-term supply discipline that supports structural price appreciation
The Role of Monetary Expansion and Fiscal Stress in Gold's Secular Bull Case
The relationship between government balance sheet expansion and gold prices represents one of the most durable macroeconomic relationships in modern financial history. When sovereign fiscal positions deteriorate to levels that create pressure on central banks to monetise debt, gold historically responds with sustained appreciation. The current trajectory of US federal debt, combined with structural deficit dynamics, provides a long-term fundamental backdrop that persists independently of near-term technical weakness.
What Could Trigger Gold's Next Major Upside Move?
Treasury Market Stress and the Federal Reserve's Role as a Fiscal Backstop
One of the more consequential but underappreciated dynamics in the current macro environment is the potential for Treasury market dysfunction to force a Fed policy reversal. When sovereign debt levels reach a point where rising interest rates create a self-reinforcing fiscal crisis, central banks face a binary choice between maintaining anti-inflationary credibility and preventing a debt spiral. Gold's historical response to episodes of central bank balance sheet expansion has been both rapid and substantial.
How a Shift in Fed Leadership Philosophy Could Reshape the Gold Price Trajectory
Changes in Federal Reserve leadership philosophy carry significant implications for the gold price forecast and Fed rate hike impact calculations. A Fed chair who prioritises Treasury market stability over inflation containment would represent a material shift in the policy function, creating the conditions for the kind of event-driven gold repricing that has historically produced the metal's largest single-session gains. This speculative scenario, while not a consensus expectation, warrants inclusion in any comprehensive risk framework for precious metals positioning.
Central Bank Demand, Dedollarisation, and the Structural Bid Beneath Gold Prices
The structural bid provided by central bank accumulation operates with a different logic than speculative or investment demand. Reserve managers are not sensitive to short-term price volatility in the same way that hedge funds or retail investors are. Their accumulation targets are driven by diversification mandates and geopolitical considerations, providing a demand floor that becomes particularly visible during corrective phases when speculative positioning is being reduced.
History consistently demonstrates that gold's most powerful and rapid upside moves are event-driven rather than gradual. They emerge from sudden policy reversals, financial system stress events, or unexpected monetary interventions. Investors who liquidate positions during technically challenging consolidation phases risk missing precisely these asymmetric repricing episodes.
FAQ: Gold Price Forecast and Fed Rate Hike Impact
Will Gold Go Up if the Fed Raises Rates in July 2026?
A rate hike at the late-July meeting would likely create short-term headwinds, particularly if accompanied by hawkish forward guidance. However, if the decision is perceived as the final move in the tightening cycle, markets may look through the immediate impact and begin pricing in a subsequent easing trajectory, which would be constructive for gold over a medium-term horizon.
What Is the Gold Price Forecast for the End of 2026?
Institutional forecasts span a considerable range. The most bullish projections from major investment banks target the $5,400 to $6,000/oz range by Q4 2026, contingent on a Fed policy pivot or pause. Near-term technical models suggest a potential retest of the $3,952 fair value zone before any sustained recovery materialises.
How Does Inflation Affect the Gold Price Forecast?
Persistently high inflation is structurally bullish for gold as a purchasing power preservation asset. However, if the Fed responds aggressively with rate hikes that push real yields higher, gold can face temporary suppression even in an inflationary environment. The net directional effect depends on whether real interest rates, after accounting for inflation, are rising or falling.
Is Gold in a Bear Market in 2026?
A decline exceeding -25% from the January 2026 all-time high places gold in close proximity to the conventional bear market threshold. Whether this represents a bear market or an extended consolidation within a longer secular bull cycle depends on the analytical timeframe and framework applied. The structural drivers underpinning the multi-year bull thesis, including central bank demand, fiscal deficits, and geopolitical risk premiums, remain intact.
What Is the Relationship Between the US Dollar and Gold Prices?
Gold and the US dollar typically exhibit an inverse relationship. Fed rate hikes that strengthen the dollar create pricing pressure on gold by making it more expensive for international buyers. Consequently, dollar weakness associated with rate cuts or fiscal deterioration tends to support gold by reducing the relative attractiveness of USD-denominated assets and lowering the effective cost of gold in foreign currency terms.
Key Takeaways: Gold Price Forecast and Fed Rate Hike Scenarios Summarised
- Gold entered mid-2026 in a technically negative near-term posture following a -25.3% drawdown from its January all-time high of approximately $5,586/oz
- The late-July 2026 FOMC decision, and the May PCE inflation data release preceding it, represent the most significant near-term catalysts for determining gold's directional path
- Institutional long-term price targets remain materially bullish at $5,400 to $6,000/oz by end-2026, contingent on Fed policy evolution
- Silver's more severe correction of -46.7% from its own record high and the S&P 500's stretched valuation near 48.5x earnings add complexity to the broader market environment
- Cross-market trend signal frequency has declined to historically anomalous levels, suggesting a period of sharper repricing rather than smooth directional continuation may be approaching
- Gold's century-to-date return of +1,424% substantially outperforms the S&P 500's total return of +631% including dividends, contextualising the current correction within a longer-term structural outperformance narrative
- Event-driven policy reversals remain the primary catalyst for gold's historically largest single-session moves, making sustained short positioning a high-risk strategy in the current environment
This article is intended for informational and educational purposes only and does not constitute financial advice. All price forecasts, institutional projections, and scenario analyses involve significant uncertainty and should not be relied upon as the basis for investment decisions. Past performance of any asset class is not indicative of future results. Readers should consult a licensed financial adviser before making any investment decisions.
Readers seeking additional perspectives on gold market analysis and Federal Reserve policy impacts can explore commentary published at Gold-Eagle.com, which regularly features independent market analysis from financial professionals covering precious metals and macroeconomic trends.
Want to Know Which ASX Miners Could Benefit From the Next Gold Price Surge?
Discovery Alert's proprietary Discovery IQ model delivers real-time alerts the moment significant ASX mineral discoveries hit the market, instantly transforming complex geological data into actionable investment insights — so subscribers are positioned ahead of the broader market before price-moving opportunities pass. Explore historic mineral discovery returns that demonstrate the extraordinary upside potential these moments can generate, and begin your 14-day free trial at Discovery Alert to secure your market-leading edge.