June 24, 2026

The Psychology of Capitulation: Why Late-Stage Corrections Create the Most Asymmetric Opportunities in Gold
There is a peculiar irony embedded in precious metals markets: the moments that feel the most dangerous to investors are frequently the ones that carry the greatest long-term reward. Capitulation phases are defined not by what prices are doing, but by what market participants believe prices will do next. When bearish consensus reaches extremes, when every headline reinforces the downtrend, and when even long-term bulls begin to question their thesis, the structural conditions for a major reversal are quietly assembling beneath the surface.
This is precisely the environment shaping the gold price forecast final washout thesis that technical analysts are building a strong case around as mid-2026 approaches. Understanding why this moment matters requires looking beyond today's price tick and examining the cyclical architecture that governs how gold bull markets actually function across multi-year timeframes.
When big ASX news breaks, our subscribers know first
Why Intermediate Cycle Lows Define Long-Term Returns in Gold Bull Markets
Most investors track gold on a daily or weekly basis, reacting to each price swing as though it carries independent significance. In reality, the most important structural events in a gold bull market are the intermediate cycle lows, recurring correction phases that shake out speculative positions, reset sentiment to bearish extremes, and create the compressed coil from which the next major advance launches.
These intermediate corrections typically unfold across three distinct stages:
- Initial retracement – the first leg lower following a cycle peak, often dismissed as a healthy pullback
- Consolidation and false recovery – a period of choppy, sideways-to-lower price action that erodes conviction
- Final capitulation (the washout) – an accelerated decline into the target support zone accompanied by peak bearish sentiment and extreme oversold readings
The critical distinction investors must internalise is that a final washout within a confirmed bull market is structurally different from a trend reversal. Bull markets do not die during periods of maximum pessimism; they die during periods of maximum optimism. The current environment, characterised by deeply negative sentiment and compressed cycle indicators, more closely resembles the former than the latter.
The Gold Cycle Indicator: Reading the Signal Through the Noise
One of the more precise tools used to track gold's cyclical positioning is the Gold Cycle Indicator, a technical measure that synthesises price momentum, breadth, and sentiment data into a single oscillator. When this indicator registers at extreme lows, it has historically coincided with conditions that precede significant multi-month recoveries.
As of late June 2026, the Gold Cycle Indicator registered at 37, marking the most deeply oversold reading since October 2023. That prior extreme, it is worth noting, preceded a substantial recovery phase across the entire precious metals complex. Comparable oversold extremes in earlier cycles similarly resolved with meaningful rallies developing over the subsequent three to six months.
Equally striking is the state of the gold miners' bullish percent index, which collapsed to approximately 3.7%. A reading this low, deep in single-digit territory, reflects a market where nearly all technical signals across individual mining stocks have flipped negative simultaneously. Historically, such readings are not indicators of further structural collapse; they are the footprint of exhaustion selling, the final phase where remaining weak holders liquidate into the hands of patient, longer-horizon capital.
The rarity of sub-5% bullish percent readings in gold miners is worth contextualising: across the prior decade of data, such extremes have marked, or come within weeks of marking, significant intermediate cycle lows in the precious metals sector.
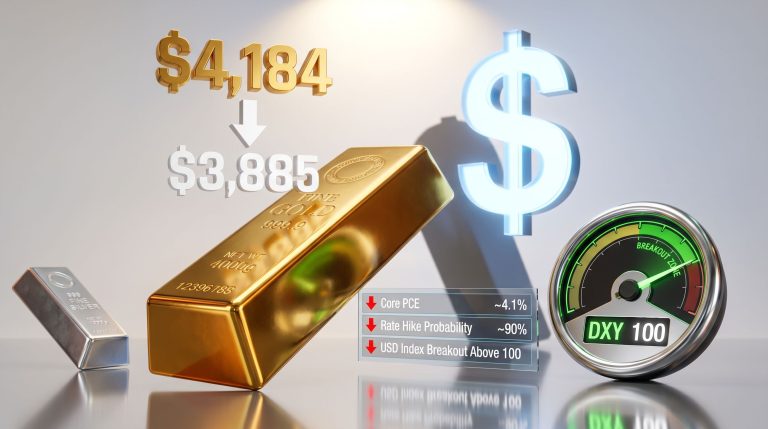
The U.S. Dollar's Grip on the Current Correction
The mechanical relationship between the U.S. dollar and gold pricing is one of the most durable dynamics in financial markets. Because gold is globally priced in dollars, a stronger dollar raises the effective cost of gold for international buyers, compressing demand and applying consistent downward price pressure. This relationship does not require a fundamental shift in gold's underlying value; it is a translation effect amplified by leveraged positioning.
Following the most recent Federal Reserve meeting, the dollar moved decisively above the 101 level, establishing what technical analysts interpret as a bullish breakout structure. If this momentum extends, the next logical targets are the 103 to 105 range on the dollar index. A dollar advance into that zone would maintain downward pressure on precious metals through the near term.
The table below maps the key scenarios linking dollar behaviour to gold's probable trajectory:
| Scenario | USD Level | Gold Implication | Critical Threshold |
|---|---|---|---|
| Dollar extends rally | 103-105 | Continued downside pressure | Gold must hold $3,900 |
| Dollar stabilises near 101 | ~101 | Bottoming process develops | Monitor for reversal signals |
| Dollar reverses below 101 | Sub-101 | Bullish catalyst for metals | Confirms intermediate low |
| Extended bear scenario | N/A | Deeper correction possible | Gold breaks $3,900 toward $3,500 |
The single most important macro variable for precious metals traders through mid-July 2026 is whether the dollar can sustain above 101. A failure to hold that level and a reversal back below it would invalidate the short-term bearish metals thesis and likely accelerate the bottoming process across gold, silver, and mining equities.
What makes dollar rallies within gold bull markets particularly interesting from a longer-cycle perspective is their tendency to be self-limiting. USD strength episodes above multi-year resistance levels have historically faced increasing headwinds from trade dynamics, Federal Reserve rate trajectory shifts, and capital flow reversals. The current episode may follow a similar pattern, particularly if rate cut expectations begin to be repriced into markets later in 2026. Furthermore, the gold safe-haven role becomes increasingly relevant when dollar strength eventually fades and investors rotate back into hard assets.
Where Every Major Precious Metal and Mining Sector ETF Stands Right Now
Gold: $4,000 Is the Line in the Sand
Gold's current price action is testing the boundaries of its mid-year technical target zone. The base case supported by cycle analysis is that a meaningful bottom is forming between late June and mid-July 2026, with a possible brief test of, or dip below, the $4,000 psychological support level. The correction that originated in January 2026 is estimated to be approximately 90% complete based on cycle and wave structure analysis.
The alternate scenario, which carries lower probability but cannot be dismissed, requires a sustained close below $3,900 as its trigger. A decisive breakdown at that level would open the path toward the $3,500 area, which represents the next significant structural support zone. Investors should treat $3,900 as the primary risk management threshold for near-term positioning. A broader gold price forecast for the medium term, however, remains firmly bullish once this washout phase concludes.
Silver: Approaching the Final Support Window
Silver's correction trajectory since January has brought prices into the vicinity of the $55.00 support level, which technical analysis identifies as the primary floor for the current cycle. The deepest plausible extension of this correction, under a scenario where $55.00 fails to contain the decline, would be a retest of the prior breakout zone near $50.00.
Silver's high-beta characteristics relative to gold mean that during the recovery phase, silver typically amplifies gold's gains. The gold-silver ratio, currently elevated compared to historical norms, implies that meaningful mean reversion during a metals bull market acceleration phase could generate outsized returns for silver holders.
Platinum: Filling the Gap Below $1,600
Platinum's correction has produced a slightly lower low relative to prior cycle troughs, with price action now filling the gap structure just below $1,600. Strong structural support is identified near $1,500, which technical analysis suggests should represent the floor for the current correction cycle. Platinum's recovery dynamics are closely correlated with broader precious metals sentiment, making its bottoming process interdependent with gold's stabilisation.
Mining Stocks: GDX, GDXJ, and SILJ at Critical Junctures
The major mining equity ETFs have each reached significant technical milestones. In addition, gold and mining equities have historically tended to bottom in sequence, with seniors leading juniors in the early recovery phase:
- GDX (Senior Miners): The gap near $80.00 has been decisively closed, completing an important technical objective. From this point, gold holding $4,000 is the critical dependency for maintaining a floor near $72.00 in GDX. A breakdown in gold below $4,000 would create additional pressure on senior miner valuations.
- GDXJ (Junior Miners): Junior miners have entered the technical target zone with a stabilisation window expected between late June and mid-July 2026. Historically, junior miner price action at major cycle lows has tended to lead senior miners into the recovery phase, making GDXJ price behaviour a useful forward indicator.
- SILJ (Silver Junior Miners): SILJ has dipped into the upper boundary of the target zone. The anticipated bottom range is the mid-to-low $20s, with the correction from January considered to be nearing its terminal stage. Silver junior miners represent the highest-beta expression of the precious metals recovery thesis within the listed equity universe.
The S&P 500 Wildcard: How Equity Turbulence Could Briefly Extend the Metals Correction
One underappreciated risk factor in the current gold price forecast final washout analysis is the potential for a broader equity market correction to temporarily push precious metals below their target support zones. The S&P 500's close below the 7,394 price gap signals trend exhaustion at the index level. A decisive break below the June low of 7,237 would open the path toward the 200-day moving average and could trigger a risk-off environment affecting multiple asset classes simultaneously.
If the S&P 500 breaks decisively below its June 2026 low, a secondary risk-off wave could temporarily push precious metals below current target zones. This would not invalidate the long-term bull market thesis but may require recalibrating near-term support levels into July.
The important nuance here is the distinction between liquidity-driven selling and fundamental deterioration. During the early phase of a sharp equity selloff, gold and mining stocks sometimes decline alongside equities as leveraged investors raise cash by selling liquid assets across the board. This correlation is typically short-lived. Historical patterns show that gold tends to recover significantly faster than equities following joint selloffs, as safe-haven demand reasserts itself once the initial liquidation wave passes.
What Major Institutional Forecasts Say About Gold's Multi-Year Trajectory
The divergence in institutional gold price forecasts for 2026 and beyond reflects fundamentally different assumptions about Federal Reserve policy rather than disagreement about gold's structural bull market status. For instance, J.P. Morgan's commodities research presents a considerably more bullish outlook than several of its peers, as reflected in the table below.
| Institution | 2026 Target | 2027 Target | Key Assumption |
|---|---|---|---|
| J.P. Morgan | $6,000/oz (Q4 avg) | $6,300/oz | Continued monetary easing cycle |
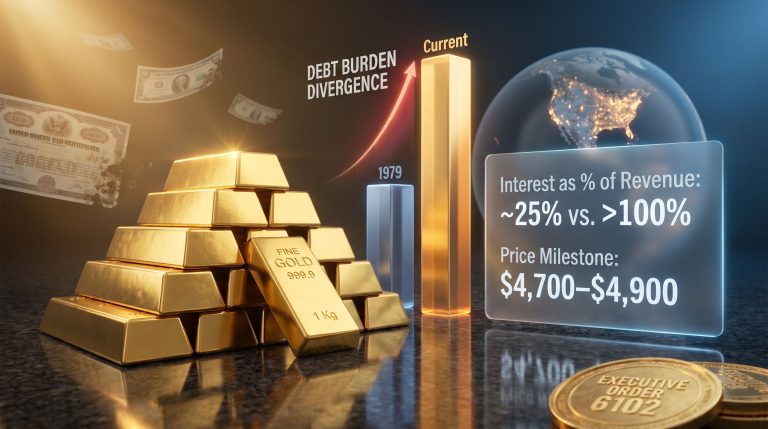
| Goldman Sachs | $4,900/oz | Not specified | Fed holds rates through 2026 |
| World Gold Council | +5% to +15% (base case) | +15% to +30% (stress case) | Economic slowdown scenario |
Goldman Sachs' revised target of $4,900/oz incorporates a scenario where the Federal Reserve does not deliver rate cuts in 2026, limiting the monetary tailwind for gold. J.P. Morgan's more aggressive $6,000/oz target assumes that monetary easing continues and sustained safe-haven demand persists across central bank and institutional channels.
The World Gold Council's scenario framework is particularly useful for contextualising the current correction. Under its shallow slip base case, an economic slowdown accompanied by falling rates is expected to drive a 5% to 15% price increase from current levels. Under a more severe downturn or major geopolitical shock scenario, the Council's stress case anticipates a 15% to 30% surge. The mid-year correction fits within the natural volatility range that precedes both of these outcomes.
The next major ASX story will hit our subscribers first
The Long Horizon: $10,000 Gold and $300 Silver by 2030
Technical analysis of gold's secular bull market structure, combined with fundamental drivers including monetary debasement, sovereign debt trajectory, and central bank gold demand, supports price targets that most mainstream commentary treats as implausible. A registered CMT practitioner and technical analysis specialist covering the precious metals complex has noted that gold is expected to exceed $10,000 per ounce and silver to reach above $300 by 2030, with the current intermediate correction viewed as a temporary consolidation within a much larger multi-year advance.
The structural case for these targets rests on several converging forces:
- Monetary debasement: Global money supply expansion since 2020 has created a long-duration tailwind for hard assets that has not yet been fully priced into gold
- Central bank accumulation: Emerging market central banks, led by China, India, and several Middle Eastern sovereigns, have been consistent buyers at levels not seen since the post-Bretton Woods era
- Sovereign debt dynamics: Debt-to-GDP ratios across major economies are at historically elevated levels, reinforcing the case for gold as a reserve asset outside the conventional credit system
- Industrial and monetary silver demand: Silver's dual role as both a monetary metal and a critical industrial input for solar panels, electric vehicles, and advanced electronics creates a demand profile that diverges favourably from pure monetary metals
The gold-to-silver ratio's current elevation relative to historical norms implies that if gold advances toward $10,000, silver's reversion to more historically typical ratios would place it well above $300. This is not a fringe calculation; it follows directly from the mechanical relationship between the two metals that has held across multiple bull and bear cycles. Furthermore, FX Street's commodities analysis provides additional context on how these ratio dynamics have historically played out during extended precious metals bull runs.
Key Support Levels and Risk Thresholds: A Complete Reference Table
| Asset | Current Support | Critical Breakdown Level | Long-Term Bull Case |
|---|---|---|---|
| Gold | ~$4,000 | $3,900 | $6,000 near-term / $10,000+ by 2030 |
| Silver | ~$55.00 | $50.00 | $300 by 2030 |
| Platinum | ~$1,600 gap fill | $1,500 | Recovery aligned with gold |
| GDX | ~$72.00 floor | Below $72 | Tracks gold recovery |
| GDXJ | Target zone entry | Sub-target zone | Mid-July reversal expected |
| SILJ | Upper target zone | Mid-to-low $20s | High-beta silver recovery |
Frequently Asked Questions: Gold Price Forecast and the Final Washout
What exactly is a final washout in gold market analysis?
A final washout is the terminal phase of an intermediate price correction, characterised by accelerating selling pressure, extreme bearish sentiment readings, and price compression into pre-mapped support zones. It is typically the point where remaining speculative longs capitulate, supply is absorbed by longer-horizon buyers, and the conditions for a sustained recovery are established.
How low could gold fall before the correction concludes?
The primary support level is near $4,000, with a brief test possible. A sustained close below $3,900 would activate the alternate downside scenario targeting the $3,500 zone. Technical analysis places the probability of the alternate scenario at significantly lower odds than the base case bottoming scenario. The gold price forecast final washout thesis holds that the base case resolution remains to the upside once this zone is fully tested.
Why do mining stocks sometimes lead gold at cycle lows?
Junior miners, in particular, have historically exhibited leading behaviour at major cycle lows because they are the first assets to attract speculative capital when sentiment begins to shift. Their higher volatility, which amplifies losses during corrections, similarly amplifies early-stage gains during recoveries, making their price reversal a forward signal for the broader sector.
Does a potential S&P 500 correction invalidate the gold bull market case?
Not structurally. While a short-term risk-off event could push metals temporarily below their current target zones, the historical pattern of gold recovering faster than equities following joint selloffs remains relevant. The long-term bull market thesis for gold does not depend on equity market performance; it rests on monetary, geopolitical, and structural demand foundations that operate independently. Consequently, the gold price forecast final washout framework treats any equity-driven dip as a potential secondary entry opportunity rather than a structural threat.
Disclaimer: This article is for informational and educational purposes only and does not constitute financial advice or an investment recommendation. Price forecasts, cycle analysis, and technical targets discussed herein involve significant uncertainty and speculation. Past performance of technical indicators is not a guarantee of future results. Investors should conduct their own due diligence and consult a qualified financial advisor before making investment decisions. All price levels and institutional forecasts cited are based on publicly available information as of the publication date and are subject to change.
Want to Position Yourself Ahead of the Next Major Precious Metals Discovery?
Whilst cycle analysis and technical forecasting help identify when gold markets may be turning, Discovery Alert's proprietary Discovery IQ model ensures subscribers receive real-time notifications the moment significant ASX mineral discoveries are announced — converting complex data across 30+ commodities into clear, actionable insights for both short-term traders and long-term investors. Explore historic discoveries and their exceptional returns, then begin your 14-day free trial to secure a market-leading edge at the precise moment the next major discovery hits the ASX.