June 24, 2026
The Rate Channel Always Wins: Why Monetary Policy, Not Geopolitics, Is Crushing Gold
Precious metals investors have a deeply ingrained instinct: when the world feels dangerous, buy gold. It is a heuristic built from decades of market experience, and it contains a kernel of truth. However, that kernel can become dangerous when applied without nuance, particularly when the dominant force driving price action is not geopolitical anxiety but the relentless machinery of monetary policy transmission. The gold decline from a hawkish Fed and stronger dollar unfolding in mid-2026 is a masterclass in how the rate channel, not the headlines, determines the metal's direction.
Understanding why gold is falling requires dismantling a widespread narrative and replacing it with a more accurate framework. The answer is not in any conflict zone. It is in the Federal Reserve's dot plot, the U.S. Dollar Index chart, and the Personal Consumption Expenditures data due Thursday.
When big ASX news breaks, our subscribers know first
Three Interlocking Forces Compressing Gold Simultaneously
The current selloff is not the product of panic or a single catalyst. It reflects a structural configuration that has been building for months, with three mutually reinforcing mechanisms pressing gold lower in concert:
- Inflation persistence keeping the Federal Reserve biased toward additional rate increases rather than easing
- Hawkish FOMC positioning elevating the opportunity cost of holding non-yielding assets like gold
- Dollar strength reducing gold's purchasing power appeal for international buyers and functioning as a competing safe-haven asset
This three-stage compression model operates sequentially and self-reinforces. Elevated inflation anchors the Fed's hawkish stance. A hawkish Fed lifts the dollar. A stronger dollar presses gold lower. Each stage amplifies the next, creating a structural headwind that narrative-driven buying cannot overcome. Furthermore, understanding the gold and bonds dynamics at play helps clarify why fixed-income alternatives become increasingly attractive as this cycle progresses.
| Stage | Mechanism | Market Impact |
|---|---|---|
| 1. Inflation Rises | Core PCE climbs toward 4.1% from 3.8% | Fed signals rate action |
| 2. Fed Turns Hawkish | 9 of 19 FOMC members favour hikes | Dollar strengthens |
| 3. Dollar Rallies | USD Index breaks above 100 | Gold price compressed |
How the FOMC's Hawkish Pivot Has Repriced Rate Expectations
The Federal Open Market Committee's most recent meeting produced no change in the policy rate itself, but the accompanying signals were unambiguously hawkish. Nine of the nineteen FOMC members indicated they anticipate at least one additional rate increase before year-end. Under Fed Chair Kevin Warsh, the committee's communication has shifted decisively toward prioritising inflation control over growth accommodation.
The market has responded with striking speed. Rate hike probability has repriced dramatically within a single week:
- One week prior: approximately 57% probability of a year-end rate hike
- Current market pricing: approximately 90% probability of a rate hike before year-end
- Deutsche Bank and Bank of America both project a hike as early as September 2026
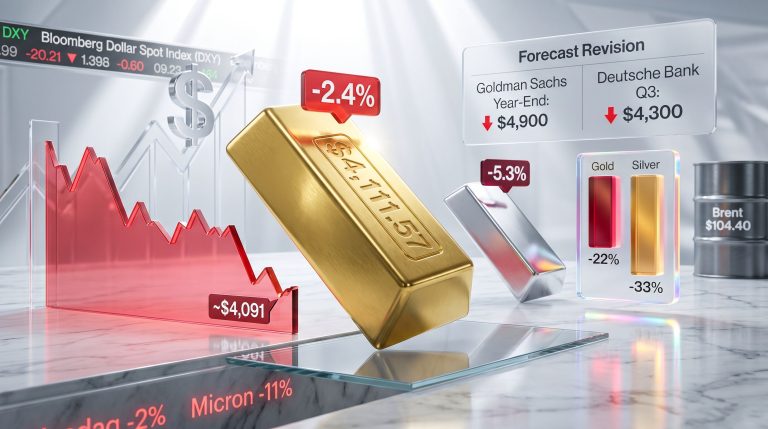
This repricing is not a minor adjustment. Moving from 57% to 90% in one week represents a wholesale revision of market expectations and has direct, immediate consequences for gold. When the opportunity cost of holding a non-yielding asset rises this sharply, capital rotates toward interest-bearing instruments, and gold absorbs the outflows.
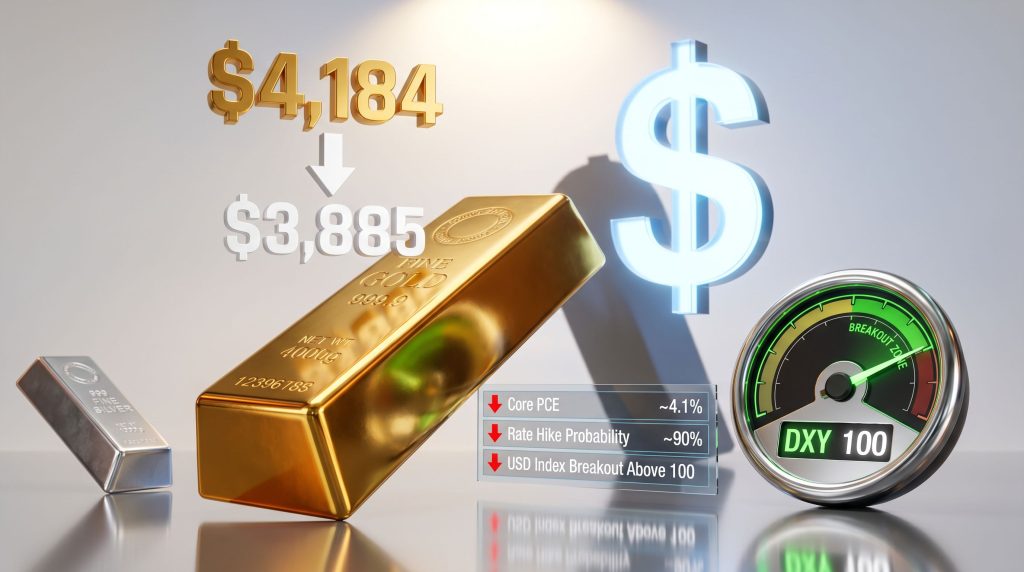
The inflation data underpinning this shift is equally significant. The Fed's preferred gauge, the Personal Consumption Expenditures index, is expected to print at approximately 4.1%, up from the prior reading of 3.8%. That upward trajectory validates the Fed's reluctance to pivot and signals a prolonged period of restrictive policy ahead. Consequently, the gold price forecast for coming months has grown considerably more cautious among major institutional analysts.
Elevated PCE data is not merely a backward-looking indicator. It functions as the fundamental anchor keeping the Fed's foot near the rate-hike accelerator, and by extension, keeping the structural headwind on gold firmly in place.
The Dollar Breakout Above 100: A Technically Significant Threshold
The U.S. Dollar Index has confirmed a breakout above the psychologically and technically significant level of 100, reaching its highest reading in more than a year. This development carries consequences that extend well beyond simple chart analysis. According to reporting from the Wall Street Journal, hawkish Fed signals have clearly outweighed geopolitical relief factors in driving gold lower.
The inverse relationship between the dollar and gold operates through two distinct channels:
- Purchasing power channel: A stronger dollar makes gold more expensive in local currency terms for buyers outside the United States, structurally reducing international demand
- Safe haven substitution channel: A rising dollar itself functions as a risk-off destination, partially displacing gold's traditional defensive role in global portfolios
What makes the current breakout analytically distinctive is its context. The base formation that preceded this move took longer to develop than comparable bottoms observed since 2008. Historical precedent across multiple dollar cycles suggests that when broader, longer-duration bases resolve to the upside, the subsequent rallies tend to be both sharper and more sustained than those following shorter consolidation periods.
| USD Index Level | Significance | Gold Implication |
|---|---|---|
| Below 100 | Previous resistance zone | Neutral to bullish for gold |
| 100 (current breakout) | Major psychological and technical threshold | Bearish signal confirmed |
| 102 | Next resistance level | Unlikely to contain the rally for long |
| Above 102 | Multi-year high territory | Strongly bearish for gold |
Critically, previous highs at the 102 level carry far less technical significance than the 100 level that was just breached. The implication is that the rally in the dollar has more room to extend than conventional resistance analysis might suggest, which translates directly into sustained downward pressure on gold.
Gold Is Not a Safe Haven in Every Type of Selloff
One of the most persistent and costly misconceptions in precious metals investing is the assumption that gold automatically appreciates whenever equity markets decline. The current environment reveals the critical flaw in this generalisation.
Gold's safe-haven properties are context-dependent. The metal tends to appreciate during systemic financial crises involving credit market stress, currency debasement episodes, and sovereign debt concerns. It does not reliably appreciate during speculative unwinds where investors must raise cash across all asset classes simultaneously.
When gold acts as a safe haven:
- Systemic financial crises with credit market disruption
- Currency debasement and sovereign debt stress
- Institutional loss of confidence in fiat currency systems
When gold does NOT act as a safe haven:
- Dollar-strength-driven risk-off episodes where USD becomes the preferred refuge
- Speculative position unwinds requiring broad liquidity generation
- Margin call environments forcing liquidation of the most liquid holdings
The current selloff fits the second category precisely. Equities are cracking, led by the most speculative positions in the market. The AI trade is under severe pressure. Semiconductor stocks have declined sharply following guidance misses from sector bellwethers. The SpaceX listing, described as the largest in market history when it priced two weeks ago, has subsequently reversed course and shed more than $600 billion in market value over three consecutive sessions, slipping below its first-day opening price.
This is what the exhaustion phase of a speculative cycle tends to look like. It does not announce itself at the moment of peak enthusiasm. It reveals itself in the sessions after peak absorption, as liquidity drains and leveraged positions unwind across the risk spectrum, taking gold and silver down with them.
In this type of environment, precious metals are not a refuge. They function as a source of liquidity. The highest-beta names fall hardest, which explains why silver is declining at several multiples of gold's rate and why mining equities are underperforming both.
The Hierarchy of Losses in a Speculative Unwind
Understanding relative performance within the precious metals complex during this type of selloff is essential for portfolio positioning:
- Highest-beta speculative assets absorb the largest percentage declines
- Silver and junior mining equities decline significantly more than gold
- Gold declines but acts as the relative anchor within the precious metals complex
- USD and short-duration Treasuries typically appreciate as the true risk-off destinations
Silver's outsized decline relative to gold is not an anomaly. It is a textbook signal of a liquidity-driven risk-off event. In addition, monitoring the gold-silver ratio provides further confirmation of where we are in the speculative cycle. Investors should distinguish clearly between this dynamic and a fundamental repricing of precious metals before making allocation decisions.
Why Geopolitical De-Escalation Is Bearish for Gold in This Cycle
Here is an insight that runs counter to most retail investor intuition: the resolution of geopolitical tensions in the current macro environment is not a bullish development for gold. It is net bearish.
The clearest evidence for this counterintuitive conclusion is the price action that occurred during the active conflict period itself. Gold fell approximately 20% during the shooting war. If geopolitical risk were the primary price driver, the metal should have appreciated during that period. It did not, because the dominant forces were monetary policy and dollar dynamics, not conflict premiums.
The geopolitical situation retains genuine uncertainty. While negotiators reached a road map and inspectors were invited back, several fault lines remain unresolved. Iran's declaration regarding the Strait of Hormuz was subsequently walked back by its own foreign ministry. The Iranian president's statements on enrichment remain firm. Nuclear talks in Switzerland were postponed. Fighting in Lebanon has not ceased. The central route through the Strait is still reported to contain mines.
Despite this genuine ambiguity, the analytical framework points clearly in one direction:
| Geopolitical Outcome | Oil Impact | Inflation Impact | Fed Response | Gold Impact |
|---|---|---|---|---|
| Durable peace confirmed | Oil stabilises or falls | Inflation eases marginally | Still hawkish on labour and PCE | Neutral to slightly negative |
| Conflict re-escalates | Oil spikes | Inflation accelerates | More hawkish | Negative (rate pressure dominates) |
| Status quo uncertainty | Oil remains volatile | Inflation stays elevated | Hawkish bias maintained | Negative |
Meanwhile, Iran shipped more than 30 million barrels under a new export licence during this period. Oil kept flowing regardless of the headline uncertainty, and the metals kept declining. A period this geopolitically unsettled would have driven gold sharply higher if conflict were the operative variable. The fact that it did not demonstrates conclusively where the real price driver resides.
The next major ASX story will hit our subscribers first
The S&P 500 Technical Picture and Its Implications for Precious Metals
Equity market technical analysis is providing corroborating evidence that reinforces the bearish macro framework for gold. The S&P 500 futures approached and reversed from an upside target level near 7,650 with extraordinary precision, with the index topping within a marginal distance of that level before rolling over.
When combined with the SpaceX listing reversal, the pattern suggests a potential medium-term peak formation in broader equities. Lower equity markets historically translate into lower commodities, lower precious metals prices, and particularly severe drawdowns in mining equities.
Key equity market signals to monitor:
- Continued derisking from AI and semiconductor positions as guidance misses propagate through the sector
- The SpaceX listing's trajectory as a proxy for speculative cycle exhaustion
- S&P 500 ability or inability to reclaim the 7,650 level
- Credit market spreads as an early warning indicator for systemic stress
Technical Targets and What Investors Should Monitor for a Trend Reversal
The technical bias in gold has shifted from bullish to bearish following the breach of the metal's upward trendline. Current spot gold is trading near $4,184 to $4,189, with futures around $4,202 to $4,207. Technical analysis points toward a near-term support target in the vicinity of $3,885 per ounce, representing meaningful additional downside from current levels. As FX Street analysis notes, the hawkish Fed and strong dollar combination has now pushed gold to a third straight weekly decline.
Investors seeking evidence that the selloff may be approaching exhaustion should monitor the following indicators in sequence:
- Core PCE inflation declining toward the Fed's 2% target, which would reduce the probability of further rate hikes
- USD Index failing to sustain above 100, which would invalidate the technical breakout thesis
- FOMC communication shifting dovish, reducing the opportunity cost of holding gold
- Silver stabilising relative to gold, which historically signals that the speculative unwind phase is nearing completion
- Mining equity stabilisation, as junior and mid-tier miners often lead gold prices at inflection points
None of these conditions are present today. Furthermore, the broader question of recession and gold prices adds another layer of complexity, as a slowing economy may eventually shift the Fed's calculus but has not yet done so. Until meaningful signals begin to appear, the structural framework driving the gold decline from a hawkish Fed and stronger dollar remains fully intact. Similarly, the outlook for central bank gold demand bears watching, as any shift in institutional accumulation could provide a floor beneath prices even in a restrictive rate environment.
Disclaimer: This article is for informational and educational purposes only and does not constitute financial advice. Gold price targets and technical projections involve inherent uncertainty and should not be relied upon as the sole basis for investment decisions. Past technical patterns do not guarantee future price behaviour. Readers should consult a qualified financial adviser before making any investment decisions.
Frequently Asked Questions
Why is gold falling despite global uncertainty?
The current gold decline from a hawkish Fed and stronger dollar reflects monetary policy dominance over geopolitical factors. A Federal Reserve committed to rate increases, rising hike probabilities near 90%, and a dollar breaking out to multi-year highs collectively suppress gold more than geopolitical anxiety supports it. Non-yielding assets like gold are structurally disadvantaged when interest rates are rising or expected to rise.
Does a hawkish Fed always cause gold to fall?
Historically, hawkish Fed signals have been among the most reliable bearish catalysts for gold across multiple rate cycles. When the Fed signals higher rates, the dollar typically strengthens, bond yields rise, and capital rotates toward yield-bearing instruments, reducing demand for gold. The consistency of this relationship makes it the primary analytical framework for the current cycle.
Why is silver underperforming gold so sharply?
Silver carries a higher beta to both gold and equity markets due to its dual role as a precious and industrial metal. During dollar-strength-driven risk-off events, silver's price declines at a multiple of gold's rate. This is a structural characteristic reflecting silver's smaller market size, industrial demand sensitivity, and higher levels of speculative positioning. It signals a liquidity event rather than a fundamental divergence between the two metals.
What technical level matters most for gold right now?
The near-term technical support level that analysts are watching sits near $3,885 per ounce. Gold's breach of its upward trendline, combined with the confirmed USD Index breakout above 100, has shifted the technical bias from bullish to bearish and points toward that level as the next meaningful support zone. Above this level, spot gold is trading in the $4,184 to $4,189 range, with futures near $4,202 to $4,207.
Want to Know Which ASX Mineral Discoveries Could Outperform in Any Market Cycle?
While gold navigates headwinds from hawkish monetary policy and a strengthening dollar, significant mineral discoveries on the ASX continue to generate substantial returns independent of macro conditions — and Discovery Alert's proprietary Discovery IQ model delivers real-time alerts the moment these opportunities emerge, as demonstrated by historic discoveries like De Grey Mining and WA1 Resources. Explore Discovery Alert's dedicated discoveries page to understand the potential returns major mineral discoveries can generate, and begin your 14-day free trial to ensure you're positioned ahead of the broader market.