June 19, 2026

The Opportunity Cost Trap: Why Non-Yielding Assets Suffer When Central Banks Turn Hawkish
There is a particular kind of market stress that builds quietly in the background of monetary policy cycles, one that rarely makes front-page headlines but consistently reshapes capital flows across entire asset classes. When a central bank pivots toward a tighter stance, the arithmetic of holding non-yielding assets changes fundamentally. Gold, silver, and platinum produce no income. They pay no coupon, no dividend, and no interest.
In a zero-rate environment, this characteristic is largely irrelevant. However, in a world where the Federal Reserve is signalling prolonged restrictiveness, the cost of holding bullion rises in direct proportion to what investors can earn elsewhere. That shift in opportunity cost has historically been one of the most reliable drivers of precious metals corrections.
Understanding this mechanism is the starting point for interpreting the current gold price forecast hawkish Fed comments downside in metals, particularly as restrictive Fed signals continue to generate sustained pressure across the precious metals complex.
When big ASX news breaks, our subscribers know first
The Mechanics Behind Fed Language and Metal Prices
Real Yields: The Variable That Actually Drives Gold
Most market participants focus on nominal interest rates when assessing gold's outlook, but the more precise variable is the real yield, defined as the nominal yield on U.S. Treasury bonds minus the prevailing inflation rate. When real yields rise, the attractiveness of holding income-generating assets increases relative to gold, triggering outflows from bullion positions. When real yields fall or turn negative, gold tends to outperform sharply.
This distinction matters enormously in the current environment. A Federal Reserve that signals rates will remain elevated, even without additional hikes, effectively keeps real yields from compressing. That sustained restrictiveness acts as a persistent headwind for metals pricing, even in the absence of new rate increases. Furthermore, understanding gold and bond dynamics helps clarify how these interconnected forces shape broader capital flows across economic cycles.
How Forward Guidance Works Differently From Rate Decisions
It is a common misconception that a Federal Reserve rate hold is neutral for gold. In reality, the tone of the accompanying statement and press conference often matters more than the decision itself. Hawkish forward guidance — language that emphasises data dependency, inflation vigilance, and resistance to early rate cuts — can drive bond yields and the U.S. dollar higher even when the policy rate stays unchanged.
This is precisely the dynamic playing out following the most recent FOMC meeting. Markets absorbed not just the decision, but the broader message embedded in Fed communication, and the repricing across precious metals was immediate. For additional context on how these forces interact, the gold-bond market relationship in 2025 offers valuable insight into current trends.
| Fed Communication Type | Typical USD Response | Typical Gold Response | Typical Silver Response |
|---|---|---|---|
| Rate hike + hawkish guidance | Strong rally | Sharp decline | Amplified decline |
| Hold + hawkish tone | Moderate rally | Moderate pullback | Elevated volatility |
| Hold + dovish pivot signal | Selloff | Rally | Outperformance |
| Rate cut + dovish guidance | Significant decline | Strong rally | Surge |
One important but underappreciated market dynamic is that precious metals traders are often the last to reprice after a Fed event. Bond markets and foreign exchange traders tend to react within minutes, pushing Treasury yields and the dollar higher before commodity desks have fully processed the implications. This sequencing creates a lag effect in metals markets, which is why the two-day window following a Fed announcement is widely regarded among technical analysts as the critical period for establishing near-term direction.
The U.S. Dollar as the Primary Gatekeeper for Metals Direction
Why DXY 101 Has Become the Pivot Level Traders Are Watching
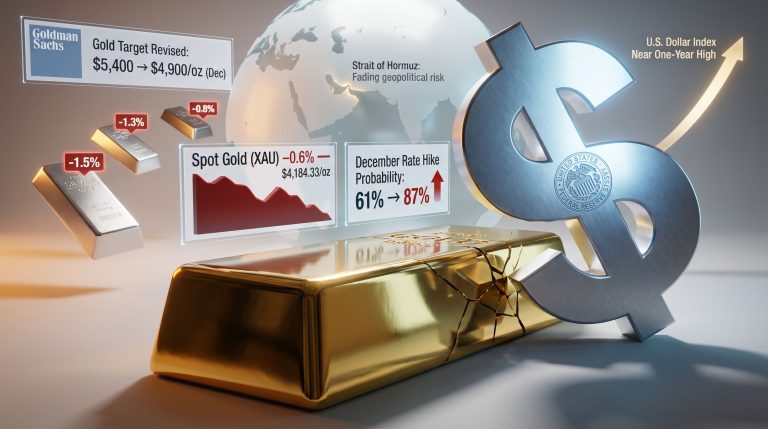
The U.S. Dollar Index surged following the latest Fed communication, and the threshold level that technical analysts are monitoring most closely sits at 101. A sustained close above this level would represent a meaningful technical breakout, one that has historically preceded deeper corrections in gold and silver.
Historical precedent reinforces this concern. When the dollar index has pushed into the 103 to 104 range during previous tightening cycles, precious metals have typically experienced intensified selling pressure. The mechanism is straightforward: a stronger dollar reduces the purchasing power of international buyers, compressing demand from the world's largest gold-consuming markets, including China and India, where purchases are denominated in local currencies.
"A confirmed and sustained U.S. Dollar Index close above 101 has historically preceded accelerated corrections in gold, with the 103 to 104 range representing a zone where precious metals selling pressure typically intensifies."
This currency-adjusted demand dynamic is frequently underestimated by retail investors who track gold prices exclusively in U.S. dollar terms. In local currency terms across emerging markets, gold can already appear expensive long before a dollar rally fully registers in spot price data.
Gold's Technical Setup: Swing Highs, Cycle Indicators, and Mid-Year Targets
Reading the Cycle Indicator at 55
Following the post-Fed price action, gold completed what technical analysts describe as a swing high — a short-term peak where prices briefly recover before resuming a directional move lower. Critically, the Gold Cycle Indicator finished at a reading of 55, a mid-range value that signals neither overbought nor oversold conditions. This is significant because it suggests the current corrective phase has room to extend further before reaching a cyclical exhaustion point.
Gold prices have now officially entered the mid-year target range identified by cycle analysts prior to this correction. Whether this range represents a final bottom or merely an interim pause depends heavily on how prices behave in the sessions immediately following the FOMC event. Consequently, the gold price forecast for the remainder of 2025 hinges on how these near-term technical signals resolve.
Two Key Scenarios Shaping the Near-Term Outlook
Scenario A: Continued Downside Confirmed
- The U.S. Dollar Index sustains a close above 101
- Gold extends lower toward the $3,500 zone
- The correction deepens into Q3 rather than resolving in June
- Silver retreats toward the $50 level
Scenario B: Shakeout and Recovery
- The dollar fails to hold its breakout above 101
- Gold stabilises and reclaims prior support levels
- The broader uptrend in metals resumes
- Silver maintains its position above $60
The distinction between these two scenarios will likely be determined by price action in the first two trading days following the FOMC announcement, making early-week sessions particularly informative for positioning decisions.
Silver, Platinum, and the Amplification Effect Across the Complex
Why Silver Moves Further and Faster Than Gold
Silver's dual identity as both a monetary metal and an industrial commodity makes it inherently more volatile than gold during Fed-driven risk-off episodes. Unlike gold, which is primarily a store-of-value and reserve asset, silver carries significant demand exposure to manufacturing, electronics, and solar panel production. When broader risk sentiment deteriorates following hawkish Fed signals, silver tends to sell off more aggressively.
This occurs because silver simultaneously loses monetary appeal while also pricing in weaker industrial demand expectations — a dual headwind that gold does not face. The $60 level in silver represents a technically significant threshold. A sustained breakdown below this level would open the door to a test of the $50 zone under the bearish scenario outlined above.
| Metal | Key Support Level | Downside Target | Key Resistance | Cycle Status |
|---|---|---|---|---|
| Gold | Current range entry | ~$3,500 zone | Prior swing high | Mid-year target reached |
| Silver | $60.00 | ~$50 (alt. scenario) | $65+ | Inside target range |
| Platinum | Target range interior | ~$1,600 (gap fill) | $1,800+ | Deep inside target zone |
Platinum's November Gap and the $1,600 Target
Platinum is currently sitting deep inside its own technical target range, and continued downside follow-through would likely drive a move toward $1,600 to fill the November price gap. Gap fills in precious metals markets are a well-established technical phenomenon. When prices gap sharply higher on strong momentum, the unfilled zone below frequently acts as a gravitational target during subsequent corrections, particularly when the macro backdrop turns less supportive.
Mining Equities: GDX, GDXJ, and SILJ Under the Microscope
Understanding the Leverage Effect in Mining Stocks
Gold mining equities amplify both the upside and downside moves in spot metal prices, a characteristic driven by their operational leverage. When gold rises $100 per ounce, a miner with $1,500 per ounce in all-in sustaining costs experiences a much larger percentage increase in profit margin than the percentage move in the underlying metal. This leverage works in reverse during corrections.
Senior miners in the GDX ETF surged more than 20% in a single week, opening a large price gap at $80.00. The subsequent reversal at the confluence of the 50-day and 200-day moving averages is a classically bearish technical signal, and the $80 gap now serves as an initial downside target. A deeper pullback into the broader target range remains a possibility heading into July.
| ETF | Key Price Gap | Bearish Confirmation Level | Target Zone |
|---|---|---|---|
| GDX (Senior Miners) | $80.00 | Close below gap | Mid-year target range |
| GDXJ (Junior Miners) | $104.25 | Weekly close below gap | July target area |
| SILJ (Silver Juniors) | $27.15 | Close below gap | Mid-year target range |
Junior miners, tracked by GDXJ, reversed sharply after the Fed announcement. A weekly close below the price gap at $104.25 would provide confirmation of a move into the July target area. Silver junior miners via SILJ rolled over below $31.00 and formed a swing high. A close below the $27.15 gap level would signal one final dip into the mid-year target range.
"When senior miners rally more than 20% within a single week, the resulting price gaps frequently act as gravitational targets during subsequent corrections, particularly when the broader macro environment turns less accommodative."
The next major ASX story will hit our subscribers first
Energy Markets and the Geopolitical Wildcard
Why Oil's Position at the 200-Day Moving Average Matters
WTI crude oil retreated back to its 200-day moving average, a level where technical buyers have historically provided support. However, the energy picture carries a complexity that commodity traders often underestimate: the lag between supply disruption events and their full impact on prices.
The Strait of Hormuz remains a focal point for geopolitical risk. Even if vessels begin exiting the strait normally, it takes several weeks to several months for cargoes to reach their final destinations. During this transit period, existing inventory drawdowns continue. This lag effect means the energy shock may not be fully resolved in near-term price action, even if surface-level news flow appears to normalise.
Energy costs are a significant input for mining operations, meaning sustained oil price volatility adds an additional layer of margin uncertainty for precious metals producers, compounding the downside risk for mining equities already facing a more challenging metals price environment.
Cross-Asset Confirmation: Equities and Bitcoin as Sentiment Signals
The Exhaustion Gap Risk in the S&P 500
Equity markets rebounded following Wednesday's sharp post-Fed decline, but the rebound itself carries a technical warning. Analysts are watching for the possibility of an exhaustion gap — a price pattern where a brief surge higher actually marks the terminal point of a move rather than its continuation. A close below 7,394 in the S&P 500 at any point in the near term would strongly support the thesis that equities have formed a secondary top.
Bitcoin is showing its own bearish technical signal in the form of a potential bear flag pattern. Initial confirmation of this structure would come with a close below $63,000, with final confirmation on a move below $59,000. If confirmed, the initial downside target sits near $50,000 (+/- $2,000).
| Asset | Bearish Trigger Level | Confirmation Level | Initial Downside Target |
|---|---|---|---|
| S&P 500 | Close below 7,394 | Sustained weekly close | Secondary top formation |
| Bitcoin | Close below $63,000 | Below $59,000 | ~$50,000 (±$2,000) |
Weakness across risk assets simultaneously would be a meaningful signal that the broader de-risking environment is deepening, which typically amplifies selling pressure on precious metals as institutional investors reduce overall exposure across correlated positions.
Long-Term Structural Demand: Why the Bull Case for Gold Remains Intact
The Difference Between a Cyclical Correction and a Structural Reversal
Technical pressure and near-term corrections should not be conflated with a structural breakdown in the gold bull case. Institutions including J.P. Morgan have maintained bullish year-end outlooks for gold contingent on eventual Fed policy normalisation, and longer-term demand drivers remain firmly in place.
Several forces continue to underpin gold's structural demand profile regardless of near-term Fed posture:
- Central bank accumulation: Global central banks, particularly in emerging markets, have been buying gold at historically elevated rates as a hedge against dollar-denominated reserve risk. The central bank influence on gold pricing has become one of the most consequential structural forces shaping the market in 2025.
- De-dollarisation trends: The BRICS bloc and other emerging economies have accelerated efforts to reduce reliance on the U.S. dollar in bilateral trade, increasing gold's role as a neutral reserve asset
- Real yield compression expectations: Once the Fed's tightening cycle reaches its terminal phase, real yields are expected to compress, historically a powerful tailwind for gold
- Geopolitical uncertainty premium: Ongoing conflicts and supply chain disruptions continue to support the gold safe-haven dynamics that underpin structural demand for physical bullion
"While hawkish Fed rhetoric creates measurable near-term downside in metals, longer-term structural forces including central bank gold accumulation, de-dollarisation trends, and real yield compression can reassert themselves once the monetary tightening cycle reaches its terminal phase."
In addition, the World Gold Council's outlook research reinforces the view that structural demand drivers are likely to persist well beyond current tightening pressures, providing a longer-term floor for gold valuations.
Frequently Asked Questions: Gold Price Forecast and Fed Policy
Does a Hawkish Federal Reserve Always Push Gold Prices Lower?
Not always, but it does so reliably when the hawkish shift comes as a surprise or when real yields rise meaningfully. Gold has, on occasion, risen alongside rate hikes when inflation expectations were rising even faster, keeping real yields from increasing. The current environment is characterised by the Fed maintaining restrictive language, which keeps upward pressure on real yields and the dollar.
How Long Does It Typically Take for Gold to Bottom After a Hawkish Fed Event?
The two-day post-FOMC window is the critical initial period for price discovery. However, the full corrective cycle often takes several weeks to complete, with the ultimate low sometimes forming weeks after the initial Fed-driven selloff as technical patterns play out and positioning adjusts.
Is Silver More Vulnerable Than Gold During Fed Tightening Cycles?
Yes, structurally. Silver's industrial demand component means it faces a dual headwind during tightening cycles: rising opportunity cost from the monetary side, and weaker industrial demand expectations if the tightening raises recession risk. This dual sensitivity typically results in silver underperforming gold on a percentage basis during corrections.
What Would Cause the Bearish Metals Scenario to Be Invalidated?
The bearish setup would be invalidated if the U.S. Dollar Index fails to sustain a close above 101, if economic data comes in significantly weaker than expected, prompting markets to price in earlier Fed cuts, or if a geopolitical event triggers a sudden flight to safe-haven assets. Any of these developments could halt the correction and resume the prior uptrend.
Key Takeaways for Navigating the Current Metals Environment
- Hawkish Fed language raises real yields and strengthens the dollar, directly increasing the opportunity cost of holding non-yielding assets like gold and silver
- The U.S. Dollar Index level of 101 is the near-term pivot that will determine whether the metals correction deepens toward the $3,500 gold scenario or stabilises
- Gold's Gold Cycle Indicator at 55 signals mid-range conditions with room to extend the correction before a cyclical low is reached
- Silver faces amplified downside risk below $60, with the $50 zone as the alternative scenario target under sustained dollar strength
- Mining equity gaps in GDX at $80, GDXJ at $104.25, and SILJ at $27.15 represent near-term gravitational targets as the corrective phase unfolds
- Cross-asset signals from the S&P 500 and Bitcoin are providing secondary confirmation of broader risk-off sentiment
- Long-term structural demand from central banks, de-dollarisation trends, and eventual real yield compression keeps the multi-year gold bull case intact despite near-term technical headwinds
Disclaimer: This article is for informational and educational purposes only and does not constitute financial advice. Precious metals markets involve significant risk, and past technical patterns do not guarantee future price outcomes. All forecasts and scenario analyses are speculative in nature. Readers should conduct their own research and consult a qualified financial adviser before making investment decisions.
Want to Capitalise on the Next Major Mineral Discovery Before the Broader Market Reacts?
While precious metals navigate Fed-driven headwinds and shifting real yield dynamics, Discovery Alert's proprietary Discovery IQ model delivers real-time notifications on significant ASX mineral discoveries — instantly translating complex data into actionable investment opportunities for both short-term traders and long-term investors. Explore how historic discoveries have generated substantial returns and begin your 14-day free trial today to position yourself ahead of the market.