
August 5, 2026
The Structural Case for a Multi-Year Precious Metals Cycle Has Never Been Stronger
Every major commodity super-cycle in modern financial history has followed a recognisable rhythm: an initial breakout phase driven by early adopters, a mid-cycle correction that shakes out weak hands, and a second, often more powerful advance fuelled by broadening institutional participation. Precious metals markets are no exception to this pattern. For investors studying the current landscape, the weight of technical, macroeconomic, and structural evidence increasingly points toward one conclusion: the gold price forecast bull market begins not at some distant future point, but now, in the wake of a mid-2026 correction that may already have completed its work.
Understanding where we are in the cycle matters far more than debating short-term price targets. The decisions investors make at inflection points like these frequently define portfolio outcomes for the better part of a decade.
When big ASX news breaks, our subscribers know first
Why 2026 May Represent a Structural Inflection Point for Gold
The Secular Bull Market Framework: Where Are We in the Cycle?
Secular bull markets in gold do not behave like equity markets. They tend to unfold across extended timeframes, typically spanning eight to fifteen years, and are characterised by multiple distinct phases. The first phase rewards early movers. The middle phase tests conviction. And the final phase, often the most explosive, captures headlines and generates the most dramatic returns.
Technical analysts tracking long-duration commodity cycles consistently identify mid-cycle corrections as among the most reliable entry signals in secular bull markets. These corrections are not signs of trend failure. They are the mechanism through which the market consolidates prior gains, resets sentiment, and prepares for the next leg higher. Recognising this distinction is the foundational skill that separates long-duration investors from reactive traders. Understanding gold secular cycles helps investors place these corrections in their proper historical context.
The 2006 Analogy: What History Tells Us About Current Gold Price Behaviour
The most instructive historical parallel for the current environment is the 2006 episode in gold markets. During that year, gold experienced a sharp mid-cycle correction following a powerful parabolic advance. Sentiment deteriorated, positioning lightened, and many market participants concluded the bull market was over. It was not. That 2006 correction marked the approximate halfway point of the secular trend that ultimately carried gold from roughly $700 to above $1,900 by 2011.
Technical analysis published at FX Empire draws a compelling structural parallel between the 2006 episode and the price behaviour observed in 2026. The mini-parabolic advance that carried gold to new highs earlier in the cycle bears a strong resemblance to the 2006 spike, both in character and in its role as a potential cycle midpoint signal. If the analogy holds with reasonable fidelity, it implies that the current bull market retains another four to six years of meaningful upside potential before reaching its secular peak.
This historical comparison is not a guarantee of future performance. Technical analogies can break down, and investors should consider multiple scenarios when constructing forward-looking frameworks.
What Is the Gold Price Forecast for 2026 and Beyond?
Near-Term Price Targets: The $4,200 Confirmation Level and Beyond
In the near term, the technical community has identified $4,200 per ounce as a key confirmation threshold. Progressive closes above this level, sustained across multiple sessions rather than achieved through intraday spikes, would provide meaningful evidence that the mid-year low is firmly established and that the next bullish leg is underway. Furthermore, the gold price outlook suggests this threshold carries considerable weight across multiple analytical frameworks.
Looking further ahead, multiple institutions have published structured forecasts that capture a wide range of plausible outcomes depending on the macroeconomic backdrop.
| Forecast Category | Price Target | Timeframe | Key Assumption |
|---|---|---|---|
| Cautious/Constructive | $4,000–$4,500 | Near-term consolidation | Macro uncertainty persists |
| Bullish Base Case | $4,750–$5,500 | Late 2026 | Fed easing + ETF inflows |
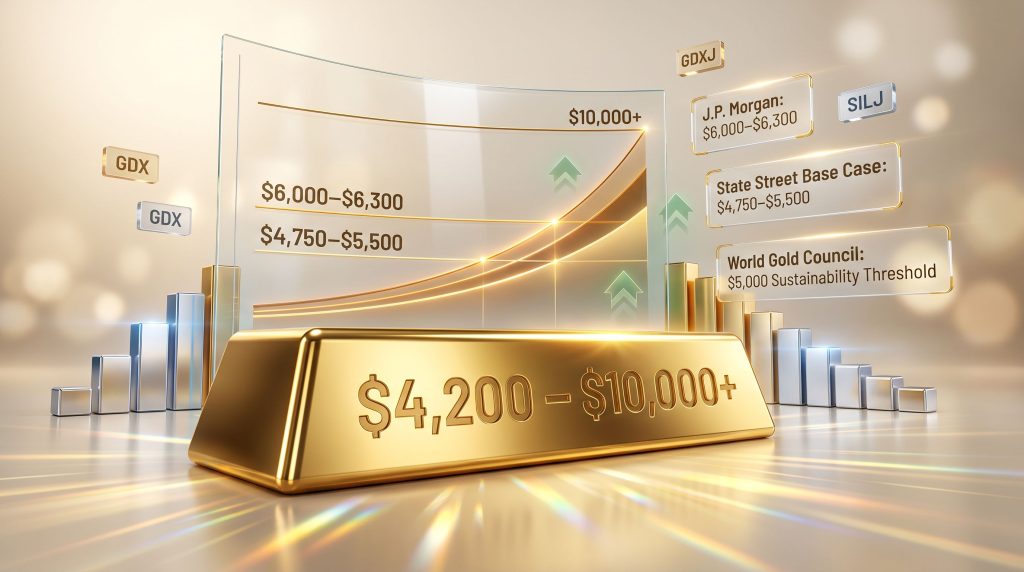
| Aggressive Upside | $6,000–$6,300 | End-2026 / 2027 | Geopolitical escalation + USD weakness |
| Long-Duration Target | $7,000+ | 2027–2028 | Structural fiscal deterioration |
| Secular Peak Scenario | $10,000+ | Early 2030s | Full monetary system repricing |
Institutional Research: What Major Analysts Are Forecasting
The World Gold Council has identified $4,500 as a key resumption signal, with $5,000 per ounce representing the threshold at which the next bull phase would be considered sustainably established. State Street's midyear outlook places the base case between $4,750 and $5,500 for late 2026, with a bull case scenario extending to $5,500–$6,250 under conditions of accelerating Fed easing and renewed ETF demand. J.P. Morgan has published an aggressive target in the $6,000–$6,300 range, contingent on simultaneous geopolitical escalation and meaningful US dollar weakness.
Where analysts disagree most significantly is on timing and catalyst dependency. Some forecasters anticipate a relatively smooth and rapid resumption of the uptrend. Others expect a more drawn-out consolidation before the next meaningful leg begins. Both interpretations are consistent with secular bull market behaviour and should be weighted accordingly.
What Would Invalidate the Bull Case?
No responsible analysis is complete without identifying conditions that could undermine the prevailing thesis. Key risks to the bullish gold price forecast include:
- A sharp and sustained reversal in Federal Reserve policy toward meaningful rate increases
- A significant strengthening of the US dollar driven by recession-driven safe-haven flows into Treasuries
- A rapid and unexpected resolution of major geopolitical conflicts reducing risk premiums
- A collapse in ETF demand combined with central bank divestment, reversing the institutional demand floor
- Technical failure beneath the mid-year low, invalidating the cycle analogy framework
What Are the Primary Drivers Behind the Gold Bull Market in 2026?
Central Bank Gold Accumulation: The Institutional Demand Floor
Central bank demand has been one of the most structurally significant features of the current gold bull market. Purchasing by sovereign institutions, particularly from emerging market central banks diversifying away from US dollar reserve assets, has created a persistent demand floor that distinguishes this cycle from previous ones. The scale of central bank gold demand accelerated again during June 2026, reinforcing the view that this is a structural trend rather than a tactical positioning shift.
ETF Inflows and the Return of Retail Participation
Exchange-traded fund demand for physical gold has historically acted as a powerful amplifying mechanism during bull markets. Western retail and institutional investors, who largely sat out the early stages of the current cycle, are beginning to re-engage as gold's multi-year outperformance becomes impossible to ignore. The combination of institutional ETF inflows and renewed retail interest creates the conditions for a self-reinforcing demand dynamic.
Geopolitical Risk Premiums and Real Interest Rate Dynamics
Gold's performance is closely tied to two additional variables: geopolitical uncertainty and real interest rates. Elevated geopolitical risk sustains a structural safe-haven premium in the gold price. Meanwhile, real interest rates, calculated as nominal rates adjusted for inflation, represent perhaps the single most powerful macro driver of gold prices over medium-term horizons. The expectation of lower real rates as central banks navigate slowing growth environments is a core pillar of the bull case.
Gold's structural advance is supported by four converging forces: central bank demand, ETF inflows, geopolitical uncertainty, and expectations for lower real interest rates. Each independently supports higher prices; together, they create a compounding demand environment that is historically unusual in its breadth.
How Does the US Fiscal Outlook Affect Long-Term Gold Price Projections?
Federal Debt Dynamics and the Currency Debasement Argument
Perhaps the most underappreciated long-term driver of gold prices is the trajectory of US fiscal policy. Federal debt levels have reached a scale that many economists regard as structurally inflationary over a multi-decade horizon. The mechanism is straightforward: governments facing insurmountable debt-to-GDP ratios historically resort to financial repression and currency debasement, both of which are powerfully bullish for hard assets.
Social Security Trust Fund Depletion: A Timeline With Monetary Consequences
A lesser-known but potentially critical catalyst for the long-term gold price forecast bull market begins to come into sharper focus when examining the Social Security Trust Fund depletion timeline. Actuarial projections suggest the fund faces significant stress before the end of this decade. Should depletion materialise before 2030, the fiscal consequences for US monetary policy could be severe, potentially forcing monetary accommodation on a scale that renders current gold price ceiling assumptions obsolete.
Technical analysis suggests that under extreme fiscal stress scenarios, current long-duration price targets for gold and silver could prove conservative by a factor of two. This is not a base case projection but a tail-risk scenario that merits consideration within a diversified precious metals allocation framework.
Silver Price Forecast: Is the Underperformer Becoming the Opportunity?
The $60 Threshold and Physical Supply Constraints
Silver's performance during the first half of the bull market has lagged gold by a meaningful margin, a pattern that is actually typical of early-cycle precious metals behaviour. Silver tends to underperform during the accumulation and early advance phases, then dramatically outperform during the later stages when investor conviction and industrial demand converge simultaneously.
The technical community has identified $60 per ounce as the key confirmation level for silver. Progressive and sustained closes above this threshold would provide high-confidence evidence that the mid-year correction has concluded and that the next advance, potentially the most powerful of the cycle, has begun. Silver reached into the extreme lower end of its mid-year target zone before stabilising, a pattern consistent with prior cycle behaviour.
The physical silver market faces genuine silver supply deficits that distinguish it from gold. Silver's dual role as both a monetary metal and a critical industrial input, particularly in photovoltaic solar manufacturing, creates a unique demand structure that can produce dramatic price dislocations under conditions of genuine physical shortage. Furthermore, some long-duration forecasts targeting prices above $300 per ounce are grounded in this physical scarcity thesis rather than purely monetary arguments.
The next major ASX story will hit our subscribers first
Mining Stocks vs. Physical Gold: Which Offers Greater Upside in the Second Bull Phase?
Why Gold Miners Historically Outperform Bullion in Late-Cycle Markets
One of the most consistent patterns across previous precious metals bull markets is the outperformance of mining equities relative to physical bullion during the latter stages of the cycle. This dynamic reflects the operating leverage embedded in mining business models: as gold and silver prices rise above production cost thresholds, profit margins expand at a multiple of the underlying metal price gain. Consequently, the relationship between gold and mining equities becomes particularly pronounced during these late-cycle advances.
| Asset | Key Confirmation Level | Current Status | Long-Term Outlook |
|---|---|---|---|
| Gold (Spot) | Sustained closes above $4,200 | Uptrend forming | New ATH expected 2027 |
| Silver (Spot) | Sustained closes above $60 | Turning higher | $300+ secular target |
| GDX (Gold Miners ETF) | Break above cyclical downtrend | Mid-year low likely in | Outperformance expected |
| GDXJ (Junior Miners ETF) | Decisive break above downtrend | Near target zone low | High-leverage opportunity |
| SILJ (Silver Junior Miners) | Progressive closes above $26 | Low near $23 zone | Breakout pending Q3 |
| Platinum | Return to gold parity | Held mid-year lows | Blow-off phase target |
Junior Miners and Silver Juniors: Higher Risk, Higher Leverage
Junior gold miners tracked by the GDXJ ETF and silver junior miners tracked by SILJ represent the highest-leverage segment of the precious metals equity universe. SILJ appears to have established a low just above the $23 level, with the near-term focus on progressive closes above $26 before a broader cyclical downtrend line breakout becomes achievable in the third quarter.
The risk-adjusted case for junior miners rests on a specific dynamic: in late-cycle bull markets, capital flows into smaller producers and developers that were overlooked during the early accumulation phase. This creates asymmetric return potential, but also carries significantly higher volatility and company-specific risk that investors must evaluate carefully.
Step-by-Step: How Technical Analysts Confirm a Bull Market Resumption
- Identify the mid-cycle correction zone using historical analogue mapping and prior technical model targets
- Monitor for price stabilisation within the predicted target range across multiple sessions
- Watch for progressive closes above key resistance levels, not single-session intraday spikes
- Confirm with sector breadth by ensuring miners, juniors, and silver are all confirming simultaneously
- Validate with macro alignment checking that Fed policy direction, USD trend, and real yield trajectory support the move
- Await cyclical downtrend line breach as the definitive confirmation that the new upward leg has definitively begun
Is Platinum the Overlooked Asset in the Precious Metals Bull Market?
Platinum receives considerably less attention than gold or silver in most precious metals commentary, yet it may represent one of the most asymmetric long-duration opportunities in the metals complex. Historically, platinum has traded at a significant premium to gold, reflecting its rarity and industrial indispensability. The current pricing relationship, in which platinum trades at a substantial discount to gold, is historically unusual and arguably represents a structural mispricing.
The long-term thesis for platinum involves a return to price parity with gold, a milestone that technical analysts believe will not be reached until the final blow-off phase of the precious metals bull market in the early 2030s. Platinum's dual demand structure, spanning both monetary and industrial applications, could act as a compounding catalyst if precious metals enthusiasm coincides with supply tightness in the automotive and hydrogen economy sectors.
How Does Bitcoin's Four-Year Cycle Interact With Precious Metals Trends?
Bitcoin operates according to one of the most well-documented cyclical patterns in modern financial markets, driven by its algorithmically predetermined supply halving events occurring approximately every four years. Technical analysis suggests the next four-year cycle low is expected around October 2026, with a potential test of the $40,000 level serving as a plausible downside target before that low is established.
Bitcoin's four-year cycle has historically produced predictable capitulation phases. Cross-asset flow analysis suggests that a Bitcoin bear-phase washout reaching maximum fear sentiment can accelerate capital reallocation toward hard assets including gold and silver, providing an additional tailwind for precious metals at precisely the point when the second bull market leg is attempting to establish itself.
The mechanism linking Bitcoin weakness to gold strength is not automatic, but the pattern of capital rotation from speculative risk assets toward monetary hard assets during periods of crypto market stress is well-documented. An aggressive Bitcoin breakdown in August or September culminating in a final capitulation washout could prove to be an indirect positive catalyst for the precious metals complex.
Frequently Asked Questions: Gold Price Forecast and Bull Market Outlook
Is gold still in a bull market in 2026?
Based on technical cycle analysis, long-term structural indicators, and institutional research from the World Gold Council, State Street, and J.P. Morgan, the preponderance of evidence supports the view that the secular gold bull market remains intact. The 2026 correction is characterised by most technical analysts as a mid-cycle event rather than a trend reversal.
What is the gold price target for 2027?
Technical analysis identifies new all-time highs as the expected outcome for 2027, with the potential to exceed $7,000 per ounce under supportive macroeconomic conditions. Institutional forecasts from J.P. Morgan place an aggressive target in the $6,000–$6,300 range for end-2026 to 2027.
Could gold really reach $10,000?
Long-duration secular peak scenarios targeting $10,000 or above are contingent on a fundamental repricing of the monetary system, driven by fiscal deterioration, currency debasement, and a structural shift in global reserve asset preferences. These are tail-risk scenarios rather than base case projections, but they are grounded in identifiable macro dynamics rather than pure speculation.
Why do mining stocks outperform gold in the later stages of a bull market?
Mining companies carry significant fixed cost structures. As metal prices rise, revenue per ounce grows while costs remain relatively stable, producing exponential margin expansion. This operating leverage translates directly into share price outperformance relative to the underlying metal, particularly during the most powerful phases of a bull market.
What technical level confirms the next gold bull market leg has begun?
Progressive and sustained closes above $4,200 per ounce for gold represent the primary near-term technical confirmation threshold identified by cycle analysts. For silver, the equivalent threshold is $60 per ounce. For mining ETFs, a decisive and sustained break above the prevailing cyclical downtrend line is the required confirmation signal.
Strategic Takeaways: Positioning for the Second Phase of the Precious Metals Cycle
The key insight that distinguishes experienced precious metals investors from reactive market participants is the understanding that the most significant wealth creation in secular bull markets typically occurs during the final stages, precisely when investor conviction is lowest and positioning is lightest. The mid-cycle correction that defined 2026 has likely created the setup for exactly this dynamic.
A well-constructed portfolio approach for the second phase of the cycle might consider:
- Physical gold as the core foundation, providing monetary protection and portfolio insurance
- Physical silver, offering asymmetric upside potential given physical supply constraints and industrial demand growth
- GDX-tracked senior miners, providing operating leverage to rising metal prices with relatively lower company-specific risk
- GDXJ-tracked junior gold miners, offering higher leverage for investors with appropriate risk tolerance
- SILJ-tracked silver junior miners, representing the highest-conviction high-leverage position for those with a long-duration outlook
- Platinum exposure, as a potentially overlooked secular opportunity targeting eventual gold parity
Timing entry with precision is less important than understanding cycle phase. Long-duration investors who correctly identify the structural positioning of the market within a secular trend, and who maintain conviction through volatility, have historically captured the majority of the bull market's total return.
Secular precious metals bull markets rarely move in straight lines. The strongest gains typically occur during the latter stages of the cycle, at the very moment when investor conviction is lowest and positioning is lightest. History suggests patience and structural understanding matter far more than entry precision.
Disclaimer: This article is intended for informational and educational purposes only. It does not constitute financial, investment, or trading advice. All price targets, forecasts, and scenario analyses referenced herein involve inherent uncertainty and should not be relied upon as predictions of future outcomes. Readers should conduct their own due diligence and consult a qualified financial adviser before making any investment decisions. Past performance of any asset class, including precious metals and mining equities, is not indicative of future results.
Want to Know Which ASX Mining Stocks Could Benefit From the Next Major Precious Metals Discovery?
Discovery Alert's proprietary Discovery IQ model scans ASX announcements in real time, instantly identifying significant mineral discoveries across gold, silver, and other commodities before the broader market reacts — explore the historic returns major discoveries have generated and begin your 14-day free trial today to position yourself ahead of the next major find.