
August 5, 2026
When Good News Stops Moving Markets: A Framework for Understanding Gold's Precarious Position
There is a well-documented phenomenon in financial markets where an asset's failure to respond to favourable catalysts reveals more about its underlying condition than any single price move ever could. Veteran technical analysts treat this non-response as one of the most reliable directional signals available, particularly when the favourable catalysts are both numerous and significant. In mid-2026, precious metals traders are confronting exactly this dynamic, and the implications for the gold price forecast to slide are difficult to dismiss.
Understanding why gold sits where it does requires stepping back from individual data points and examining the broader behavioural architecture of the market. Price action is, at its core, a reflection of collective psychology. When that psychology has already absorbed the most bullish scenario imaginable and the price barely moves, the weight of probability shifts toward the downside.
When big ASX news breaks, our subscribers know first
The Behavioural Signal That Precedes Most Significant Corrections
Technical analysts refer to this pattern informally as the "shrug effect," a condition where an asset consistently absorbs news that should logically trigger a rally and produces little to no upward movement in response. This is not a minor curiosity. Across multiple asset classes and historical periods, it has proven to be one of the most dependable early warning signals of an impending directional shift.
The mechanics behind it are straightforward. When buyers have already committed capital based on an anticipated favourable outcome, the actual arrival of that outcome removes the forward-looking incentive to buy. If the market was already pricing in soft inflation data, dovish Fed rhetoric, and geopolitical tension, then the confirmation of all three scenarios simultaneously produces a market that has nowhere new to go on the upside.
What happened in precious metals during the second week of July 2026 is a textbook illustration of this dynamic:
- June headline CPI fell 0.4%, the sharpest single-month decline since April 2020
- Core CPI came in flat, signalling broad disinflationary momentum
- Producer prices dropped 0.3% against a consensus forecast of zero change
- The probability of a Federal Reserve rate hike at the July meeting collapsed from above 40% to approximately 10%
- Bitcoin surged past $65,000 on the same data set, demonstrating that risk appetite was clearly present in the broader market
- Gold moved from approximately $4,000 to $4,023, a gain of roughly $23
- Silver declined from approximately $57.50 to $56.78, registering a new low despite the most favourable macro backdrop of the year
The critical insight here is not what gold did. It is what gold failed to do. When an asset receives the best possible news it is likely to encounter within a given market cycle, and the price response is negligible, the path of least resistance has statistically shifted. This is the interpretive foundation of what technical analysts describe as distribution behaviour at a market peak.
What Institutional Forecasters Are Currently Projecting
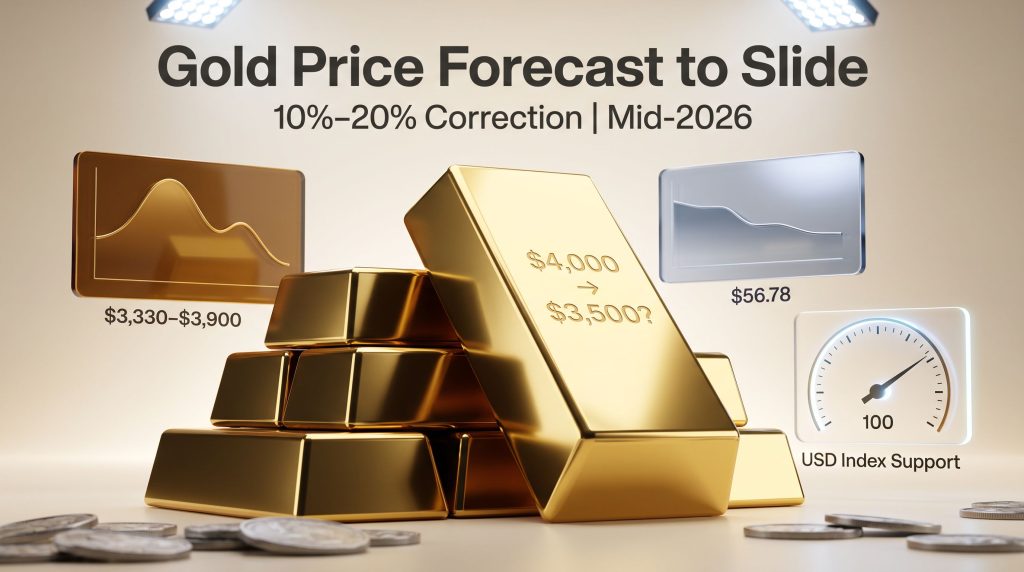
The gold price forecast to slide is not a fringe view. A meaningful cluster of institutional price targets for the second half of 2026 points toward a correction ranging from 10% to 20% from current levels. The table below summarises the current spread of forecasts across major institutions and analytical sources.
| Institution / Source | Forecast Range | Target Timeframe | Primary Driver |
|---|---|---|---|
| Citi | ~$3,500/oz | September 2026 | Geopolitical risk normalisation |
| CoinCodex / LongForecast | $3,330 to $3,513 | October 2026 | Macro mean reversion |
| LiteFinance | $2,875 to $2,994 | December 2026 | Sustained bearish macro environment |
| Goldman Sachs | $4,900 (revised lower) | Year-end 2026 | Healthy consolidation thesis |
| J.P. Morgan | $6,300 | Year-end 2026 | Central bank demand cycle |
The distance between J.P. Morgan's $6,300 target and LiteFinance's $2,875 floor represents the widest institutional forecast divergence in recent memory. This spread is itself informative. It tells us that the debate is no longer purely about direction, but about timing and the relative weight assigned to structural versus cyclical forces.
Goldman Sachs is particularly noteworthy in this context. Even as one of the most consistently bullish voices on gold over the past several years, the institution has revised its year-end target lower to $4,900, acknowledging that near-term headwinds are real even within a broader structural uptrend. Furthermore, a downward revision from a bullish institution carries more signal weight than a bearish call from a perennially sceptical one. For a broader view of where prices may be heading, FX Street's live commodities data provides useful real-time context.
The Four Forces Driving the Near-Term Bearish Case
Federal Reserve Hawkishness Is Not as Dead as the Data Suggests
The collapse in July rate hike odds has been widely interpreted as a dovish pivot signal. However, this reading is incomplete. Despite the dramatic shift in near-term rate expectations, Federal Reserve Chair commentary during the week of 14 July 2026 was explicitly cautionary.
Testifying before both chambers of Congress, the Fed Chair declined to characterise recent inflation prints as a victory, pointing instead to the imperfect nature of current price measurement methodologies and signalling the formation of task forces to rethink how inflation is measured entirely. This posture communicates a deliberate refusal to lock in a dovish trajectory based on two favourable data points.
Markets still broadly expect at least one rate increase before year-end 2026, and that expectation anchors the opportunity cost argument against holding non-yielding gold. Historically, gold has underperformed during every sustained Federal Reserve tightening cycle since 1980. The July hike may have come off the table, but the broader tightening bias has not. This directly affects the gold and bond dynamics that underpin much of the near-term pricing pressure.
The USD Index Is Holding a Critical Technical Floor
Despite moving below a rising support line over the course of the week, the USD Index maintained the psychologically and technically significant 100 level throughout. This is the single most important variable in the near-term gold framework. Gold's inverse correlation with the dollar means a sustained greenback recovery would apply direct downward pressure on gold prices.
What makes this particularly relevant is the pattern precedent. Approximately one month prior, a comparable support line breakdown in the USD Index resolved sharply to the upside, triggering a significant dollar rally. With only one daily close below the current support line, the breakdown remains technically unconfirmed. Two or more consecutive daily closes below the 100 level would be required to validate a structural dollar reversal. Until that confirmation arrives, the bullish dollar structure remains intact.
Geopolitical Risk Premium Has Fully Priced In
Five consecutive days of US military strikes on Iran produced no sustained safe-haven bid in gold. The operations included air defence exchanges over Tehran, the disabling of a tanker approaching Kharg Island (Iran's primary oil export terminal), and public threats from US leadership regarding the potential targeting of Iranian power and infrastructure facilities in the following week. Iran's foreign ministry publicly rejected any negotiation framework, making this an active, escalating conflict in one of the world's most strategically critical oil corridors. Yet gold declined.
When active military conflict escalating in real time over a major global oil route cannot generate a lasting safe-haven premium, it is a strong indicator that speculative positioning has already absorbed the risk narrative. The geopolitical risk premium that previously supported gold prices has been priced in, consumed, and exhausted.
This is a nuanced but critical insight for investors accustomed to assuming that geopolitical conflict is reliably bullish for gold. The relationship is more conditional than commonly understood. Consequently, gold safe-haven demand that initially supported prices has now been fully absorbed by the market, limiting further upside from this catalyst alone.
Economic Resilience Reduces Safe-Haven Urgency
Rising real bond yields offer income-generating alternatives to gold that become increasingly attractive as economic conditions remain stable. Multiple institutional analysts cite this resilient-growth backdrop as a primary catalyst for an expected 10% to 15% correction before bargain-hunting demand re-emerges at lower price levels. When fear is absent and income alternatives are available, the opportunity cost of holding gold becomes a meaningful drag on positioning.
Silver as a Forward-Looking Signal for the Entire Sector
Silver's behaviour during this period deserves particular attention because it functions as a leading indicator for the broader precious metals complex rather than a lagging one. Silver typically amplifies gold's directional moves, moving further and faster in both directions. When silver underperforms gold during a period of strong positive macro catalysts, it signals that the weakness is sector-wide and structural rather than gold-specific.
The fact that silver closed below its pre-announcement level despite receiving the identical macro inputs as gold is a bearish divergence signal with meaningful historical precedent. Furthermore, an expanding gold-silver ratio during a bullish macro environment points toward the same conclusion that gold's price action is already communicating: the sector is in a distribution phase, not an accumulation phase.
Why the Structural Bull Case Is a Timing Question, Not a Direction Question
The long-term case for gold has not disappeared. Several structural forces remain firmly in place:
- Central bank demand continues at a pace not seen since the Bretton Woods era
- De-dollarisation trends among BRICS-aligned economies continue to create long-term demand
- J.P. Morgan's $6,300 year-end target is grounded in sovereign demand dynamics that operate on multi-year cycles
- Goldman Sachs frames the current period as a consolidation phase within a broader structural uptrend
The distinction that matters for near-term positioning is that central bank buying operates on multi-year cycles and does not immunise gold against short-term corrections of 15% to 20%. The gap between J.P. Morgan's $6,300 and the bearish cluster of $3,330 to $3,900 is fundamentally a disagreement about timing, not about whether gold's long-term structural story is intact.
The next major ASX story will hit our subscribers first
Scenario Analysis: Three Pathways for the Gold Price Through Year-End 2026
Scenario 1: Base Case Correction (10% to 15% Decline)
Gold retreats to the $3,400 to $3,600 range by Q3 2026, driven by USD resilience, persistent Fed hawkishness, and the continued erosion of the geopolitical risk premium. At these levels, institutional bargain-hunting demand is expected to re-emerge, providing a floor from which the structural bull thesis can reassert itself.
Scenario 2: Accelerated Bearish Move (15% to 20% Decline)
Gold falls toward $3,270 to $3,500 by September or October 2026. This scenario requires a confirmed USD breakout above resistance, an unexpected Fed rate action, or a rapid de-escalation of the Iran conflict. Under this scenario, algorithmic selling accelerates the technical breakdown, and silver leads further to the downside.
Scenario 3: Tail-Risk Bear Case (Greater Than 20% Decline)
Gold approaches $2,875 to $3,000 by December 2026 under a scenario combining persistent macro headwinds, complete geopolitical normalisation, and sustained real yield increases. This is the lowest-probability scenario but is cited by analysts at LiteFinance as a plausible outcome under sufficiently adverse conditions.
Scenario 4: Bull Case Resurgence
Gold recovers toward $4,500 to $6,300 if the Federal Reserve pivots earlier than currently expected, if the dollar breaks down decisively below the 100 level, or if a major geopolitical shock disrupts global energy supply chains in an unanticipated way. This is J.P. Morgan and Goldman Sachs' preferred long-term scenario, likely playing out in H2 2026 or extending into 2027.
Key Questions Investors Are Asking
Why is gold falling when inflation data is soft?
Soft inflation data reduces the urgency for aggressive Fed tightening, which theoretically benefits gold. However, when the market has already positioned for the dovish scenario before the data arrives, the actual confirmation of soft prints removes the forward-looking incentive to buy. Other factors, particularly USD technical resilience and elevated speculative positioning, are currently exerting greater downward pressure than the dovish inflation narrative can offset.
Does geopolitical conflict always push gold higher?
The relationship is conditional rather than automatic. Initial safe-haven impulses are real, but prolonged or widely anticipated conflicts see their risk premium absorbed and eventually exhausted. When active military escalation in a strategically critical region fails to sustain a safe-haven premium over multiple sessions, it indicates the market has fully priced the risk.
How does silver's performance inform the gold outlook?
Silver functions as a directional amplifier for the precious metals sector. When silver underperforms gold during a period of broadly positive macro conditions, it historically precedes broader sector weakness. The current silver underperformance is therefore a sector-wide signal, not a silver-specific one.
Positioning Considerations: What This Framework Means for Investors
This section is analytical in nature and does not constitute financial advice. All forecasts referenced are sourced from institutional research and independent analysis. Investors should seek professional advice before making allocation decisions based on market forecasts.
The current environment presents a challenging decision framework for precious metals investors. Several structural truths are worth separating from the near-term tactical picture:
-
The shrug effect is one of the most reliable bearish signals available in technical analysis. Gold's repeated failure to hold intraday gains across multiple consecutive sessions is consistent with institutional distribution behaviour near a market peak.
-
The USD Index holding the 100 level is the single most important variable to monitor. A confirmed breakdown below this level, requiring multiple consecutive daily closes, would materially alter the near-term bearish thesis.
-
Silver's underperformance relative to gold is a sector-wide warning signal, not a silver-specific issue, and historically precedes broader precious metals corrections.
-
The consensus correction range of $3,330 to $3,900 represents a 10% to 20% decline from mid-2026 price levels. The tail-risk scenario at $2,875 is low-probability but not impossible under sufficiently adverse conditions.
-
Long-term structural bulls should distinguish between the near-term tactical environment and the multi-year demand cycle. Central bank accumulation and de-dollarisation trends provide a durable demand floor, but they do not prevent intermediate corrections from occurring.
The gold price forecast to slide is gaining credibility not because the structural story has changed, but because the near-term behavioural and technical evidence is pointing clearly in one direction. Understanding which timeframe you are investing across may be the most important variable of all.
For additional independent technical analysis and perspectives on gold price forecasting methodology, J.P. Morgan's commodities research provides institutional-level insight into the forces shaping precious metals markets through the remainder of 2026.
Want to Know the Moment the Next Major ASX Mineral Discovery Hits the Market?
While gold navigates complex macro headwinds and institutional forecasts diverge sharply, Discovery Alert's proprietary Discovery IQ model scans ASX announcements in real time, instantly identifying significant mineral discoveries across more than 30 commodities and delivering actionable insights directly to subscribers — explore historic discovery returns on the Discovery Alert discoveries page and begin your 14-day free trial to position yourself ahead of the broader market.