June 22, 2026
The Hidden Mechanics Behind Gold's Price Behaviour in Inflationary Times
Most investors assume a simple equation: rising inflation equals rising gold. The reality is considerably more nuanced, and understanding why that assumption fails in practice is the single most important insight any precious metals investor can carry into 2026 and beyond. The gold price and inflation outlook right now is shaped by at least three competing macro forces simultaneously, and the investor who grasps this complexity holds a meaningful edge over those relying on headlines alone.
When big ASX news breaks, our subscribers know first
Why Inflation Alone Does Not Drive Gold Prices
Gold's long-term reputation as a store of value is well-earned and historically defensible. Over multi-decade horizons, the metal has reliably preserved purchasing power against currency debasement. However, over shorter timeframes, inflation figures alone are a poor predictor of gold's direction.
The more precise relationship is between gold and real interest rates, which are nominal rates adjusted for inflation. When central banks raise interest rates faster than inflation climbs, real yields move higher, increasing the opportunity cost of holding a non-yielding asset like gold. This is why gold as an inflation hedge can actually underperform during inflationary episodes if monetary policy is seen as sufficiently aggressive.
Three forces compete for dominance in gold pricing at any given moment:
- Monetary policy expectations, which represent the most powerful near-term influence on price direction
- Real yield dynamics, where an inverse relationship between gold and real yields is among the most empirically consistent patterns in commodities research
- Safe-haven and de-dollarisation demand, a structural longer-term force driven by geopolitical fragmentation and central bank reserve diversification
When markets price in rate hikes faster than inflation expectations rise, gold can decline even as consumer prices accelerate. This counterintuitive dynamic is not an anomaly; it is the mechanism.
What the Current Inflation Data Actually Reveals
Core PCE Versus the Broader Inflation Reality
The April 2026 release of core Personal Consumption Expenditures, the Federal Reserve's preferred inflation gauge, came in at a level characterised as sufficiently benign to relieve immediate pressure for rate increases. Market consensus quickly concluded that the Federal Open Market Committee would stand pat at its June 17 meeting rather than resume hiking the Federal Funds Rate.
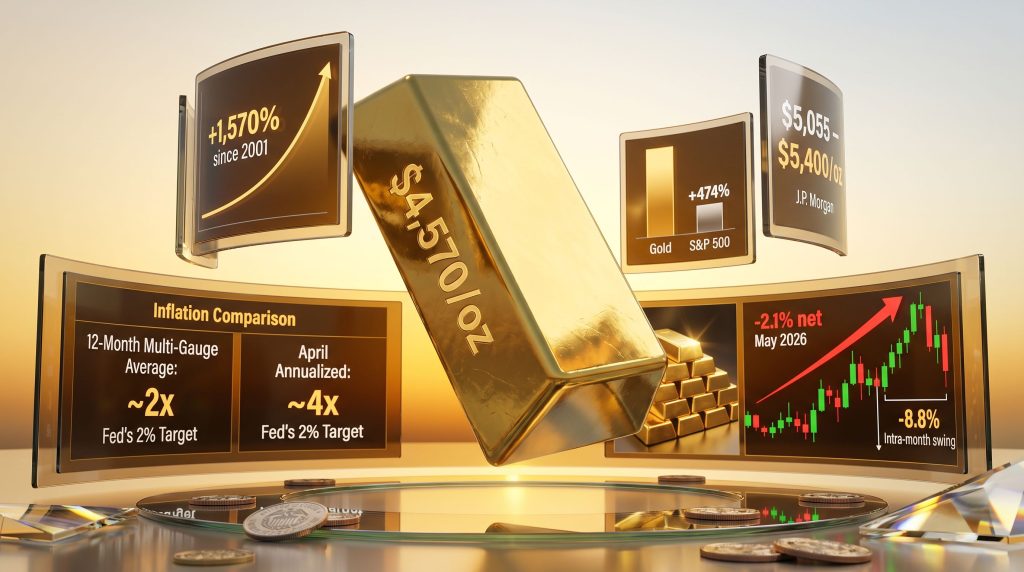
Zooming out from any single data point, however, tells a very different story. When a composite of multiple inflation gauges is tracked over the trailing 12 months through April 2026, the average reading sits at approximately double the Fed's stated 2% annual target. On an annualised basis for April alone, that same multi-gauge average reaches roughly four times the 2% benchmark.
| Inflation Metric | Observation |
|---|---|
| Core PCE (April 2026) | Fed-friendly; no immediate rate hike trigger |
| 12-Month Multi-Gauge Average | Approximately 2x the Fed's 2% target |
| April Annualised Multi-Gauge Average | Approximately 4x the Fed's 2% target |
| Next FOMC Decision Date | June 17, 2026 |
| Subsequent FOMC Meeting | July 29, 2026 |
The Exclusion Problem in Core Inflation Metrics
The divergence between core and headline inflation is not merely a statistical curiosity. Stripping food and energy from core measures systematically understates the lived inflation experience for ordinary households. Energy-driven price spikes have historically been among the most powerful catalysts for gold demand surges, precisely because energy inflation is both visible and psychologically impactful.
When the gap between headline and core widens persistently, it creates a policy credibility problem for central banks. If the Fed is seen to be tolerating inflation that households experience daily while citing a "tamer" core figure, confidence in monetary policy erodes. That erosion, over time, is structurally supportive for gold safe-haven trends as an alternative store of value.
Gold's Actual Price Behaviour Through May 2026
Extreme Volatility, Minimal Net Displacement
Gold's August futures contract moved through a remarkable sequence of peaks and troughs across May's 20 trading days, with a high-to-low range for the month of approximately -8.8%. Despite this dramatic intra-month oscillation, the net price change was a comparatively modest -2.1%, with the contract settling near $4,570 per ounce at month-end after closing April at $4,669.
This pattern of wide oscillations with limited directional displacement reflects a market caught between genuine opposing forces rather than one with clear directional conviction. Large intra-month swings with small net changes are characteristic of price consolidation or transition phases, where neither bulls nor bears can sustain momentum.
The Counterintuitive War Trade Dynamic
A recurring and analytically important pattern throughout May 2026 deserves attention: gold moved in the opposite direction to what conventional geopolitical logic would predict. On days when Middle East conflict escalation appeared likely, gold prices fell. On days when peace negotiations seemed to progress, gold rose.
This reversal of the classic safe-haven trade reflects how gold interacts with the US dollar and oil prices during geopolitical stress events. When conflict risk rises, oil and the dollar typically attract safe-haven flows, which pressures gold in USD terms. When peace prospects improve, dollar and oil strength fades, and gold recovers. Furthermore, this dynamic has been documented across multiple geopolitical cycles and is not unique to 2026.
What analysts sometimes call the "backward war trade" reflects an important market structure reality: gold's initial spike on geopolitical news is frequently followed by a directional reversal, as currency and yield movements ultimately dominate price discovery over days and weeks.
Century-to-Date Performance Context
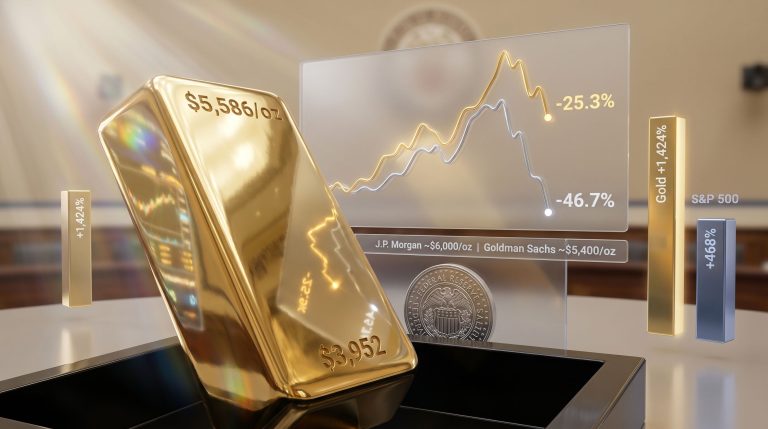
The near-term technical picture for gold in mid-2026 stands in sharp contrast to its very long-term track record. Since January 1, 2001, gold has delivered approximately +1,570% in price appreciation. Over the same period, the S&P 500 on a price-return basis (excluding dividends) has returned approximately +474%. Gold has consequently outperformed the benchmark equity index by more than three times across this 25-year window.
Gold Price Forecast for 2026 and 2027
Technical Pressure Points and Trend Signals
As of the end of May 2026, gold has recorded three consecutive down months, the longest losing streak since a seven-month drawdown during the Fed's aggressive rate-hiking cycle through mid-2022. The current parabolic short trend has extended to eleven consecutive weeks.
Key technical parameters as of late May 2026:
- Expected daily trading range: approximately 104 points
- Expected weekly trading range: approximately 304 points
- Price level required to flip the trend from Short to Long: approximately $5,088/oz
- Distance from current price to that reversal level: approximately 518 points
At the current weekly trading range, that 518-point gap represents roughly 1.7 weeks of maximum movement, making a near-term trend reversal technically challenging but not structurally impossible.
Institutional Price Forecasts
According to J.P. Morgan's gold price analysis, the metal is expected to reach meaningful new highs driven by inflation persistence and structural demand. The broader gold price and inflation outlook across major institutions reflects cautious optimism for the medium term.
| Institution | 2026 Gold Price Target | 2027 Gold Price Target | Key Driver |
|---|---|---|---|
| J.P. Morgan | ~$5,055/oz | ~$5,400/oz | Inflation persistence + central bank demand |
| VanEck | Constructive | Constructive | Geopolitical risk + de-dollarisation |
| Trading Economics | Higher than current | Not specified | 12-month mean reversion |
J.P. Morgan's projection of approximately $5,055/oz by late 2026 and $5,400/oz by end of 2027 represents one of the more specific institutional forecasts in circulation. VanEck's constructive stance is grounded in the combination of inflation persistence, ongoing central bank gold demand accumulation programmes, and geopolitical risk premiums that show no structural sign of dissipating.
The 2004-2006 Precedent That Challenges Rate-Hike Orthodoxy
A lesser-appreciated historical data point: during the Fed's tightening cycle between 2004 and 2006, gold prices rose consistently alongside successive rate increases. This precedent directly challenges the orthodoxy that Fed hiking cycles are necessarily negative for gold. The critical variable is whether real yields remain negative in inflation-adjusted terms even as nominal rates rise. If inflation stays elevated enough, gold can appreciate through a tightening cycle — a pattern explored further when examining gold and bond dynamics across economic cycles.
Gold Mining Equities Versus Physical Gold: Year-Over-Year Snapshot
Mining equities have broadly outperformed physical gold on a year-over-year basis through May 2026, a pattern explained by operational leverage. As gold prices rise, the margin between production cost and selling price expands disproportionately, amplifying equity returns relative to the metal itself. This is the core principle behind gold mining equity leverage and why miners often attract attention during gold bull markets.
| Asset | Year-Over-Year Return |
|---|---|
| Gold (physical) | +39% |
| Franco-Nevada (FNV) | +37% |
| Agnico Eagle Mines (AEM) | +55% |
| VanEck Gold Miners ETF (GDX) | +78% |
| Newmont (NEM) | +108% |
| Global X Silver Miners ETF (SIL) | +118% |
| Pan American Silver (PAAS) | +134% |
The outperformance of silver miners relative to gold miners is notable and reflects silver's dual role as both a monetary metal and an industrial input with growing demand in solar energy and electronics manufacturing. Silver's tighter supply-demand fundamentals amplify its leverage to gold price cycles, while also introducing more volatility.
It is worth noting that downward technical trends from mid-winter remain technically intact across this equity group despite resilient buying activity in the mix. The divergence between strong year-over-year returns and persistent near-term downtrends illustrates how different analytical timeframes can produce genuinely contradictory signals.
The next major ASX story will hit our subscribers first
Broader Economic Signals Surrounding the Gold Price Outlook
A Deteriorating Economic Barometer
Of the ten economic indicators released during the final week of May 2026, only two showed improvement period-over-period. April's Durable Goods Orders were the standout positive, surging +7.9% to reach an 11-month high and beating consensus estimates. However, the broader picture was considerably weaker:
- April Personal Income declined
- April New Home Sales declined
- Initial Jobless Claims rose to the fourth-worst weekly reading year-to-date across 21 reported weeks
- Consumer spending in April exceeded personal income, suggesting increased reliance on credit
When consumer spending consistently outpaces income growth, it signals reliance on credit expansion rather than genuine economic strength. Historically, this late-cycle dynamic tends to benefit gold as confidence in economic durability erodes.
The S&P 500 Valuation Problem
The S&P 500 reached a record high of approximately 7,599 in late May 2026. Its price-to-earnings ratio has reached approximately 50.0x, a historically extreme level that far exceeds even the elevated valuations seen during prior bubble episodes. The index has been classified as textbook overbought for 36 consecutive trading days, with conditions described as extreme.
For context, the S&P 500 at 50x earnings implies that investors are paying $50 for every $1 of current earnings, a multiple that embeds highly optimistic assumptions about future earnings growth and discount rates. Historically, P/E ratios at these levels have preceded significant capital reallocation events, some of which have coincided with meaningful flows into hard assets including gold.
Cross-Asset Dynamics: Dollar, Euro, and the Currency Equation
Both the US Dollar Index and the Swiss Franc have posted similar gains year-to-date in 2026, with the Euro and Japanese Yen bearing the primary burden of that strength. A structurally stronger dollar creates ongoing headwinds for gold priced in USD terms. This dollar dynamic, rather than geopolitical noise, continues to represent the most mechanically direct near-term headwind for gold. For current price data and trend tracking, Trading Economics gold data provides a useful real-time reference point.
The Competing Arguments: Bull Case and Bear Case for Gold
Why the Structural Bull Case Remains Intact
- Multi-gauge inflation running at 2x to 4x the Fed's target provides an enduring real-value argument for gold
- Global central banks, particularly in emerging markets, continue accumulating gold as a de-dollarisation mechanism
- Extreme S&P 500 valuations at 50x P/E create a meaningful reallocation catalyst if equity markets experience a corrective phase
- Gold's century-to-date returns of +1,570% versus the S&P 500's +474% demonstrate a long-term wealth preservation capacity that compounding equity returns have not matched on a price basis
- If the Fed cannot raise rates due to economic fragility while inflation persists, gold's real value proposition strengthens materially
Near-Term Headwinds That Cannot Be Dismissed
- Eleven consecutive weeks of parabolic short trend creates meaningful technical resistance
- A resumption of Fed rate hikes, if inflation forces the FOMC's hand, would raise the opportunity cost of non-yielding gold
- US dollar structural strength continues to suppress gold's USD-denominated price
- Three consecutive monthly declines signal weakening medium-term momentum
- Any durable geopolitical resolution in the Middle East could reduce safe-haven demand premiums meaningfully
The gold price and inflation outlook for 2026 is not a binary outcome. Near-term technical and monetary headwinds are real and measurable. But the structural case built on inflation persistence, central bank demand, and equity market fragility remains intact for investors with patient, long-horizon perspectives.
Frequently Asked Questions: Gold Price and Inflation Outlook
Does gold always rise when inflation increases?
Not consistently in the short term. Gold responds more directly to real interest rates than to inflation in isolation. When central banks raise nominal rates faster than inflation expectations increase, real yields can rise, making yield-bearing assets more attractive relative to gold. Over long horizons, gold has preserved purchasing power reliably, but short-term price action frequently diverges from inflation trends in ways that surprise investors conditioned by the simple inflation-hedge narrative.
What is the gold price forecast for the end of 2026?
Institutional forecasts vary, but J.P. Morgan projects gold reaching approximately $5,055/oz by late 2026, driven by inflation persistence, central bank buying, and geopolitical risk premiums. Near-term technical analysis indicates the price needs to reclaim approximately $5,088/oz to reverse the current eleven-week downtrend.
How does Federal Reserve policy affect gold prices?
Fed policy influences gold primarily through its effect on real yields and the US dollar. Rate increases tend to strengthen the dollar and raise nominal yields, both of which create headwinds. However, historical data from the 2004-2006 tightening cycle demonstrates that gold can rise even during Fed hiking phases if inflation remains elevated enough to keep real yields negative or low.
Why are gold mining stocks outperforming physical gold?
Mining equities benefit from operational leverage. As gold prices rise, the gap between production costs and revenue expands at a faster rate than the metal price itself, amplifying equity returns. Year-over-year through May 2026, major gold miners returned between +37% and +108%, compared to physical gold's +39%.
What role does geopolitical risk play in gold pricing in 2026?
Geopolitical risk has played an analytically counterintuitive role in 2026. Gold has sometimes fallen on escalation news as dollar and oil strength dominated flows. This backward war trade dynamic underscores that geopolitical events are unreliable short-term gold price catalysts. Monetary and currency factors tend to override them within days.
Key Takeaways: Gold Price and Inflation Outlook Summary
- Inflation is running at 2x to 4x the Fed's 2% target on a multi-gauge composite basis through April 2026
- Gold's near-term direction is dominated by dollar strength, yield expectations, and technical momentum, all of which are currently bearish
- Gold has delivered +1,570% since 2001, outperforming the S&P 500 by more than three times on a price-return basis
- Institutional forecasts point to $5,055 to $5,400/oz between late 2026 and end of 2027
- Mining equities are outperforming physical gold, with select names delivering +78% to +134% year-over-year
- The June 17 and July 29, 2026 FOMC meetings are the next critical policy catalysts for gold direction
- The S&P 500 at a 50x P/E ratio and 36 days of extreme overbought conditions represents a potential reallocation catalyst for gold over the medium term
This article is intended for informational purposes only and does not constitute financial or investment advice. Past performance of gold, mining equities, or any asset class is not indicative of future results. Forecasts referenced herein represent third-party institutional views and involve inherent uncertainty. Investors should conduct their own due diligence and consult qualified financial advisers before making investment decisions.
Want To Identify ASX Mineral Discoveries Before the Broader Market Does?
While gold's macro dynamics play out across competing forces of inflation, real yields, and central bank demand, Discovery Alert's proprietary Discovery IQ model delivers real-time alerts on significant ASX mineral discoveries — instantly translating complex data across 30-plus commodities into clear, actionable insights for investors at every experience level. Explore Discovery Alert's dedicated discoveries page to understand how historic mineral discoveries have generated substantial returns, and begin your 14-day free trial today to position yourself ahead of the market.