August 4, 2026
When Clarity Matters More Than Direction: Gold, Rates, and the Psychology of Waiting
There is a widely held assumption in financial markets that uncertainty is gold's best friend. The logic seems intuitive: when the world feels unstable, investors reach for the metal that has preserved wealth across centuries. However, this framing is incomplete in a way that catches even experienced investors off guard. Not all uncertainty is created equal, and gold price interest rate uncertainty is precisely the kind that gold struggles most to navigate.
Monetary policy uncertainty operates through a fundamentally different mechanism than geopolitical risk. When armed conflict escalates or sovereign credit deteriorates, capital flows toward gold as a safe haven because the threat is directionally clear. When the Federal Reserve sends mixed signals about its rate path, however, the threat has no clear direction at all, and that ambiguity produces something more damaging than outright bearishness: paralysis.
When big ASX news breaks, our subscribers know first
The Mechanics of How Rate Confusion Suppresses Gold
Gold generates no income. It pays no coupon, distributes no dividend, and carries no yield. This structural characteristic means that its attractiveness relative to other assets is always measured against what investors could earn elsewhere. When interest rates rise, or are credibly expected to rise, the opportunity cost of holding a zero-yield asset increases. Furthermore, the relationship is more nuanced than a simple inverse correlation.
The transmission from Federal Reserve signals to gold prices follows a recognisable sequence:
- Fed rhetoric shifts toward tightening – Bond markets reprice yields upward in anticipation, often before any formal action.
- Real interest rates rise – When nominal yields climb faster than inflation expectations, the real rate of return on alternatives to gold increases materially.
- The US dollar strengthens – A stronger dollar raises the effective cost of gold for buyers operating in other currencies, suppressing global demand volumes.
- Futures positioning unwinds – Speculative traders holding long positions in gold futures reduce exposure, creating technical selling pressure that amplifies the fundamental headwind.
- Retail sentiment deteriorates – Physical buyers step back, new account openings slow, and the investor base that drove the preceding rally begins to erode.
- Price weakness becomes self-reinforcing – Until a definitive macro catalyst intervenes, the cycle feeds on itself.
What makes the current environment particularly challenging is that this sequence has not been triggered by a clear Fed pivot to tightening. It has been triggered by confusion about which direction policy will move. That distinction is critical: in a confirmed tightening cycle, investors can at least position defensively with conviction. In a fog of contradictory signals, positioning becomes guesswork.
Understanding gold and bond dynamics is therefore essential context for any investor attempting to read the current cycle accurately.
The anticipation phase of a rate cycle is historically more damaging to gold prices than the rate hike itself. Markets price expectations, not just outcomes, and when expectations are unstable, gold has no anchor.
Reading the Sentiment Data: What July 2026 Actually Tells Us
BullionVault's Gold Investor Index, which has tracked the ratio of gold buyers to sellers on the platform since 2009, provides one of the most granular real-time sentiment gauges available for retail precious metals investors. Unlike futures positioning data from the CFTC, which reflects institutional and speculative activity, the Gold Investor Index captures the behaviour of private investors holding physical metal in allocated storage.
The July 2026 reading tells a story of accelerating disengagement rather than decisive bearishness.
| Metric | Data Point | Context |
|---|---|---|
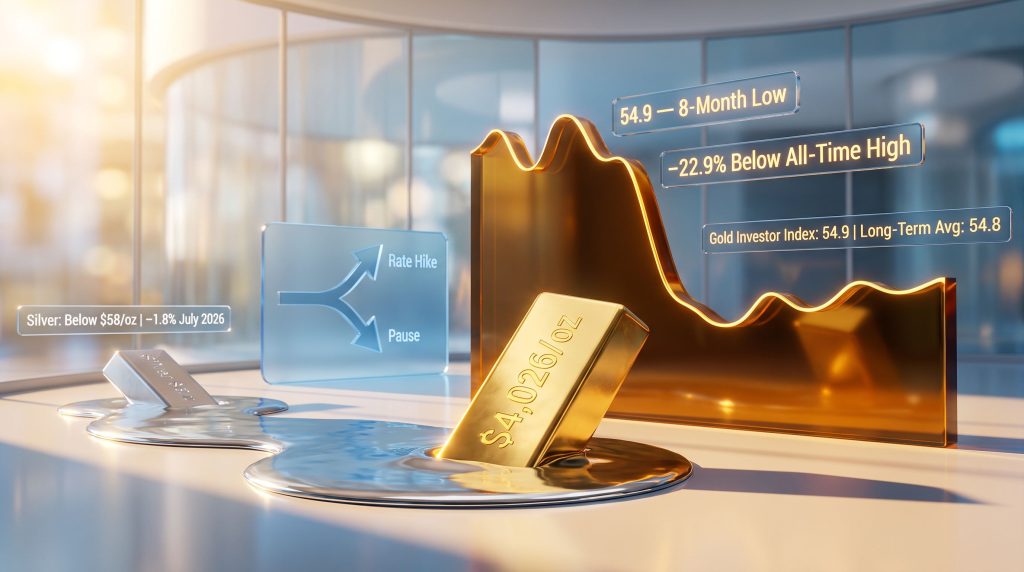
| Gold Investor Index (July 2026) | 54.9 | 8-month low |
| Long-term Index Average | 54.8 | Near-baseline reading |
| Post-Pandemic Index High | 60.7 | Reached March 2026 |
| Monthly Change in Buyer Count | -25.8% | Fewest buyers since August 2025 |
| Monthly Change in Seller Count | -22.7% | 11-month low in sellers |
| Gold Price (July 2026 close) | ~$4,026/troy oz | Flat month-on-month |
| Decline From All-Time High | -22.9% | Below February 2026 record |
| Net Gold Sold by Weight (July) | 75 kg net outflow | Total holdings: 43.5 tonnes |
The most analytically significant detail in this dataset is not that buying fell sharply. It is that selling fell almost as sharply. A market in a genuine structural bear phase sees sellers accelerate as buyers retreat. What July 2026 describes instead is a simultaneous withdrawal from both sides of the trade, which is the behavioural fingerprint of investors who have no conviction about the next move in either direction.
This kind of market paralysis typically resolves in one of two ways: a sharp recovery driven by a clarifying macro event, or a continuation of the downtrend if uncertainty persists. The resolution depends almost entirely on when and how the Federal Reserve communicates a definitive path. Research into what drives gold prices consistently identifies Fed communication clarity as a primary catalyst for directional resolution.
New account openings on the platform fell 30.4% from June, reaching the lowest count since January 2025, though the figure still represented the fifth strongest July in the platform's two-decade history. This detail is worth noting: even in a period of significant price weakness and sentiment retreat, the absolute level of interest in physical gold ownership remains historically elevated compared to the pre-2020 baseline.
Is This a Structural Bear Market or a Cyclical Correction?
The most important question for gold investors right now is whether the decline from February 2026's all-time high represents a temporary consolidation or the beginning of a multi-year bear market. Historical precedent offers a useful, if imperfect, framework.
Gold's most significant modern bear market unfolded between 2011 and 2015, following a 12-year bull run that began in mid-2000. That correction shared several characteristics with the current environment, but also differed in ways that matter enormously for the price floor analysis.
| Characteristic | Mid-2010s Bear Market | 2026 Correction |
|---|---|---|
| Primary Trigger | Fed tightening cycle signals | Fed rate path confusion |
| Price Behaviour | Multi-year decline from peak | Sharp drop from all-time high |
| Retail Sentiment | Gradual multi-year erosion | Rapid retreat from multi-year highs |
| Central Bank Activity | Mixed/moderate buying | Active buying, though H1 2026 at lowest since 2022 |
| Geopolitical Backdrop | Relatively contained | Structurally elevated |
| Duration at Point of Comparison | 3+ years of decline | Months from peak |
The mid-2010s precedent is instructive because it demonstrates a pattern that has since been validated by researchers studying gold price cycles: the warning phase of monetary tightening tends to inflict more damage on gold than the execution phase. Once rate hikes are confirmed and priced in, the uncertainty premium that suppresses gold dissipates, and the metal can find a sustainable floor.
Critically, gold has not recorded more than two consecutive months of price declines since October 2022, which itself was the longest such losing streak since the historic multi-decade bull market began in mid-2000. This resilience, even in the face of sharp corrections, suggests the structural bull case remains intact beneath the short-term turbulence. For a broader view, the gold price outlook for 2025 and beyond reflects many of these same structural dynamics.
The Central Bank Wildcard: Support With Caveats
One dynamic that did not exist in the mid-2010s bear market to anything like the same degree is the scale and consistency of central bank gold accumulation. Sovereign buyers, particularly from emerging market economies pursuing reserve diversification strategies away from US dollar assets, have demonstrated a repeated pattern of increasing purchases when prices decline.
This creates an asymmetric demand structure during corrections: as retail investors exit, institutional sovereign buyers absorb the supply. The practical effect is a compression of the downside range compared to what historical bear markets without this support floor would imply.
However, the World Gold Council's first-half 2026 data introduced a complicating factor. Central bank gold buying in the first six months of 2026 came in at its lowest level since 2022, introducing meaningful uncertainty about whether the sovereign backstop will be as robust as it proved during earlier phases of the current bull cycle.
Central bank demand has functioned as a structural price floor during retail selling episodes. But the moderation in H1 2026 purchasing volumes means investors should not treat this support as unconditional or unlimited.
The broader de-dollarisation trend driving sovereign gold accumulation remains structurally intact, but the pace of execution is clearly not linear. Investors using central bank buying as a valuation anchor should account for this variability in their scenario modelling.
Silver's Compounded Vulnerability
Silver's price action during this cycle has been even more severe than gold's, and understanding why requires appreciating the metal's dual identity in a way that most retail investors underestimate.
| Metric | Silver Data Point | Context |
|---|---|---|
| Silver Price Drop (Prior Month) | -22.4% | Steepest monthly decline since September 2011 |
| Silver Price (July 2026 Close) | Below $58/troy oz | Lowest in USD terms since November |
| July Price Change | -1.8% | Continued softness after prior crash |
| Silver Investor Index (July) | 53.7 | Down 3.7 points from June's 3-month high |
| Total Silver Holdings (July End) | 1,133 tonnes | Unchanged – buyers matched sellers |
Silver functions simultaneously as a monetary metal and an industrial commodity. Its monetary characteristics make it sensitive to the same rate dynamics that affect gold. Its industrial demand profile, which spans solar panels, electronics, medical applications, and electric vehicle components, makes it additionally sensitive to economic growth expectations.
When rate uncertainty signals the possibility of economic slowdown, silver faces pressure from both channels at once. Its monetary premium contracts alongside gold, while its industrial demand outlook deteriorates if growth projections weaken. In addition, this dual compression explains why silver's percentage drawdown in the preceding month exceeded gold's by a significant margin.
Furthermore, the gold-silver ratio analysis during this period reveals historically wide spreads that signal silver's relative underperformance, and why the recovery path for silver is likely to be more complex and conditional than for gold.
The one constructive signal in the July silver data is that total holdings remained unchanged at 1,133 tonnes, meaning buyers and sellers were perfectly matched by volume even as the index declined. This suggests that existing silver holders are maintaining positions, even if new buying interest has retreated.
The next major ASX story will hit our subscribers first
Seasonal Patterns as an Amplifying, Not Causal, Force
Gold prices have historically exhibited a tendency toward softness during northern hemisphere summer months, typically spanning June through August. The structural drivers of this pattern include reduced institutional trading volumes during holiday periods, thinner futures market liquidity, and the timing of jewellery demand cycles, which tend to strengthen in the autumn ahead of major purchasing events in Asian and Middle Eastern markets.
It is important to understand what the seasonal pattern does and does not explain. It does not cause bear markets, and it does not determine the ultimate direction of a cycle. What it does is amplify existing directional pressure. In a market already contending with gold price interest rate uncertainty and post-crash sentiment damage, the summer doldrums extend the duration of the consolidation.
For long-term investors, this combination of circumstances can actually be constructive. A prolonged period of price stability following a sharp decline allows sentiment to reset gradually, reduces the risk of panic-driven capitulation selling, and creates conditions where patient accumulation at lower prices becomes strategically attractive.
Three Historical Conditions That Have Signalled Gold Price Recoveries
Based on analysis of previous gold price cycles, three conditions have consistently preceded durable recoveries from significant corrections:
- Monetary policy resolution – Either a confirmed pause in the tightening cycle, an explicit pivot toward rate cuts, or the completion of a full hiking cycle that markets can fully price. The transition from ambiguity to confirmed direction has historically been the most reliable recovery signal.
- Geopolitical threshold breach – When geopolitical risk escalates to a severity that overrides rate-driven selling pressure, the safe-haven premium in gold can reassert with sufficient force to reverse bearish momentum. The current geopolitical environment, with elevated sovereign tensions and active de-dollarisation dynamics, means this threshold may be reached sooner than historical averages would suggest.
- Sustained dollar weakness – A meaningful and sustained decline in the US Dollar Index has historically correlated strongly with gold price recoveries. Dollar weakness reduces the effective cost of gold for non-USD buyers, expanding global demand and improving the technical backdrop for prices.
The present cycle is unusual in that the geopolitical backdrop is substantially more complex than during the mid-2010s bear market, which arguably means the absolute price floor in the current correction may be higher than historical precedents would imply. This holds even without a resolution of the gold price interest rate uncertainty question that currently dominates market sentiment.
Academic research has further validated this connection, with studies examining gold and economic uncertainty demonstrating that the nature and type of uncertainty — not merely its presence — is a decisive factor in determining gold's directional response.
Frequently Asked Questions: Gold Price and Interest Rate Uncertainty
Does gold always fall when interest rates rise?
Not in every instance. The relationship is most powerful when measured against real inflation-adjusted rates rather than nominal rates alone. When inflation rises faster than nominal interest rates, real rates remain low or even negative, a condition that has historically supported gold prices even during nominal rate-hiking cycles. The 2022 experience, when gold held relatively well despite aggressive Fed tightening, partly reflected this dynamic in its earlier stages.
Why does Fed confusion damage gold more than a confirmed rate hike?
Because financial markets price expectations rather than outcomes. A confirmed rate hike can be fully priced into positioning before it occurs, removing uncertainty. When the Fed's direction is genuinely unclear, investors cannot confidently adopt either a bullish or bearish posture with conviction, producing the low-activity, range-bound conditions that characterise gold price interest rate uncertainty in its most damaging form.
What does the Gold Investor Index actually measure?
The index tracks the monthly balance between the number of buyers and sellers on the BullionVault platform, which cares for over $7.8 billion in precious metals for more than 130,000 users across 175 countries. A reading above 50.0 indicates more buyers than sellers. It is distinct from CFTC futures positioning reports and provides insight into retail physical investor behaviour rather than speculative or institutional activity.
How significant is central bank buying as a price floor mechanism?
Central bank demand has functioned as a meaningful structural support during retail selling episodes in recent years. However, the moderation in first-half 2026 purchasing volumes to the lowest level since 2022 introduces uncertainty about how much downside protection this mechanism provides in the current phase. The underlying de-dollarisation trend remains intact, but the pace of sovereign accumulation is variable.
Is silver more or less attractive than gold during rate uncertainty?
Silver's dual role as both monetary and industrial metal makes it structurally more volatile during periods of rate uncertainty. It tends to underperform gold when monetary conditions tighten or growth outlooks weaken, but can significantly outperform during strong economic expansions where industrial demand accelerates. For risk-adjusted positioning during the current cycle, this asymmetry is a critical consideration.
This article is intended for informational purposes only and does not constitute investment advice. Precious metals prices can fall as well as rise. Past performance and historical patterns do not guarantee future outcomes. Readers should seek independent financial advice before making any investment decisions. Data referenced relates to BullionVault platform activity and the Gold Investor Index as reported in August 2026.
Want to Know When the Next Major ASX Mineral Discovery Is Announced?
While gold price sentiment navigates the fog of monetary policy uncertainty, Discovery Alert's proprietary Discovery IQ model cuts through the noise by delivering real-time alerts on significant ASX mineral discoveries — transforming complex data across 30-plus commodities into clear, actionable insights for both traders and long-term investors. Explore how historic discoveries have generated substantial returns, then begin your 14-day free trial at Discovery Alert to position yourself ahead of the market.