July 28, 2026
Why the Second Half of 2026 May Define Gold's Next Major Chapter
Precious metals markets have a long history of confounding the majority at precisely the wrong moment. Consolidations get misread as reversals. Profit-taking phases trigger capitulation. And the investors who exit during periods of historically elevated prices often do so just before the next leg higher begins. Understanding this pattern is not merely an academic exercise; it is the central analytical challenge facing anyone trying to navigate the gold price outlook in the second half of 2026.
The first half of this year was extraordinary by almost any historical measure. Gold opened 2024 near $2,000 per ounce, climbed to approximately $2,600 by early 2025, surged to a record high of roughly $5,500 in January 2026, and has since pulled back to the $4,100 to $4,300 range as of early July 2026. That correction represents a decline of approximately 22 to 25% from the January peak, which has unsurprisingly reignited the familiar debate: has gold topped, or is this a pause before the next advance?
To answer that question properly requires a structured framework rather than a reaction to short-term price action. The analysis here is built across three lenses: the macroeconomic structural forces shaping global capital allocation, the geopolitical risk architecture sustaining safe-haven demand, and the investor behavioural dynamics that determine when fear translates into buying pressure.
When big ASX news breaks, our subscribers know first
Reading the 2025 Price Cycle as a Blueprint for 2026
The Three-Phase Pattern That Keeps Repeating
One of the most instructive tools available to gold investors right now is the 2025 price cycle itself. That year followed a recognisable three-phase structure that, when viewed in retrospect, provides a compelling parallel to current conditions.
- Phase 1 (January to March 2025): Gold moved rapidly from approximately $2,600 to around $3,500, powered by a combination of genuine macroeconomic anxiety, geopolitical stress, and speculative momentum that occasionally ran ahead of fundamentals.
- Phase 2 (April to August 2025): A consolidation phase developed between roughly $3,100 and $3,500. During this period, many market participants called the top, pointing to the pullback as evidence that the bull market had exhausted itself.
- Phase 3 (September 2025 to January 2026): After the distressed selling pressure abated and the underlying demand drivers reasserted themselves, gold broke decisively higher, ultimately reaching $5,500 by January 2026.
The consolidation period in mid-2025 was widely misread as a structural reversal. In reality, the same macroeconomic and geopolitical conditions that drove Phase 1 had not resolved. They had merely paused in their market impact. The same analytical logic applies to the current pullback.
Why $4,100 Is Not the Disaster It Appears to Be
A crucial contextual point is often missing from the current commentary around gold's price retreat. $4,100 per ounce is dramatically higher than any price level seen before the fourth quarter of 2025. The consolidation is happening at historically unprecedented levels. Furthermore, the gold price forecast from leading analysts continues to reflect this bullish structural backdrop.
| Period | Peak Price | Consolidation Range | Subsequent Direction |
|---|---|---|---|
| April to August 2025 | ~$3,500 | $3,100 to $3,500 | Broke higher to $5,500 |
| Current H1 2026 | ~$5,500 | ~$4,000 to $4,250 (est.) | Analysts lean bullish for Q4 |
For gold's bull market to be genuinely over, the underlying drivers of demand would need to have materially reversed. The evidence that those conditions have improved in any durable sense is not compelling.
What Major Banks Are Forecasting for Gold in H2 2026
Institutional Price Targets Across the Spectrum
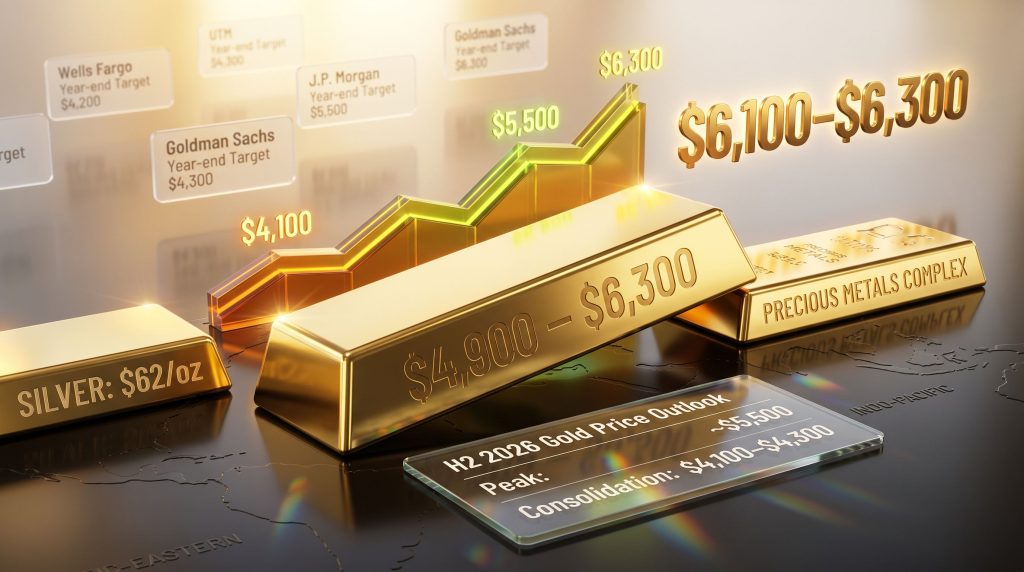
Despite the near-term consolidation, the institutional consensus for the gold price outlook in the second half of 2026 remains broadly bullish. Major financial institutions have published year-end 2026 targets that reflect a wide range of assumptions about Federal Reserve policy, geopolitical risk, and ETF demand recovery. For additional context, the World Gold Council's gold outlook for 2026 provides a comprehensive institutional perspective on these dynamics.
| Institution | Year-End 2026 Target | Key Assumptions |
|---|---|---|
| Wells Fargo | $6,100 to $6,300 | Strongly bullish; bull case extends to $8,000 |
| J.P. Morgan | ~$6,000 (up to $6,300) | Central bank buying and ETF recovery in Q4 |
| Bank of America | $6,000 | Bull case to $8,000 under maximum flow assumptions |
| UBS | $5,500 (upside $7,200) | Upside tied to intensified geopolitical escalation |
| Goldman Sachs | $4,900 to $5,400 | Trimmed targets on hawkish Fed signals; still directionally bullish |
| Morgan Stanley | $5,200 | Revised down from $5,700; elevated real yields cited |
| OCBC / BMO Capital | $4,300 to $4,600 | Most cautious; USD strength and rising yields as headwinds |
What Separates the Most Bullish from the Most Cautious
The divergence in institutional forecasts is not random. It maps directly onto differing assumptions about a small number of key variables.
Bull case drivers:
- Continued central bank gold demand at or above current rates
- Recovery in ETF inflows, which have been subdued through mid-2026
- One or more geopolitical risk events forcing renewed safe-haven demand
- Federal Reserve pivot toward rate cuts before year-end
Measured and bear case assumptions:
- The Fed delays meaningful rate cuts to 2027 due to persistent inflation
- The US dollar remains structurally strong, creating a headwind for USD-denominated gold
- ETF inflows remain anaemic through Q3, limiting institutional buying pressure
- Geopolitical tensions partially de-escalate, reducing the safe-haven premium
Investors should treat all institutional price targets as scenario-based projections, not certainties. Market conditions can shift rapidly, and forecasts from major banks carry inherent uncertainty, particularly over a six-month horizon.
The Macroeconomic Case for Gold in the Second Half of 2026
A Global Debt Problem With No Simple Resolution
The debt overhang supporting gold demand is not a uniquely American phenomenon. It is a global structural condition affecting sovereign governments, corporations, and consumers simultaneously. In the United States, an unusual data point emerged in May 2026: consumer spending growth and income growth aligned for the first time in well over a year. The significance of that anomaly is what it implies about the preceding period, namely that consumption had been funded primarily by accelerating household borrowing since at least early 2025.
Across major economies, deteriorating debt-to-GDP ratios create a persistent structural argument for gold as a non-sovereign store of value, one that cannot be printed, diluted, or defaulted upon by a single government decision.
Inflation, Oil, and the Stagflationary Undertow
Inflation has not returned to central bank targets across most major developed economies as of mid-2026. Oil price dynamics represent a secondary but meaningful inflation driver: elevated energy costs compress discretionary consumer spending, reduce corporate margins, and historically correlate with increased gold safe-haven demand.
The relationship between oil and gold is directionally positive but structurally loose. There is no fixed ratio between them, regardless of how frequently such a ratio is cited in market commentary. The current gold-to-oil ratio, at approximately 70 barrels of oil per ounce of gold, is at historically elevated levels reflecting gold's outperformance, but this does not mechanically imply that either gold must fall or oil must rise to restore some historical norm. Sometimes the world changes, and relationships that held for decades shift to new equilibria.
The period from roughly 1968 to the early 2000s saw the gold-to-oil ratio trade in a range of approximately 10 to 35 barrels per ounce. The move to 70 barrels is significant but should be understood as a reflection of gold's structural remonetisation, not as a valuation signal implying imminent mean reversion.
Periods characterised by simultaneous inflation persistence and growth deceleration, what economists describe as stagflationary environments, have historically been among the most constructive backdrops for gold prices. Slowing employment growth reduces consumer confidence, increases precautionary savings behaviour, and shifts capital toward defensive assets.
The Interest Rate Relationship: Far Weaker Than Believed
One of the most persistently misunderstood aspects of gold market analysis is the relationship between real interest rates and gold prices. The correlation coefficient between changes in real gold prices and changes in real interest rates is approximately negative 27%. However, the figure that rarely gets discussed is the R-squared, which represents explanatory power: at approximately negative 7%, it implies that changes in real interest rates explain only around 7% of real gold price movements.
This is a far weaker relationship than is commonly portrayed in retail precious metals media, where rising rates are frequently cited as a near-certain headwind for gold. The reality, visible in scatter plot analysis of long-term data, is that gold and interest rates move in all directions relative to each other across different time periods. The relationship exists, but it is one input among many, not a dominant determinant.
The Geopolitical Architecture Sustaining Safe-Haven Demand
Multiple Simultaneous Flashpoints With No Near-Term Resolution
The geopolitical risk environment entering H2 2026 is not a single-event risk story. It is a multi-front, multi-actor set of overlapping uncertainties that collectively sustain elevated investor demand for gold as a neutral reserve asset.
| Risk Event | Timeline | Gold Market Implication |
|---|---|---|
| US-Iran ceasefire expiry | Mid-August 2026 | High: potential demand spike if hostilities resume |
| US midterm election cycle positioning | Q3 to Q4 2026 | Medium: political uncertainty supports safe-haven flows |
| China-Taiwan escalation risk | Ongoing | High: any escalation triggers broad safe-haven demand |
| Ukraine-Russia war trajectory | Ongoing (now exceeding 4 years) | Medium: sustains a persistent baseline risk premium |
| Federal Reserve policy decisions | Q3 to Q4 2026 | High: rate cut timing is the primary tactical variable |
The US-Iran ceasefire is particularly significant. Its expiry in mid-August 2026 creates a binary risk event at a politically sensitive moment, just as the United States moves closer to its midterm election cycle. The gap between what the US administration and the Iranian government each consider an acceptable permanent settlement is substantial, creating meaningful uncertainty around whether hostilities could resume.
Beyond Bifurcation: The Tripartite World Order
Much commentary about the global geopolitical and economic realignment frames the world as bifurcating into a US-aligned bloc and a China-aligned bloc. This framing understates the actual complexity of what is occurring. A more accurate description is tripartite fragmentation: China, the United States, and a large non-aligned bloc that is increasingly trading with China while maintaining independence from both major powers.
This structural shift carries long-term implications for dollar reserve dominance. As more of global trade is conducted outside dollar-denominated systems, gold's role as a neutral reserve asset that no single nation controls gains structural importance. This is not a short-term trading thesis; it is a decade-long realignment that provides a durable floor under institutional gold demand.
Petrodollar Recycling Into Gold
Russia's policy preference for holding monetary reserves in gold rather than US dollars or euros is well-documented. This preference intensifies when oil export revenues are elevated, creating a petrodollar-to-gold recycling dynamic that supports prices during periods of high energy revenues. Several other state-owned oil producers share a similar structural proclivity, meaning that elevated oil prices can simultaneously increase safe-haven buying pressure and direct state-level capital flows into gold markets.
Tactical Price Outlook: The Two-Phase H2 2026 Scenario
Phase One (July to September): Elevated but Range-Bound
The near-term expectation for gold is continued consolidation at historically elevated levels. A trading range of approximately $4,000 to $4,250 appears likely through the early months of H2. Technical analysts note $3,500 as a realistic downside floor if Federal Reserve rate-cut expectations are materially scaled back, though reaching that level would require a significant shift in the current macro narrative.
This phase mirrors the April-to-August 2025 consolidation. A key observation from that period: the distressed selling that had been flooding dealer markets and refineries with old silver coins, medallions, and small investor bars gradually exhausted itself. When that selling pressure abated, the path of least resistance reasserted itself to the upside. A similar dynamic is expected to play out in 2026.
Phase Two (October to December): Potential Re-Acceleration
The institutional consensus points to a Q4 recovery and potential breakout, driven by a convergence of factors:
- Renewed ETF inflow activity as risk aversion increases
- Continued central bank accumulation, particularly from non-Western reserve managers
- Geopolitical risk events re-entering market consciousness as the ceasefire expiry approaches and then passes
- Possible signals from the Federal Reserve regarding the trajectory of rate policy into 2027
Year-end targets across major institutional forecasters cluster in the $5,200 to $6,300 range, with bull case scenarios extending to $8,000 under maximum demand flow assumptions.
The next major ASX story will hit our subscribers first
Regional Market Dynamics: India, China, and Emerging Complexities
India: Sophistication, Not Weakness
Indian investors have been net sellers of gold and silver in recent months, a response to elevated prices and expectations of further near-term correction. This is rational behaviour from a sophisticated investor base, not evidence of structural demand weakness. The expected wave of profit-taking should subside as prices stabilise.
A development of longer-term significance: the Multi Commodity Exchange (MCX) in Mumbai recently approved several new Indian refineries as recognised good-delivery sources for the domestic market. This represents a meaningful step toward greater Indian market self-determination in precious metals pricing.
It is worth clarifying a persistent misconception: the Indian gold price is not a derivative of the London price. It is determined by Indian market supply and demand conditions. London pricing has an influence, but the relationship involves premiums and discounts that reflect independent domestic dynamics, not subordination to an external benchmark. As India's investor base grows more sophisticated, this independence will become increasingly visible.
China: Regulatory Caution, Not Price Manipulation
Several Chinese government entities and commercial banks have recently pulled back from selling gold-linked derivative securities to retail investors. This policy response is driven by concerns about retail investor losses during a period of elevated gold price volatility. China's longstanding policy of encouraging citizens to hold physical gold as a savings vehicle and wealth diversifier remains intact.
The distinction matters enormously for investors trying to understand what is happening: physical gold demand in China is structurally supported. It is the derivative product layer that is being temporarily restricted in response to short-term volatility risk, not some coordinated strategy to alter global gold price discovery mechanisms. Narratives suggesting China is engineering a takeover of gold pricing through Shanghai are not supported by the available evidence.
Key Risks That Could Derail the Bullish Thesis
Warning: The bullish consensus for gold in H2 2026 carries meaningful risks that investors should stress-test before increasing exposure. Elevated prices in any asset class create the potential for sharper-than-expected corrections if underlying assumptions prove incorrect.
- Hawkish Federal Reserve overshoot: If the Fed signals rate cuts will not materialise until 2027 or later, real yields could remain elevated long enough to suppress gold's non-yielding asset appeal in institutional portfolios.
- ETF inflow stagnation: Institutional ETF demand has been subdued through mid-2026. A failure to recover this demand source could limit the scale of any price recovery regardless of other bullish factors.
- Structural US dollar strength: A sustained rally in the US dollar index creates a direct mechanical headwind for gold priced in USD terms, reducing purchasing power parity appeal in non-US markets.
- Genuine geopolitical de-escalation: A durable resolution to one or more major conflict theatres would erode the safe-haven premium embedded in current gold prices, potentially triggering a sharper consolidation.
- Misinformation-driven poor decisions: The quality of publicly available precious metals analysis has deteriorated. Investors acting on promotional hype, fixed-ratio arguments, or oversimplified interest rate narratives risk both excessive bullishness at peaks and panic selling during consolidations.
The misinformation issue deserves specific emphasis. The proliferation of inaccurate market analysis in precious metals media, including claims about fixed gold-to-oil ratios, simple interest rate correlations as price predictors, and narratives about China capturing global gold price discovery, creates a measurable market risk. Investors who build positions on incorrect analytical foundations are more likely to behave irrationally when conditions shift.
Precious Metals Comparison: Gold, Silver, Platinum, and Palladium
| Metal | Price (Early July 2026) | H2 2026 Outlook | Primary Risk |
|---|---|---|---|
| Gold | ~$4,174/oz | Consolidation to potential Q4 breakout | Fed hawkishness, USD strength |
| Silver | ~$62/oz | Similar pattern to gold; dual demand role | Industrial demand slowdown |
| Platinum | ~$1,656/oz | Likely to test $1,500 support; sideways to higher in Q4 | Industrial exposure, no monetary heritage equivalent to gold/silver |
| Palladium | ~$1,280/oz | Continued pressure | Auto catalyst demand shifts, EV transition |
Platinum and palladium face a structurally different risk profile from gold and silver. Unlike the monetary metals, they lack the multi-millennia history as currency equivalents and stores of wealth. Their price performance is more tightly coupled to industrial demand cycles, particularly automotive manufacturing. Furthermore, monitoring the gold-silver ratio remains a useful signal for assessing relative value between the two primary monetary metals during periods of market volatility.
Sodium-Ion Batteries and the Base Metals Disruption Nobody Is Discussing Enough
A Technology Shift Accelerating Faster Than Expected
Sodium-ion battery technology is commercialising at a pace that has surprised many commodity analysts. Three or four years ago, this was largely a longer-term research topic. Today, sodium-ion batteries are actively taking market share in several applications:
- Stationary power storage systems for off-peak electricity storage
- Two-wheel electric vehicles including e-bikes and mopeds
- Smaller electric vehicle segments
Key manufacturers including BYD and CATL are investing heavily in pushing sodium-ion energy density to the point where the technology can compete with lithium-ion in larger electric vehicles and hybrid platforms.
Why This Matters for Battery Metal Investors
Sodium-ion batteries require none of the supply-constrained materials that underpin lithium-ion battery economics. They contain no lithium, cobalt, manganese, or nickel, eliminating both the supply constraint and the thermal runaway and combustion risks associated with liquid electrolyte lithium-ion technology.
The commodity market implications are significant and unevenly distributed. In addition, understanding the broader battery metals outlook is increasingly important for investors seeking to position across both precious and industrial commodities.
| Metal | Sodium-Ion Impact |
|---|---|
| Nickel | Near-term price strength possible, but long-term demand growth may be capped |
| Cobalt | Structural demand risk if sodium-ion scales into larger vehicle segments |
| Copper | Remains strong regardless; demand driven by grid infrastructure and electrification, not battery chemistry |
| Tin | Likely sideways trajectory |
| Aluminium | Modest price softening expected |
| Lead / Zinc | Broadly stable |
Copper's insulation from the sodium-ion disruption is particularly noteworthy for commodity investors. Because copper demand is driven by electrical grid infrastructure and broader electrification, rather than specific battery chemistry, it remains a structurally supported commodity regardless of which battery technology ultimately dominates.
Frequently Asked Questions: Gold Price Outlook H2 2026
Will gold reach a new all-time high in 2026?
The majority of major institutional forecasters, including J.P. Morgan, Wells Fargo, and Bank of America, maintain year-end 2026 targets that would represent new all-time highs. Whether those targets are achieved depends primarily on the Federal Reserve's rate trajectory, the evolution of geopolitical risk through Q4, and the recovery of ETF inflow demand. According to J.P. Morgan's commodity research, central bank buying and ETF recovery remain the primary catalysts for any Q4 breakout. The structural case for the gold price outlook in the second half of 2026 is bullish; however, the tactical outcome remains scenario-dependent.
Is the gold-to-oil ratio a reliable price signal?
No. The gold-to-oil ratio is an interesting historical data series but it does not imply a fixed relationship that must revert to any particular level. The ratio has moved from a range of 10 to 35 barrels per ounce over much of the post-1968 free-market era to approximately 70 barrels today. This reflects gold's structural outperformance, not a valuation anomaly that must mechanically correct.
How should investors approach the current consolidation?
With patience, scepticism toward promotional narratives, and a clear understanding of their own time horizon. The current pullback is occurring at price levels that would have been considered extraordinary as recently as late 2025. Investors who understand the structural drivers of gold demand and can tolerate short-term volatility are in a fundamentally different position from those reacting to price movements alone.
This article is intended for informational and educational purposes only. It does not constitute financial advice. All price forecasts and institutional targets cited are subject to change and carry inherent uncertainty. Readers should conduct independent research and consult qualified financial advisers before making investment decisions.
Want to Know the Moment the Next Major ASX Mineral Discovery Hits the Market?
Discovery Alert's proprietary Discovery IQ model scans ASX announcements in real time, delivering instant alerts on significant mineral discoveries across gold, battery metals, and beyond — transforming complex data into actionable opportunities for investors at every level. Explore how historic discoveries have generated extraordinary returns on the Discovery Alert discoveries page, then start your 14-day free trial to position yourself ahead of the broader market.