
August 6, 2026
Real Yields, Reserve Architecture, and What the 2026 Gold Correction Actually Tells Us
Most investors approach a price chart looking for signals. But gold, more than almost any other asset, rewards those who look past the chart entirely. The price of gold at any given moment is less a reflection of supply and demand in the conventional sense and more a readout of confidence in the broader monetary system. When that confidence is high, real yields rise, paper assets compete effectively with physical metal, and gold retreats. When confidence fractures, the dynamic reverses. Understanding which of those two states is actually operating in July 2026 is the entire analytical exercise.
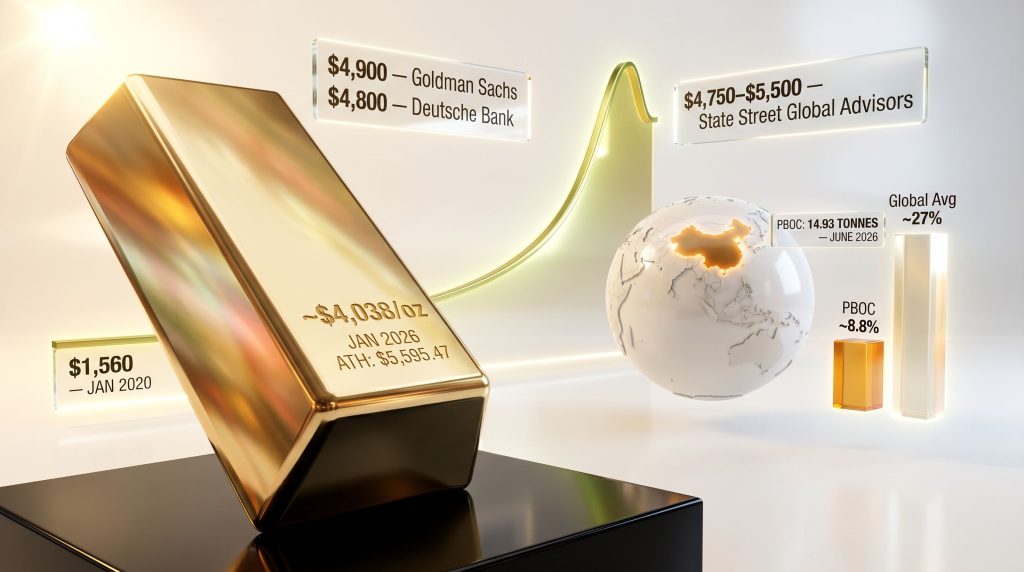
The gold price outlook in July 2026 cannot be assessed honestly by staring at a 28% drawdown from January's record high. That framing selects a peak as its starting point and treats the correction as the complete story. A more instructive baseline is January 2020, when gold traded near $1,560 per ounce. Measured from that point to today's price of approximately $4,038, the six-year return approaches 160% even after absorbing the full extent of the 2026 pullback. The question worth investigating is not why gold fell from its record. The question is whether the conditions that drove that record have changed.
When big ASX news breaks, our subscribers know first
Where Gold Stands in July 2026: Context Before Price
Gold's spot price as of July 13, 2026 sits near $4,038 per ounce, representing a decline of approximately 28% from the intraday record of $5,595.47 reached on January 29, 2026, according to World Gold Council mid-year data. In raw magnitude, this ranks as the steepest quarterly decline in 13 years. Placed alongside historical precedent, however, the picture shifts considerably.
| Correction Period | Drawdown Magnitude | Duration | Structural Outcome |
|---|---|---|---|
| 2008 Financial Crisis | ~30% | ~8 months | New bull cycle followed |
| 2011–2015 Bear Market | ~45% | ~4 years | Structural demand shift required |
| 2020 Post-Peak | ~15% | ~3 months | Rapid recovery |
| 2026 (current) | ~28% | ~5.5 months | Structural supports intact |
The World Gold Council's historical data identifies seven comparable pullbacks within broader structural uptrends going back decades. What distinguishes the 2026 episode from the 2011 to 2015 bear market, which inflicted far greater damage over a far longer period, is the behaviour of institutional buyers during the decline. In prior cycles, demand from sovereign reserve managers tended to moderate during major corrections. In 2026, it accelerated. That distinction carries meaningful analytical weight.
The Transmission Chain: Why Gold Actually Fell
Much of the commentary around gold's correction has leaned on vague concepts like risk appetite or macro uncertainty. The actual mechanism is more precise, and understanding it is essential because the same process operates in reverse when conditions change.
The causal sequence works as follows:
-
The US-Iran conflict escalated in February 2026, disrupting energy supply routes and driving oil prices sharply higher.
-
Energy-driven inflation pushed US CPI to 4.2% year-over-year by May 2026, according to the Bureau of Labor Statistics release dated June 10, 2026.
-
Elevated inflation shifted Federal Reserve policy expectations toward additional rate hikes rather than the cuts that had been priced into markets through late 2025.
-
Rate-hike expectations pushed up real Treasury yields, which represent the return available on government bonds after adjusting for inflation expectations. The relationship between gold and bond markets is central to understanding this dynamic.
-
Rising real yields raised the opportunity cost of holding gold, a non-yielding asset, and the price moved lower in response.
Every 10 basis points of real yield increase raises the relative cost of holding gold versus an interest-bearing instrument. The mechanism is not emotional. It is mathematical. And it runs in both directions.
This framework carries a critical implication: the same inputs that compressed gold's price are also capable of reversing it. A softer inflation reading reduces rate-hike expectations, compresses real yields, and removes the primary headwind. None of this requires a change in gold's fundamentals. It only requires a change in the inflation data.
The Federal Reserve's Position and Its Structural Ceiling
The Federal Reserve held rates at 3.50%–3.75% at its June 16–17 meeting in a unanimous 12-to-0 vote. The consensus on the vote, however, obscured a significantly divided forward outlook. Of the 18 participants who submitted rate projections, nine anticipated at least one hike before year-end, eight projected no change, and one anticipated a reduction.
Chair Kevin Warsh did not submit a dot himself, a deliberate signal that the path ahead remains genuinely uncertain, according to the Federal Reserve's FOMC Summary of Economic Projections published June 17, 2026.
Market pricing via the CME Group FedWatch Tool in early July 2026 assigned approximately 20% probability to a hike at the July 28–29 meeting and roughly 60% odds of at least one hike by September. Gold fell to around $4,075 on the release of the June minutes, confirming the hawkish lean had not been fully anticipated.
| FOMC Meeting | Hike Probability (Early July 2026) | Gold Price Implication |
|---|---|---|
| July 28–29, 2026 | ~20% | Hold is base case; surprise hike = significant shock |
| September 2026 | ~60% (at least one hike) | Primary risk event for gold in H2 |
| Year-end 2026 | 0–1 hike majority view | Limits ceiling on real yield pressure |
Source: CME Group FedWatch Tool, July 2026
What the standard rate-hike narrative consistently underweights is the structural constraint operating on the Fed's freedom of movement. Total US gross national debt stood at $39.39 trillion as of July 6, 2026, according to the US Treasury Fiscal Data API. At the current average interest rate of 3.41% on outstanding marketable debt, annual interest expense already exceeds $1 trillion, or approximately $2.9 billion per day. A central bank that aggressively tightens into this environment compounds the Treasury's own borrowing burden simultaneously.
This does not prevent rate hikes. But it establishes a practical ceiling on how far and how long a tightening cycle can persist before fiscal stress becomes the dominant concern. For investors with multi-year horizons, this structural ceiling is analytically more significant than any single FOMC meeting outcome.
What Major Institutions Are Forecasting for H2 2026
Institutional forecasters revised significantly downward through Q2 2026 following the Fed's hawkish pivot, yet nearly all major targets remain above the current spot price. Furthermore, the distribution of year-end gold price forecasts is instructive.
| Institution | Q3 2026 Target | Year-End / Q4 2026 Target | Key Rationale |
|---|---|---|---|
| Goldman Sachs | Not specified | $4,900 base; $4,400 bear | Hawkish Fed; fading ETF inflows; central bank floor |
| JPMorgan | $4,300 average | $4,500 | Real yield sensitivity; physical demand as structural support |
| Deutsche Bank | $4,300 average | $4,800 | Central bank demand pillar remains strong |
| State Street Global Advisors | Not specified | $4,750–$5,500 (70% scenario) | Record global debt of $353 trillion; monetary hedge demand |
| World Gold Council (fair value) | $3,895–$4,305 range | Consolidation base case | Real yield, inflation, USD, and central bank demand inputs |
Sources: Goldman Sachs Global Commodities Research, June 2026; J.P. Morgan Global Research, July 3, 2026; Deutsche Bank Research, June 2026; State Street Global Advisors July 2026 Monthly Gold Monitor; World Gold Council Gold Mid-Year Outlook 2026
Goldman Sachs noted that central bank gold demand in the range of 60 tonnes per month provides a structural price floor, and that institutional demand driven by fiscal deficit concerns, a category the bank describes as the debasement trade, represents a new form of demand not present in prior gold cycles. JPMorgan described gold as sitting in technical no-man's land between the 200-day moving average near $4,340 and the 50-day moving average near $4,730 following its downward revision of roughly 25% in its Q4 target from $6,000 to $4,500 on July 3, 2026.
The World Gold Council's mid-year report, titled Point Break and published July 1, 2026, applies a Gold Valuation Framework linking price to four inputs: real yields, inflation expectations, the US dollar index, and central bank demand. Under a base-case assumption of one Fed hike before October and US inflation peaking near 3.9% in Q2, the model produces a fair value of approximately $4,100 per ounce within a ±5% tolerance band, implying a range of $3,895 to $4,305. The WGC's historical analysis suggests that gold declines exceeding 10% have consistently attracted countercyclical buyers, limiting further downside from current levels to approximately 15% in their framework.
Central Bank Buying: The Structural Floor That Did Not Waver
Perhaps the most analytically significant data point in the entire July 2026 gold picture has nothing to do with price charts or inflation expectations. It concerns what sovereign reserve managers did while the price was falling.
The People's Bank of China added 14.93 tonnes, approximately 480,000 troy ounces, to its gold reserves in June 2026, according to Bloomberg reporting dated July 7, 2026, and confirmed by the South China Morning Post. This represented the 20th consecutive month of purchases, a streak that began in November 2024, and the largest single-month addition since October 2023. Total PBOC gold holdings reached 75.44 million troy ounces, equivalent to roughly 2,346 tonnes. The June purchase occurred while gold was trading near its quarterly lows, providing direct evidence that sovereign buyers treat price weakness as an allocation opportunity rather than a warning signal.
The structural logic behind the buying streak becomes clearer when examined through a reserve allocation lens:
| Reserve Manager | Gold as % of Total FX Reserves |
|---|---|
| Global central bank average | ~27% |
| People's Bank of China | ~8.8% |
| Gap to global average | ~18.2 percentage points |
China's gold allocation at 8.8% of total foreign exchange reserves sits dramatically below the global central bank average of approximately 27%, a figure drawn from the European Central Bank's International Role of the Euro report published June 2, 2026. That same report highlighted a landmark structural shift: for the first time at end-2025, gold surpassed US Treasuries, which held a 22% share, as the largest single category of global official reserves. Consequently, ECB President Christine Lagarde attributed the shift to sustained geopolitical tensions continuing to drive sovereign demand for gold in the monetary system.
The gap between China's 8.8% allocation and the 27% global benchmark is not incidental. It represents a quantifiable runway for continued accumulation. A reserve manager closing that gap over a decade would require purchasing several hundred additional tonnes beyond its current pace. The World Gold Council's 2026 Central Bank Gold Reserves Survey found that 89% of global central banks expect official gold reserves to increase over the following 12 months, with a record 45% planning to increase their own holdings. Since 2022, central bank net purchases have averaged approximately 1,000 tonnes annually, absorbing roughly 20–25% of total annual mine supply and establishing a persistent demand floor with no equivalent in prior gold market cycles.
The next major ASX story will hit our subscribers first
Technical Levels Defining the July 2026 Price Range
From a technical standpoint, gold's near-term price structure is defined by a cluster of resistance levels above and two meaningful support zones below current prices.
| Level Type | Price Zone | Significance |
|---|---|---|
| Major resistance | $4,250 | First hurdle for recovering momentum |
| Strong resistance | $4,320 | Break above signals recovery trajectory |
| 200-day moving average | ~$4,340–$4,491 | Critical pivot; gold testing this zone |
| 50-day moving average | ~$4,730 | Upper technical target in recovery scenario |
| Bullish reversal confirmation | $4,580 | Signals sustained uptrend resumption |
| Immediate support | $4,000 | Psychological and technical floor |
| Secondary support | $3,940 | Next level if $4,000 fails |
| WGC lower bound / bear case | $3,800–$3,910 | Outer downside scenario range |
Three distinct price scenarios are plausible from current levels:
Scenario 1: Bearish Continuation
- Trigger: June CPI above 4.0% or surprise July FOMC hike
- Path: Gold fails to hold $4,250 resistance, tests $3,940, potential extension toward $3,800
- Limiting factor: WGC notes countercyclical sovereign buying historically caps downside beyond approximately 15% from established support
Scenario 2: Rangebound Consolidation
- Trigger: CPI broadly in line with estimates; Fed holds in July with neutral language
- Path: Stabilisation near $4,000–$4,100; analyst consensus projects end-July average near $4,237
- Assessment: Most consistent with current macro consensus
Scenario 3: Bullish Recovery
- Trigger: Soft CPI below 3.8%; deteriorating labour market; ETF inflow reversal
- Path: Break above $4,250, then $4,320, recovery toward 200-day moving average and potentially $4,700 and above
- Upside: JPMorgan's longer-term projections of $5,300 average in Q3 and $6,000 by year-end represent the bull case if macro conditions shift materially
The Four Catalysts That Determine Direction Through August
Four specific events will resolve the near-term uncertainty for the gold price outlook in July and into August 2026. Each feeds directly into the real yield transmission chain.
1. June CPI Release, July 14, 2026 (8:30 a.m. ET)
This is the single most consequential near-term data point. May CPI ran at 4.2% year-over-year, driven primarily by energy components. A reading below 3.8% would compress September hike odds and open a path toward $4,100–$4,200. A reading above 4.0% reinforces hawkish expectations and puts $4,000 support under immediate pressure, with potential extension toward $3,940.
2. Fed Chair Warsh Congressional Testimony, July 14, 2026
Warsh's first formal Congressional appearance carries particular significance because his dot omission at the June meeting left markets without a clear signal about his own rate view. Any moderation in language around inflation risk being the primary concern would be read as gold-positive. The precise framing around upside versus downside risk balance matters considerably.
3. FOMC Rate Decision, July 28–29, 2026
Current pricing assigns roughly 80% probability to a hold. A hold accompanied by more neutral forward guidance would be broadly supportive for gold as a safe haven. A surprise hike, currently assigned 20% odds, would be a meaningful negative shock with potential to drive prices toward the $3,895–$4,000 band. A hawkish hold, meaning rates unchanged but aggressively worded forward guidance, would sustain existing pressure without generating fresh downside momentum.
4. PBOC Monthly Reserve Data, Early August 2026
China's State Administration of Foreign Exchange releases reserve data in the first week of each month. Confirmation that purchases continued through July, particularly at or above June's 14.93-tonne pace, would reinforce the structural narrative and provide a positive signal for the broader institutional outlook. Any interruption to the 20-month streak would be the first since November 2024 and would attract disproportionate market attention given the streak's analytical significance.
Three Long-Term Pillars That Have Not Reversed
The 2026 correction has shifted entry prices. It has not, however, altered the foundational conditions that drove gold's 160% appreciation over the prior six years. Three structural pillars remain firmly in place.
Pillar 1: Sovereign Debt Expansion
US gross national debt stands at $39.39 trillion as of July 6, 2026. Global government debt is approaching one-third of total global debt, which itself reached $353 trillion in H1 2026, according to State Street Global Advisors' July 2026 Monthly Gold Monitor. Annual US interest expense exceeding $1 trillion constrains the Fed's operational independence and reinforces the long-term case for monetary hedges.
Pillar 2: Reserve Architecture Diversification
Gold as a safe haven surpassing US Treasuries as the largest single category of global official reserves at end-2025 is a structural development with no precedent in the post-Bretton Woods era. The de-dollarisation dynamic underlying this shift operates across multi-decade timeframes and does not reverse on the basis of quarterly CPI data. Sovereign reserve allocation mandates are reviewed in years and decades, not in months.
Pillar 3: Persistent Institutional Demand
The combination of central bank buying averaging 1,000 tonnes annually since 2022, a record 45% of central banks planning to increase their own holdings, and institutional ETF positioning remaining well below its pandemic-era peak creates a structural setup where the rebound, when it materialises, has meaningful room to run. Global gold ETF holdings have not recovered to prior highs despite the Q2 selloff, meaning institutional positioning is not stretched and inflow potential remains intact. For instance, analysts tracking daily and weekly forecasts continue to flag this as a supportive medium-term signal.
The 28% correction from January's record is real. The six-year structural case that produced that record is also real. For investors evaluating the gold price outlook in July 2026, the discipline lies in refusing to let short-term rate mechanics overwrite a decade of reserve architecture transformation.
Disclaimer: This article is for informational and educational purposes only. It does not constitute financial or investment advice. All forecasts, price targets, and institutional projections cited are sourced from third-party research and are subject to revision. Precious metals investments carry risk, including the potential for partial or total capital loss. Past performance is not indicative of future results. Always consult a qualified financial adviser before making investment decisions.
Want to Identify the Next Major ASX Mineral Discovery Before the Market Does?
Discovery Alert's proprietary Discovery IQ model delivers real-time alerts on significant ASX mineral discoveries, instantly translating complex data across 30+ commodities into clear, actionable insights for both short-term traders and long-term investors. Explore Discovery Alert's discoveries page to understand how historic mineral discoveries have generated substantial returns, and begin your 14-day free trial today to position yourself ahead of the broader market.