
July 10, 2026
The Structural Forces Reshaping Gold's Role in the Global Monetary System
For centuries, gold has functioned as the ultimate store of value during periods of monetary instability. But something fundamentally different is happening in the current cycle. The architecture of demand has shifted. Where previous gold bull markets were ignited by retail speculation, ETF inflows chasing inflation hedges, or momentum trading, the engine driving the gold price rebound on central bank demand today is sovereign-level reserve policy. Central banks are not buying gold because they expect short-term price appreciation. They are buying it because the international monetary system is undergoing a slow but unmistakable structural transformation.
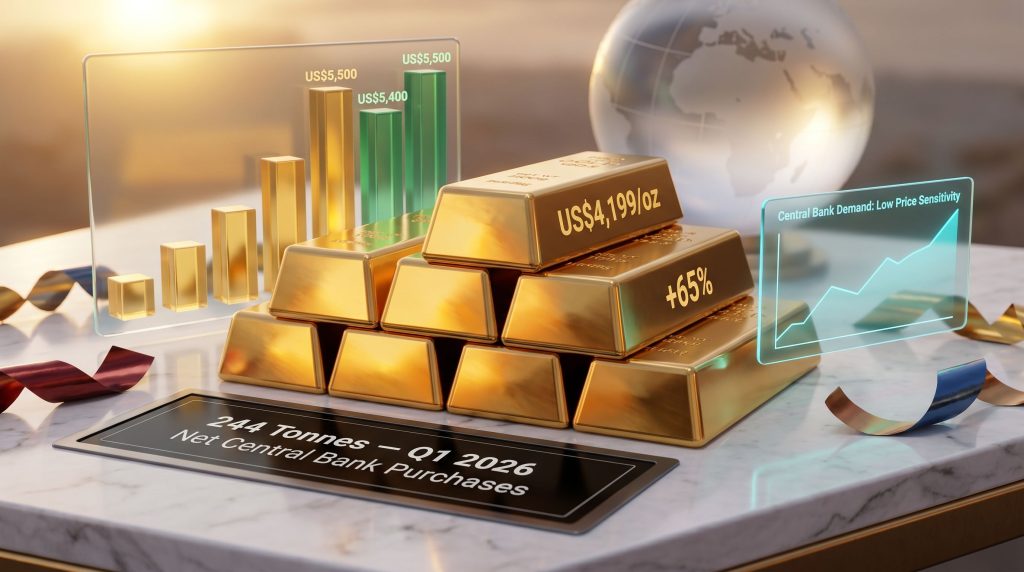
Understanding this distinction is critical for any investor trying to make sense of gold's recent 20% correction from its January 2026 record high, the competing institutional price forecasts, and whether the metal's current levels near US$4,199 per ounce represent a temporary dislocation or the beginning of a more prolonged repricing. Furthermore, gold in the global monetary system has increasingly become the subject of serious debate among reserve managers and policymakers alike.
When big ASX news breaks, our subscribers know first
Why This Gold Cycle Is Structurally Different
Reserve Diversification Has Replaced Speculation as the Core Demand Driver
The 2025 bull run that lifted gold prices by 65% was remarkable for its breadth and velocity. However, what made it durable was not speculative momentum. It was the scale and consistency of official-sector accumulation running beneath the surface of the broader market narrative.
Central banks across emerging markets and developing economies have been systematically adding gold to their reserve portfolios, reducing concentration risk in US dollar-denominated assets. This is not a reactive trade. It is a deliberate, long-duration policy shift that is largely insensitive to the kind of short-term interest rate movements that typically punish non-yielding assets. In addition, central bank gold demand has proven remarkably consistent even during periods of macroeconomic turbulence.
The following table illustrates how different demand types respond to macroeconomic shifts, highlighting why central bank buying represents a uniquely stable price floor:
| Demand Type | Price Sensitivity | Primary Motivation | Typical Holding Period |
|---|---|---|---|
| Central Bank Buying | Low | Reserve diversification, de-dollarisation | Long-term / permanent |
| ETF Inflows | High | Inflation hedging, macro uncertainty | Medium-term |
| Retail / Speculative | Very High | Short-term price momentum | Short-term |
| Jewellery / Industrial | Moderate | Cultural, functional use | Cyclical |
The De-Dollarisation Thesis Remains Intact Despite Surface Cooling
On the surface, commentary from some market participants suggests that the so-called debasement trade has lost momentum in 2026. However, a more granular reading of the data tells a different story. The structural catalysts that made dollar diversification a rational policy objective for dozens of central banks have not disappeared. They have simply been temporarily overshadowed by near-term USD strength and oil market volatility.
The de-dollarisation dynamic follows a distinct logic that operates across a much longer timeframe than quarterly market cycles. Consider the sequence of events that has accelerated reserve diversification:
- Sanctions risk awareness: The freezing of Russian sovereign assets in 2022 signalled to central banks globally that USD-denominated reserves carry geopolitical counterparty risk that had previously been underappreciated.
- US fiscal trajectory concerns: Persistent and growing US fiscal deficits raise long-term questions about dollar credibility and the real value of Treasury holdings.
- Multipolar reserve system emergence: Emerging market central banks are actively reducing single-currency concentration risk as a matter of institutional risk management.
- Gold's neutrality advantage: Physical gold carries no counterparty risk, cannot be frozen, sanctioned, or devalued by a foreign government's policy decision.
- Centuries of monetary precedent: Gold has preserved purchasing power across every major monetary regime change in recorded history.
Gold's Price Journey: From Record Highs to a 20% Correction
Understanding the Sell-Off and What the Data Reveals
Spot gold reached an all-time record high in January 2026, capping a multi-year surge that had seen the metal become one of the best-performing major assets globally. The subsequent correction of more than 20%, bringing prices to approximately US$4,199 per ounce by mid-June 2026, was driven by a convergence of macro headwinds rather than any deterioration in the fundamental demand picture.
| Period | Price Level / Change | Key Driver |
|---|---|---|
| Full Year 2025 | +65% | Safe-haven demand, USD weakness, geopolitical risk |
| January 2026 Peak | Record high (all-time) | Momentum, macro uncertainty |
| Mid-June 2026 | ~US$4,199/oz | USD strength, oil shock, equity liquidation |
| Correction Magnitude | Over 20% from peak | Rising yields, inflation expectations |
A critical dynamic that often surprises investors is the liquidity paradox of gold. During periods of acute equity market stress, such as the oil shock-induced turbulence of early 2026, gold is frequently sold not because investors have lost confidence in it, but because it is one of the most liquid assets available to cover margin calls and equity losses.
This forced selling temporarily disconnects gold's price from its underlying demand fundamentals. Historically, such dislocations have preceded sharp recoveries once the selling pressure exhausts itself and structural buyers re-enter the market at more attractive levels. Consequently, gold safe-haven dynamics remain central to understanding why these dislocations are ultimately temporary.
Institutional Price Forecasts: What the Major Money Managers Are Projecting
A Broad Consensus Points Significantly Higher From Current Levels
Despite the correction, institutional forecasters have not materially revised their medium-term gold outlooks downward. The core thesis of sustained central bank accumulation and structural reserve diversification remains the foundation of bullish price projections. According to J.P. Morgan's commodities research, the medium-term outlook for gold continues to reflect constructive fundamentals driven by persistent official-sector demand.
| Institution | Price Target | Target Timeframe | Scale Indicator |
|---|---|---|---|
| State Street Investment Management | US$4,750 to US$5,500/oz | End of 2026 | Approximately US$4.1 trillion AUM |
| DWS Asset Management | US$5,400/oz | Mid-2027 | Major European asset manager |
| Goldman Sachs | Above current market levels | 2026 outlook | Tier-1 global investment bank |
| J.P. Morgan | Above current market levels | 2026 outlook | Tier-1 global investment bank |
State Street Investment Management's base-case projection of US$4,750 to US$5,500 per ounce by year-end 2026 implies a recovery of at least 13% from mid-June 2026 price levels. German asset manager DWS extends its constructive view further out, targeting US$5,400 per ounce by mid-2027.
Analysts at William Blair Investment Management have noted that while the debasement trade has softened in the near term, its underlying catalysts remain firmly in place. The return of central banks to net buying in April 2026, following a brief period of net sales in March, was cited as evidence that the structural accumulation trend is intact.
It is important to note that these forecasts represent institutional base-case scenarios and carry inherent uncertainty. Investors should treat price projections as analytical frameworks rather than guaranteed outcomes, as macroeconomic conditions, geopolitical developments, and monetary policy shifts can materially alter trajectories.
Central Bank Demand in 2026: Looking Beyond the Headline Data
Why Reported Figures May Significantly Understate True Accumulation
One of the most important and least-discussed aspects of the central bank gold demand story is the gap between reported purchasing figures and estimated actual accumulation. Official reporting to bodies like the International Monetary Fund involves reporting lags and voluntary disclosure, meaning that headline monthly purchase data frequently understates the true scale of sovereign buying activity.
Alternative market-flow methodologies, which track physical gold movements through trade data, custodial changes, and derivatives positioning, have generated materially higher estimates of central bank accumulation than official figures suggest. Estimates based on these alternative-flow approaches placed net central bank purchases in Q1 2026 at approximately 244 tonnes, a figure substantially above what conventional reporting indicated.
Key data points that reinforce the structural demand narrative include:
- Central banks returned to net buying in April 2026 after March net sales, demonstrating the resilience of the underlying trend.
- World Gold Council data indicated approximately 17 to 19 tonnes of central bank purchases in April 2026 alone.
- A survey of central bank reserve managers found that roughly 95% of respondents anticipated increasing their gold holdings over the following 12 months.
- China's central bank was reported to have maintained consecutive monthly gold purchases for 19 straight months through May 2026.
Furthermore, central bank gold reserves data reveals the remarkable persistence of accumulation programmes even during periods of elevated gold prices. The persistence of China's buying programme is particularly significant. At scale, consistent monthly accumulation from the world's largest foreign exchange reserve holder represents a structural demand flow that absorbs meaningful quantities of annual mine supply.
The Macro Headwinds Working Against a Rapid Gold Recovery
Balancing the Bull Case Against Genuine Near-Term Risks
A credible investment thesis requires honest accounting of the forces working against gold as much as those supporting it. In the current environment, several powerful macro headwinds are limiting the pace of recovery.
| Factor | Direction | Impact on Gold | Magnitude |
|---|---|---|---|
| USD Strengthening | Headwind | Reduces international purchasing demand | High |
| Rising Bond Yields | Headwind | Increases opportunity cost of holding gold | High |
| Oil Shock / Inflation | Headwind | Reduces real return appeal | Moderate to High |
| AI Capital Expenditure Boom | Headwind | Diverts institutional capital from safe havens | Moderate |
| Central Bank Accumulation | Tailwind | Structural price floor support | High |
| Middle East Diplomatic Progress | Tailwind | Eases oil-driven inflation expectations | Moderate |
| De-Dollarisation Trend | Tailwind | Long-term structural demand driver | High |
| Equity Market Volatility | Tailwind | Flight-to-safety demand spikes | Variable |
The AI capital expenditure boom deserves particular attention as a less commonly discussed headwind. The extraordinary scale of technology infrastructure investment being directed toward data centres, semiconductor manufacturing, and AI compute capacity is absorbing institutional capital that might otherwise flow toward defensive allocations like gold. When high-conviction growth narratives compete for the same pool of institutional capital as traditional safe-haven assets, gold's relative attractiveness can be temporarily compressed even when its fundamental demand thesis remains intact.
The Geopolitical Nuance: Why Peace Could Be a Mixed Signal for Gold
Progress toward diplomatic resolution of Middle East tensions presents a genuinely complex scenario for precious metal investors. The intuitive assumption is that reduced geopolitical risk should weaken gold's safe-haven premium. However, the secondary effects cut the other way. A reduction in Middle East tensions would ease supply pressures on crude oil, which would in turn reduce oil-driven inflation expectations, which reduces the relative appeal of yield-bearing alternatives to gold. The net effect on gold is therefore ambiguous and context-dependent rather than straightforwardly negative.
The next major ASX story will hit our subscribers first
Frequently Asked Questions: Gold Price Rebound and Central Bank Demand
Why are central banks buying so much gold right now?
Central banks are accelerating gold purchases primarily to diversify foreign exchange reserves away from US dollar-denominated assets, reduce counterparty risk, and hedge against long-term currency debasement. The trend has been reinforced by geopolitical fragmentation and the precedent set by sovereign asset freezes in recent years.
What is the gold price forecast for the end of 2026?
Institutional forecasters including State Street Investment Management project gold reaching between US$4,750 and US$5,500 per ounce by end-2026, while DWS targets US$5,400 by mid-2027. These projections assume continued central bank accumulation and a moderation of oil-driven inflation pressures.
Does rising interest rates always push gold prices lower?
Not necessarily. While higher yields increase the opportunity cost of holding non-yielding assets like gold, central bank demand driven by reserve policy rather than yield-seeking can offset this pressure and maintain a structural price floor even in rising-rate environments. The current cycle is a practical demonstration of this dynamic.
What caused gold to fall more than 20% from its January 2026 peak?
The correction resulted from a combination of US dollar strengthening, rising crude oil prices fuelling inflation expectations, higher bond yields increasing the appeal of yield-bearing alternatives, and investor liquidations to cover equity losses during oil shock-related market turbulence.
How does de-dollarisation support gold prices over the long term?
As nations reduce reliance on US dollar reserves, motivated by sanctions risk, fiscal sustainability concerns, and multipolar geopolitics, gold becomes the preferred neutral reserve asset. This creates a persistent, policy-driven demand base that supports prices independently of speculative or retail investor sentiment.
Key Takeaways: Contextualising the Gold Price Rebound Thesis
Three Scenarios Investors Should Monitor Heading Into Late 2026
The recovery thesis for gold rests on several conditions holding simultaneously. Investors tracking the gold price rebound on central bank demand narrative should monitor the following scenario pathways. In addition, record gold ETF inflows observed in 2025 suggest that institutional appetite beyond central banks could further amplify any recovery from current levels.
- Base case (recovery to US$4,750 to US$5,500): Central bank accumulation continues at or above 2025 pace, USD strength moderates as US fiscal concerns resurface, and oil prices stabilise as diplomatic progress reduces supply risk premiums.
- Bull case (above US$5,500): A resumption of broad USD weakness, acceleration of de-dollarisation purchasing from additional sovereign buyers, and equity market volatility driving safe-haven inflows simultaneously.
- Bear case (extended consolidation): Persistently high US bond yields, continued AI-driven capital rotation away from defensives, and a surprise cooling of central bank purchasing activity reported in official data.
The structural argument for gold does not depend on any single catalyst materialising. Central bank buying is functioning as a price floor absorber rather than a speculative accelerant. Even in the bear case, the scale of sovereign accumulation limits how far prices can fall before institutional buyers return in size.
The gold market in 2026 is not behaving like a classic speculative cycle. It is reflecting the slow, methodical reordering of global reserve strategy by institutions that operate on timelines measured in decades rather than quarters. Furthermore, analysts at Crux Investor have highlighted that strong central bank demand alongside price weakness has created a notable valuation gap in gold equities, adding another dimension to the investment case. That distinction matters enormously for how investors should interpret price corrections, evaluate forecasts, and position within their broader portfolios.
This article contains forward-looking statements and institutional price forecasts that are subject to material uncertainty. Readers should conduct independent research and seek professional financial advice before making investment decisions. Gold price forecasts referenced are sourced from State Street Investment Management, DWS Asset Management, and market commentary attributed to William Blair Investment Management.
Want to Track the Next Major ASX Gold Discovery in Real Time?
Discovery Alert's proprietary Discovery IQ model scans ASX announcements the moment they drop, instantly converting complex mineral data across 30+ commodities into actionable insights — so investors can position ahead of the broader market as structural gold demand continues to reshape the investment landscape. Explore how historic mineral discoveries have generated exceptional returns, then begin your 14-day free trial to secure a market-leading edge.