
July 17, 2026
The Macro Mechanics Behind Gold's Critical Price Battle
Precious metals markets have always been shaped by a tug-of-war between two opposing forces: the gravitational pull of monetary policy and the momentum of speculative positioning. When those two forces align in the same direction, price moves can be dramatic. When they diverge, markets stall at pivotal levels that become focal points for every participant in the complex. Right now, in mid-2026, gold price support at $4,000 and Fed rate hike fears are defining exactly one of those focal points, with $4,000 per ounce drawing all the attention.
Understanding why this number carries such outsized significance requires more than a glance at a price chart. It demands an appreciation of how psychological anchors, institutional positioning, monetary policy signals, and technical chart structure interact to create battlegrounds in asset markets.
When big ASX news breaks, our subscribers know first
The Architecture of a Gold Price Floor: What $4,000 Actually Represents
Beyond Round Numbers: Psychology Meets Market Mechanics
Round numbers in financial markets are rarely just aesthetic. They function as coordination points where buyers and sellers independently arrive at the same reference level, creating a self-reinforcing cluster of activity. At $4,000 gold, algorithmic trading systems trigger pre-programmed orders, institutional desks reference the same threshold in risk models, and retail participants anchor their stop-loss and entry decisions to the same figure.
This clustering effect means that when price approaches $4,000 from above, a denser-than-average concentration of buy orders is likely to slow or temporarily halt any decline. Furthermore, the longer price has respected that level, the stronger the psychological commitment of market participants to defend it.
Why Closing Prices Carry More Weight Than Intraday Extremes
One of the most misunderstood concepts in technical analysis is the difference between an intraday price test and a closing price violation. On a candlestick chart, the body of each candle reflects the range between the opening and closing price, while the upper and lower wicks show where price briefly travelled during the session before being rejected.
When gold repeatedly tests $4,000 intraday but closes above that level, the wicks confirm that selling pressure exists but that buyers are successfully absorbing it before the session ends. A closing price below $4,000, by contrast, signals that buyers lacked the conviction to defend the level through the full trading day, which materially weakens the structural case for that floor. This distinction has become central to how analysts are reading gold's current position.
How Fed Rate Hike Fears Became Gold's Biggest Headwind in 2026
The Opportunity Cost Equation
Gold's fundamental vulnerability to rising interest rates stems from a straightforward economic reality: gold generates no yield. It pays no coupon, no dividend, and offers no guaranteed return. When interest rates rise, fixed-income instruments like U.S. Treasury bonds begin offering more attractive guaranteed returns, and capital naturally gravitates toward yield-bearing alternatives.
This dynamic is not new, but its intensity depends on the magnitude and speed of the rate move, as well as how far expectations have shifted from the prior baseline. In 2026, that shift has been significant. The relationship between gold and bonds becomes particularly strained during periods of aggressive rate repricing, as capital flows rotate decisively toward yield-bearing instruments.
From Rate Cut Hopes to Rate Hike Probability
Earlier in the year, market consensus leaned toward the Federal Reserve maintaining an accommodative or neutral stance. That consensus has since inverted sharply. Market-implied probability of a Fed rate hike by December 2026 surged to approximately 78 to 80% following hawkish communications from central bank leadership in June, representing one of the most dramatic repricing events in rate expectations since the post-pandemic tightening cycle.
The new Fed Chair has been explicit in stating that any inflation reading above 2% is unacceptable and that the central bank is prepared to act. That verbal commitment has moved gold markets with nearly the same force as an actual policy decision, because forward-looking markets price in anticipated outcomes rather than waiting for confirmation. According to Reuters reporting on gold's move below $4,000, a strong dollar compounded the impact of hawkish Fed signals, amplifying downward pressure on the metal.
The critical insight here is that monetary policy statements, not just policy actions, now function as effective rate moves. When central bank leadership signals with conviction, market participants recalibrate positioning immediately, compressing the gap between communication and market response.
Why Gold Failed to Hold Gains on Soft Inflation Data
One of the more telling developments in recent weeks has been gold's inability to sustain a rally despite cooler-than-expected consumer and wholesale price readings. In a market where the primary driver is inflation expectations and their effect on monetary policy, positive inflation data should be unambiguously bullish for gold.
The fact that gold rallied briefly on that data and then surrendered the entire move suggests that the market is discounting the data in favour of the broader rate-hike narrative. This pattern, where a market fails to hold gains on its own bullish catalyst, is technically interpreted as a sign of underlying distribution. Sellers are using bounces to exit positions rather than buyers using dips to accumulate.
What Do the Charts Actually Say? A Technical Breakdown
The Price Level Map Every Trader Is Working From
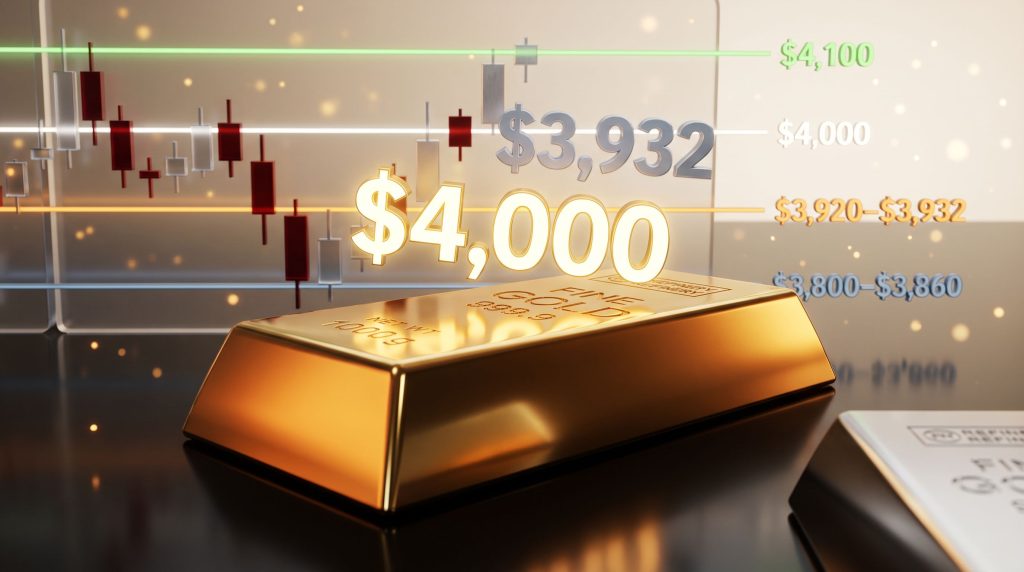
Technical analysis of gold's current structure reveals a layered set of support and resistance zones that define the probability-weighted outcomes for the near term. The table below summarises the key levels in play as of mid-2026.
| Price Level | Technical Significance | Current Status |
|---|---|---|
| $4,100 | Recovery confirmation threshold | Not yet reclaimed |
| $4,060 | Near-term resistance ceiling | Capping bounces |
| $4,000 | Primary psychological support floor | Under active pressure |
| $3,980 | First buffer below $4,000 | Initial downside target |
| $3,950 | Intermediate technical support | Secondary buffer zone |
| $3,920–$3,932 | October 2025 price base | Critical structural shelf |
| $3,860–$3,900 | Deeper structural support band | Downside scenario target |
| $3,400–$3,500 | Major long-term bull market defence | Cycle floor |
Lower Highs, Lower Lows: Reading Distributional Pressure
Gold's price structure since the all-time high above $5,600 has traced out a textbook pattern of distributional selling: a peak followed by a lower high, then a lower low, then another lower high, and another lower low. Each successive rally has failed to recover the prior peak, and each pullback has undercut the prior trough.
This sequential deterioration is precisely how technical analysts define a market under sustained selling pressure, as opposed to a market simply experiencing a healthy pause within a broader uptrend. The distinction matters enormously for positioning. A healthy bull market correction is typically characterised by shallow retracements with strong follow-through buying at support. What has been observed in gold recently is the opposite: weak bounces with limited follow-through, and new lows being established with each selling wave.
Fibonacci Retracement Projections
Applied to the rally from gold's 2025 base to its 2026 peak, Fibonacci retracement levels suggest that a corrective move toward the $4,200 area represents a relatively shallow pullback, while a deeper retracement toward the $3,900 to $3,950 zone corresponds to a more significant but still technically recoverable correction. A retracement beyond those levels would bring the $3,500 to $3,400 zone into focus as the major long-term support band where the primary bull market thesis would be tested.
Is the $4,000 Floor Holding or Cracking?
The Difference Between Damaged and Broken
There is an important distinction between a support level that is being tested and one that has been definitively broken. Intraday violations of $4,000 that recover to close above the level on a daily basis represent a damaged floor, one that is weakening but has not yet been structurally breached. A confirmed daily close below $4,000 shifts the assessment considerably.
Even more significant is the $3,932 level, which corresponds to the October 2025 price base. This level is not derived from a round number or an arbitrary technical tool; it represents actual historical price activity where buyers previously stepped in at scale. A sustained daily close below $3,932 would technically reclassify the current move from a correction within a bull market to a potential structural breakdown.
A confirmed daily close below $3,932 would represent a shift from corrective price action to potential structural deterioration, opening a technical pathway toward the $3,800 to $3,860 support band and raising questions about the integrity of the broader uptrend.
Three Scenarios for Gold's Next Move
-
Bullish Recovery Case: Gold reclaims and closes above $4,100 with multi-session follow-through buying, re-establishing the uptrend and targeting the $4,370 to $4,500 range.
-
Consolidation Case: Gold oscillates between approximately $3,932 and $4,060, digesting the correction while market participants await clarity on the Fed's rate path at Jackson Hole and the September FOMC meeting.
-
Bearish Breakdown Case: A sustained close below $3,900 triggers additional technical selling toward $3,500, particularly if rate hike probability remains elevated above 70% and inflation data continues to surprise to the upside.
Silver's Faster Fall: Warning Signal or Expected Behaviour?
The Asymmetric Nature of Silver's Market Structure
Silver's sharper percentage decline relative to gold during this correction has drawn attention, however it is important to contextualise this behaviour within the known structural dynamics of the two metals. Examining silver versus gold reveals that silver's market is significantly smaller in terms of total value traded, attracting a higher proportion of speculative participants relative to institutional hedgers and central bank accumulators.
This means that in bullish precious metals environments, silver tends to outperform gold on a percentage basis, amplifying the upside move. Conversely, when bearish sentiment dominates, silver's larger speculative component unwinds faster, producing steeper percentage losses. This asymmetry is a feature of the market, not an anomaly, and it is playing out with textbook precision in mid-2026.
Silver's Loss of the 200-Day Moving Average
The 200-day moving average is the most widely referenced trend indicator in financial markets, used by analysts, fund managers, and algorithmic systems alike. When silver reclaimed this level earlier in the year, it was interpreted as a confirmation that the broader precious metals complex was in a healthy uptrend. Silver's subsequent loss of that line is a technically significant deterioration.
Because silver's smaller liquidity profile makes it more sensitive to shifts in sentiment, it has historically functioned as a leading indicator for directional changes across the entire precious metals complex. Both metals peaked simultaneously, with their respective highs occurring at corresponding points in the calendar. The synchronised nature of the decline reinforces the interpretation that a single macro driver — specifically the repricing of Fed rate expectations — is responsible for the correction.
The next major ASX story will hit our subscribers first
Is $6,000 Gold Still a Realistic Target? Reassessing the Long-Term Outlook
How Wave Models Work and Where They Have Limits
Technical forecasting models, including Elliott Wave analysis and proprietary pattern-recognition systems, generate directional projections based on historical price behaviour and structural repetition. These models can identify high-probability trajectories with impressive consistency under stable fundamental conditions, but they carry a critical limitation: they cannot anticipate abrupt shifts in the underlying policy environment.
A useful analogy for understanding this limitation is that of a navigator on a ship who can read ocean currents and wave patterns with precision, but who cannot know when the captain will suddenly turn the wheel. The ocean data remains accurate, but the vessel's actual path is ultimately determined by decisions that occur outside the observable data set.
The Revised Upside Ceiling: From $6,000 to $5,600
The $6,000 target for gold was modelled within a framework that assumed a continuing or deepening accommodative monetary policy environment. The shift toward rate hike probability has not simply delayed that target; it has required a fundamental recalibration of the model's inputs. The revised near-term upside ceiling under a recovery scenario is closer to $5,600, reflecting the reduced probability of the momentum conditions required to extend the prior trend. The broader gold price forecast remains constructive over a longer horizon, but the near-term path has narrowed considerably.
What Would Need to Change for $6,000 to Return as a Base Case
- The Fed's rate hike cycle stalls or reverses before the end of 2026
- Inflation data consistently undershoots the central bank's 2% target over multiple consecutive readings
- A meaningful geopolitical risk premium re-enters gold pricing, with market participants once again treating the gold safe-haven role as a primary price driver
- Central bank gold demand accelerates materially beyond its current pace, providing a structural demand floor that overwhelms speculative selling pressure
The Role of Physical Demand as a Long-Term Buffer
One important distinction in gold market analysis is between the speculative trading layer and the physical accumulation layer. Central bank purchases, sovereign wealth fund allocations, and long-term physical holders do not respond to short-term rate signals in the same way that futures traders do.
This structural demand layer provides a floor beneath the speculative selling that can temporarily drive prices lower, and it is one reason why technical analysts identify the $3,400 to $3,500 zone as a major long-term defence rather than a credible near-term target.
Healthy Correction or Trend Reversal? How to Tell the Difference
Contextualising the $1,600 Decline From Peak
Gold has declined approximately $1,600 from its 2026 peak, a magnitude that is significant in nominal terms but must be evaluated in proportional context. The prior bull market rally from the 2025 base was itself a multi-thousand dollar move, meaning the percentage retracement remains within the range that prior bull market corrections have produced without invalidating the broader trend.
Bull market corrections are characterised by their depth relative to the prior advance, not their nominal size. By that measure, the current correction is large but not yet definitive evidence of a trend reversal. What shifts that calculus is whether the key structural support levels hold or break on a closing basis.
Summer Liquidity and Seasonal Amplification
An often underappreciated factor in summer price moves is the structural thinning of order books as primary institutional traders reduce active participation. With fewer large participants maintaining positions, individual orders carry disproportionate price impact, exaggerating both downside moves and recovery bounces beyond what underlying sentiment would normally produce.
Summer months historically reduce institutional participation, creating thinner order books where price moves are mechanically amplified. September's return of full institutional volume will provide the first genuine test of whether the correction reflects deep structural selling or a seasonally amplified shakeout.
This seasonal dynamic is particularly relevant because it means the price moves of July and August may overstate the actual degree of sentiment shift. When primary institutional traders return to full activity in September, their collective positioning will either confirm or contradict the directional signal generated during the lower-volume summer period. For a closer look at how these dynamics have unfolded in real time, this market analysis video provides additional context on gold's recent price behaviour.
FAQ: Gold Price Support at $4,000 and Fed Rate Hike Fears
Why Is $4,000 Such an Important Level for Gold Prices?
$4,000 functions as both a psychological anchor and a structural price zone. Round numbers in commodity markets attract disproportionate order flow from algorithmic systems, institutional desks, and retail participants simultaneously, creating a self-reinforcing concentration of buy interest. Its significance is compounded by the fact that it aligns with historical price activity from late 2025.
How Do Fed Rate Hikes Affect Gold Prices?
Gold produces no yield. When the Federal Reserve raises interest rates, Treasury bonds and other fixed-income instruments offer higher guaranteed returns, increasing the opportunity cost of holding gold. Capital rotates toward yield-bearing assets, reducing demand for gold and applying sustained downward pressure.
What Is the Next Major Support Level If $4,000 Breaks Decisively?
The immediate buffer sits near $3,980, followed by $3,950. The more structurally significant shelf is at $3,920 to $3,932, corresponding to the October 2025 price base. Below that, the $3,860 to $3,900 range represents the next meaningful technical support band.
Is Silver Falling Faster Than Gold a Bearish Signal?
Silver's sharper percentage decline is consistent with its known structural behaviour during bearish precious metals phases. Both metals are responding to the same macro driver, but silver's smaller market size and higher speculative participation amplify the directional move.
What Price Level Would Confirm That Gold's Recovery Is Genuine?
A sustained daily close above $4,100, accompanied by follow-through buying across multiple consecutive sessions, is the minimum threshold required to consider the correction over and the uptrend credibly resuming.
When Is the Next Major Fed Event That Could Move Gold?
The Jackson Hole Economic Symposium on August 27 is the next high-impact calendar event, followed by the September FOMC meeting. Both represent potential inflection points where revised rate guidance could reprice gold materially in either direction.
Could Gold Still Reach $6,000 in 2026?
The $6,000 projection was modelled within a monetary environment that has since shifted toward rate hike expectations. Consequently, while a return to that trajectory remains possible if the Fed pivots back toward accommodation, the current technical and fundamental backdrop has reduced its probability within the 2026 timeframe. The revised near-term ceiling under a recovery scenario is closer to $5,600.
Key Takeaways: What Gold's Battle at $4,000 Means for Investors
The Two Numbers That Define the Next Move
For investors and traders monitoring gold price support at $4,000 and Fed rate hike fears, the actionable framework is built around two price levels:
- Above $4,100: Signals that recovery momentum is gaining credibility, with the uptrend potentially resuming and near-term targets shifting back toward $4,370 to $4,500.
- Below $3,920: Opens the technical pathway toward a deeper correction into the $3,800 to $3,860 structural support band, with further risk toward $3,500 if rate hike probability remains elevated.
Why Monetary Policy Has Overtaken Geopolitics as Gold's Primary Driver
One of the more significant market dynamics playing out in 2026 is the apparent diminished sensitivity of gold to geopolitical risk events that would historically have provided strong upside support. Military tensions, supply chain disruptions, and sovereign risk events — factors that once reliably triggered gold's safe-haven premium — are generating muted reactions compared to the impact of a single Fed communication about rate policy.
This is not a permanent structural change in gold's nature, but rather a reflection of where institutional attention is concentrated at any given time. When monetary policy uncertainty dominates the macro landscape, it absorbs the risk premium bandwidth that would otherwise be available for geopolitical pricing. When the rate cycle stabilises, geopolitical sensitivity is likely to reassert itself.
Physical Accumulation as the Long-Term Floor
Beneath the speculative trading layer that drives short-term price volatility, the physical demand structure of the gold market continues to provide a long-term price floor. Central bank accumulation, sovereign reserve diversification away from the U.S. dollar, and long-term institutional allocation to gold as a portfolio hedge represent demand that does not respond to short-term rate signals.
This structural layer is one of the primary reasons that even the most bearish technical scenarios in mid-2026 find their downside limits well above the levels that would genuinely threaten the post-2022 bull market thesis. Understanding this distinction between speculative and structural demand remains essential for any long-term assessment of where gold price support at $4,000 and Fed rate hike fears ultimately lead the market.
Disclaimer: This article is intended for informational purposes only and does not constitute financial advice. Price targets, technical levels, and scenario projections are based on analytical frameworks and historical price behaviour. All forecasts involve uncertainty, and past price patterns do not guarantee future outcomes. Readers should conduct their own research and consult a qualified financial adviser before making any investment decisions.
Want to Stay Ahead of the Next Major Mineral Discovery While Gold Markets Remain Volatile?
While gold traders watch the $4,000 level with intense focus, Discovery Alert's proprietary Discovery IQ model is scanning ASX announcements in real time, instantly identifying significant mineral discoveries across 30+ commodities and converting complex data into clear, actionable insights for both short-term traders and long-term investors. Explore how historic mineral discoveries have generated substantial returns and begin your 14-day free trial at Discovery Alert to position yourself ahead of the market.