July 28, 2026
When Price Floors Become Battlegrounds: Understanding Gold's Critical $4,000 Moment
Every major bull market in gold eventually produces a price level that transcends technical significance and takes on a psychological dimension all its own. The $1,000 barrier defined a generation of gold investors in the late 2000s. The $2,000 threshold dominated market conversation for years before finally yielding. Today, $4,000 per ounce has assumed that same gravitational weight, and the gold price tests $4,000 floor before Fed decision in a way that tells a more nuanced story than a simple pullback narrative suggests.
Understanding why this specific number matters requires looking beyond chart patterns and into the mechanics of how institutional capital responds to round-number price psychology, how geopolitical risk premiums are built and dismantled, and how central bank communication shapes the real yield environment that ultimately governs gold's cost of carry. Furthermore, the broader context of gold's record-breaking performance throughout recent years makes this particular juncture all the more significant.
When big ASX news breaks, our subscribers know first
The $4,000 Level: Technical Support or Structural Conviction?
How Markets Assign Significance to Round Numbers
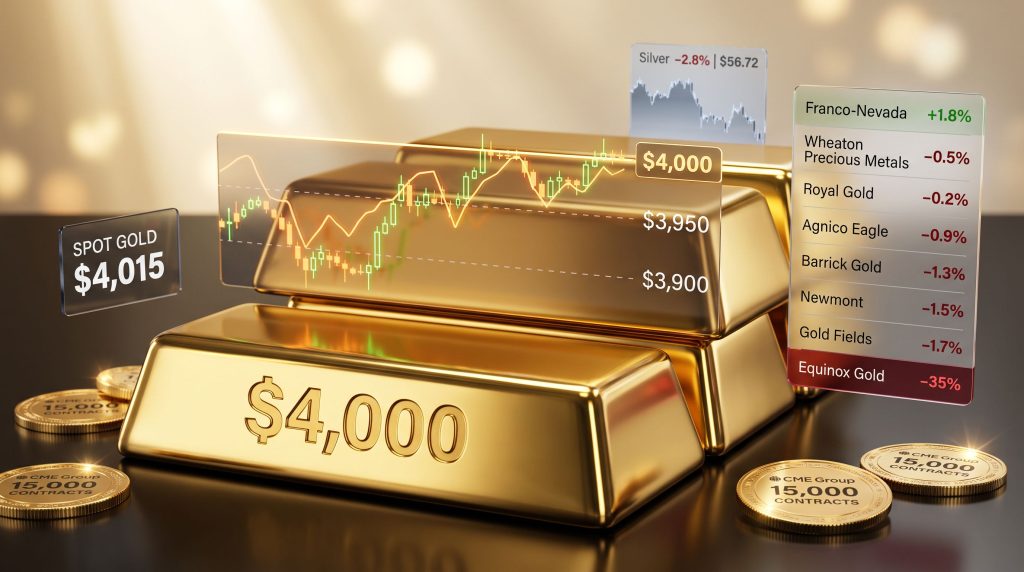
The concentration of buy orders near psychologically significant price levels is a well-documented phenomenon in commodity markets. When gold trades near $4,015 to $4,044 per ounce on the Comex August contract, it is not simply consolidating. It is operating within a zone where multiple categories of market participants, from systematic trend-following funds to discretionary macro traders to physical bullion buyers, have independently identified the same reference point as meaningful.
The intraday dip to $4,011.10 during Tuesday's New York session represented a genuine probe of market depth rather than casual volatility. The fact that prices recovered from that low without catastrophic follow-through selling confirms that demand exists at these levels, though it does not guarantee the floor will hold indefinitely.
Analysts across multiple commodity desks have converged on the following downside target structure if $4,000 fails:
- $3,950 – primary technical support and the first meaningful demand zone
- $3,900 – secondary structural support corresponding to earlier consolidation levels
- $3,860 – deeper bearish scenario target, representing a more significant technical retracement
Dip-Buying as a Structural Signal
One of the more telling data points from the current market environment is the behaviour of bullion-backed exchange-traded funds. These vehicles, which aggregate demand from thousands of institutional and retail investors globally, recorded five consecutive days of inflows through Tuesday's session, representing the longest uninterrupted streak since May 2026.
This pattern is significant because ETF inflows require deliberate allocation decisions. Unlike futures positioning, which can reverse within minutes, ETF buying represents considered capital deployment. The fact that investors are actively adding to bullion exposure during a period of price weakness suggests the structural bull case for gold remains intact in the minds of a meaningful cohort of market participants. For those weighing their options, the choice between physical gold vs ETFs remains a critical consideration.
The pre-Fed trading range has been characterised by multiple market strategists as approximately $3,950 to $4,200, a band that reflects genuine policy uncertainty rather than any directional consensus about where gold is ultimately headed.
Three Converging Pressures on the Gold Price Tests $4,000 Floor Before Fed Decision
Federal Reserve Policy Uncertainty and the Real Yield Channel
The mechanism through which Fed policy affects gold prices operates primarily through two channels: the US dollar and real yields. When interest rates rise, dollar-denominated assets become relatively more attractive, strengthening the greenback and making gold more expensive for non-US buyers. Simultaneously, higher nominal rates, particularly when not fully offset by inflation expectations, push real yields upward and increase the opportunity cost of holding a non-yielding asset like gold.
What makes the current juncture unusual is the degree of genuine uncertainty surrounding the outcome. Interest-rate swap markets assigned approximately a one-in-three probability to a quarter-point rate increase at Wednesday's Federal Open Market Committee meeting, a level of ambiguity that is historically rare this close to a scheduled decision. Most modern Fed communication strategies are designed to reduce this kind of pre-meeting uncertainty, making the current situation a signal that the policy committee itself may be genuinely divided.
Citadel Securities entered the debate publicly, arguing in favour of a rate hike on the grounds that such a move would reinforce Fed Chair Kevin Warsh's credibility in his ongoing campaign to bring inflation back to target. This framing matters: it positions the decision not purely as a data-driven mechanical response but as a reputational and signalling exercise.
Christopher Wong, a strategist at Oversea-Chinese Banking Corp, offered a perspective that captures the asymmetric risk gold faces even in a hold scenario. His analysis, distributed via Bloomberg, indicated that a decision to leave rates unchanged accompanied by hawkish forward guidance could simultaneously support real yields and the US dollar, creating a ceiling on gold's recovery potential without requiring an actual rate increase.
The Geopolitical Risk Premium and Its Systematic Unwinding
Gold's elevation to historically unprecedented price levels during the first half of 2026 was partly driven by a war premium embedded in the metal as US-Iran military conflict escalated and threatened to disrupt energy flows through the Strait of Hormuz. This premium is now actively deflating as negotiations toward a ceasefire and the eventual reopening of the Strait have advanced.
The oil market tells the story clearly. West Texas Intermediate crude fell more than 7% over the past week, dropping below $78 per barrel, a direct reflection of reduced geopolitical risk in energy supply chains. Since gold's role as an inflation hedge is partly tied to energy prices, the connection between falling crude and falling gold is consequently more direct than it might initially appear.
Measured from the onset of US-Iran hostilities approximately five months ago, gold has declined by roughly 25%, suggesting that a very substantial war premium had been priced in during the escalation phase. The current environment represents the partial, though not complete, removal of that premium as the conflict risk recedes.
Dollar Stability as a Missing Tailwind
The Bloomberg Dollar Spot Index held essentially steady during Tuesday's session. This matters because a weakening dollar is one of the most reliable near-term catalysts for gold price appreciation, and its absence removes a mechanism that might otherwise partially offset the Fed uncertainty and geopolitical premium erosion pressures described above.
In a low-conviction pre-event environment, traders typically reduce directional positioning, which means that even modest selling pressure can produce amplified price moves on reduced liquidity. Tuesday's session had the characteristics of this dynamic: the decline was meaningful but not catastrophic, suggesting thin-volume amplification rather than fundamental reassessment.
How the Fed Decision Matrix Maps to Gold Price Outcomes
The range of possible outcomes from Wednesday's Federal Reserve announcement can be mapped against their likely impact on gold through the dollar and real yield transmission channels:
| Fed Outcome | USD Direction | Real Yield Impact | Gold Price Implication |
|---|---|---|---|
| Rate hike (25bps) | Strengthening | Rising | Bearish, downside toward $3,950–$3,900 |
| Hold + hawkish guidance | Moderate strength | Elevated | Moderately bearish, cap near $4,100 |
| Hold + neutral tone | Stable | Stable | Neutral to slightly positive |
| Hold + dovish signal | Weakening | Falling | Bullish, recovery toward $4,100–$4,200 |
| Hold + explicit cut signal | Significant weakness | Declining | Strongly bullish, breakout potential above $4,200 |
The Dual Constraint Facing Policymakers
What makes this particular Fed meeting structurally different from most of the recent rate cycle is that policymakers are simultaneously confronting two contradictory data points. June's Consumer Price Index came in softer than consensus expectations, providing an argument for patience. However, oil prices, which had been rising in response to the Iran conflict before this week's pullback, introduced the spectre of energy-driven inflation re-acceleration.
This dual constraint — where tightening too aggressively risks choking a moderating economy while holding rates risks allowing commodity-driven inflation to re-embed itself — is a genuine policy dilemma. Gold's consolidation near $4,000 is itself a market signal that participants are pricing in real outcome uncertainty rather than a consensus view. In addition, central bank gold demand continues to underpin structural support, further complicating any straightforward bearish thesis.
Silver's Sharper Decline: Reading the Gold-Silver Ratio
Why Did Silver Fall Harder Than Gold?
Silver's underperformance during Tuesday's session was pronounced. The Comex September contract declined 2.7% to $57.14 per ounce, approaching the 2026 session low of $55.50 set on July 16. Spot silver fell 2.8% to $56.72, a steeper percentage decline than gold's 1.5% spot price drop.
This divergence is analytically meaningful. Silver occupies an unusual position in the commodity universe as both a monetary metal and a significant industrial input with major applications in photovoltaics, electronics, and electric vehicle components. When macro uncertainty rises and growth concerns emerge, silver's industrial demand component becomes a liability, causing it to underperform gold. A thorough gold-silver ratio analysis reveals how these divergences have historically signalled broader macro stress.
When silver consistently underperforms gold during a precious metals selloff, experienced market analysts interpret this as a signal that industrial demand anxiety is amplifying the monetary metal's decline. This pattern is more commonly associated with broad macro uncertainty than with pure inflation hedging episodes.
Implications for Silver-Leveraged Equities
Silver's sharper spot price decline cascaded through silver-weighted mining equities with particular force. The equity leverage effect — whereby a percentage change in metal prices translates into a larger percentage change in mining company earnings and valuations — amplified Tuesday's move:
- Hecla Mining declined 4.7%, reflecting its heavy silver revenue exposure
- Buenaventura fell 4.0%, dragged lower by its combined silver and gold production profile
- Coeur Mining retreated 3.7%, consistent with its silver-dominant production base
- Equinox Gold also fell 4.0%, partly reflecting broader sector sentiment
The Equity Damage: Mining Stocks Absorbing Disproportionate Pressure
2026 Year-to-Date Performance Across Major Producers
The cumulative impact of gold's decline from its 2026 highs, rising rate-hike odds, and the unwinding of geopolitical premiums has produced severe year-to-date losses across the gold equity complex. Furthermore, understanding gold's impact on mining equities helps contextualise just how acute the leverage effect has become:
| Company | YTD 2026 Performance | Key Contextual Factor |
|---|---|---|
| Equinox Gold | -35% | Broad sector de-rating and silver leverage |
| Gold Fields | -26% | Rate sensitivity and operating cost pressures |
| Alamos Gold | -26% | Valuation compression in mid-tier space |
| Hecla Mining | -25% | Amplified by silver underperformance |
| Fresnillo | -24% | Partially offset by strong H1 gold output guidance |
| Kinross Gold | -17% | Rate cut expectation unwind |
| Barrick Gold | -16% | Operational challenges |
| Agnico Eagle | -14% | Barnat pit suspension in Quebec adds July losses |
| Newmont | -8% | Partial support from Lihir production ramp-up |
| Franco-Nevada | +1.8% | Royalty and streaming model provides insulation |
The Royalty Model Advantage in High-Uncertainty Environments
Franco-Nevada's positive year-to-date return of +1.8% stands as the sole bright spot across the major precious metals equity universe and deserves analytical attention beyond the headline figure.
Royalty and streaming companies do not operate mines. They provide upfront capital to mining companies in exchange for the right to purchase a percentage of future production at predetermined prices, or to receive a percentage of revenues. This structure eliminates exposure to operating cost inflation, capital expenditure overruns, and site-specific operational disruptions.
When gold prices fall and mining company margins compress disproportionately due to fixed cost structures, royalty companies' income streams decline more modestly. In an environment where the broader sector has shed enormous value, Franco-Nevada's resilience illustrates why many sophisticated investors treat royalty and streaming exposure as a structurally lower-volatility vehicle for precious metals participation.
The Scale of Sector-Wide Wealth Destruction
The broader context for gold equity underperformance is sobering. The world's 50 largest mining companies collectively erased approximately $228 billion in market capitalisation during the second quarter of 2026, with gold producers accounting for a disproportionate share of that destruction. This scale of value erosion reflects the acute sensitivity of mining equity valuations to real yield movements and the rapid unwinding of premiums built up over months of geopolitical escalation.
Agnico Eagle's situation illustrates how company-specific operational factors can compound sector-wide pressure. The suspension of mining at its Barnat pit in Quebec added additional drag to an already difficult period, contributing to a loss of more than 7% in July alone on top of the year-to-date decline of 14%.
Newmont, however, presents a contrasting case. Its planned 5-million-ounce production boost from the Lihir gold mine in Papua New Guinea represents a specific operational catalyst that has partially insulated its equity from the broader sector selloff, contributing to its relatively more modest year-to-date decline of 8%.
The next major ASX story will hit our subscribers first
Market Infrastructure Evolves: CME's 24/7 Gold Futures Launch
What Does Round-the-Clock Trading Mean for Price Discovery?
Amid the bearish near-term price action, a structurally significant development occurred over the preceding weekend. CME Group's launch of continuous gold futures trading around the clock attracted stronger-than-anticipated participation, with approximately 15,000 contracts traded during the inaugural session, representing roughly $60 million in notional value.
The one-ounce contract size is deliberately accessible, designed to attract retail participants and smaller institutional accounts that find the standard 100-ounce Comex gold futures contract prohibitively large for precise position management. This democratisation of futures market access has parallels in other commodity markets and equity index futures, where smaller contract sizes have historically expanded the participant base substantially over time.
From a price discovery perspective, 24/7 trading reduces the information gaps that currently exist between the close of North American trading and the opening of Asian markets. Price adjustments that previously occurred as large opening gaps can instead occur incrementally across continuous trading sessions, potentially reducing volatility at traditional open and close windows.
Potential Catalysts for Gold's Recovery
Scenario Analysis: What Could Reverse the Current Pressure?
For investors assessing positioning ahead of the Fed decision and beyond, three distinct recovery scenarios merit consideration:
-
A dovish Fed outcome in which rates are held steady and forward guidance is neutral or patient would likely trigger a short-covering rally, with near-term recovery targets clustered around $4,100 to $4,200. The existing ETF inflow momentum would likely accelerate rapidly in this scenario as the marginal seller retreats.
-
Geopolitical re-escalation in the Middle East, whether through a breakdown in US-Iran negotiations or renewed Strait of Hormuz disruption, would simultaneously push energy prices higher, reignite inflation expectations, and rebuild the war premium that has been systematically unwound over recent weeks. Silver would likely outperform in this scenario given its dual monetary and industrial demand profile.
-
Dollar weakness driven by fiscal dynamics represents a longer-dated but structurally persistent risk. Growing concerns about US fiscal sustainability and widening deficit projections could independently weaken the dollar in ways unrelated to monetary policy, providing a non-monetary support mechanism for gold that operates independently of the Fed decision cycle.
Disclaimer: The scenario projections described above represent analytical frameworks for considering possible outcomes, not investment recommendations. Commodity markets carry substantial risk, and past price behaviour is not indicative of future performance. Investors should conduct independent research and consult qualified financial advisors before making investment decisions.
Frequently Asked Questions
What does it mean when gold tests the $4,000 floor?
A floor test occurs when a price repeatedly approaches a support level without decisively breaking through it. Each failed breakdown reinforces the level's significance and confirms active buying interest at that price point. The current pattern, with intraday dips recovering quickly, suggests buyers are present but conviction is limited ahead of the Fed announcement.
Why does silver fall faster than gold during risk-off episodes?
Silver's dual identity as both a monetary safe-haven asset and an industrial commodity means that when economic growth concerns rise alongside monetary uncertainty, it faces selling pressure from two directions simultaneously. Gold, which has minimal industrial demand relative to its monetary role, does not face this same dual pressure.
Why do gold mining stocks fall more than the gold price itself?
Mining companies carry significant fixed operating costs. When gold prices fall, revenues decline while a substantial portion of costs remain constant, compressing profit margins by a percentage far exceeding the metal price decline. This operational leverage, which amplifies gains during bull markets, also amplifies losses during corrections.
What is the gold-silver ratio and why does it matter?
The gold-silver ratio measures how many ounces of silver are required to purchase one ounce of gold. A rising ratio during a precious metals decline indicates silver is underperforming gold, which historically signals that industrial demand anxiety is contributing to the selloff rather than pure monetary concerns. Monitoring this ratio provides insight into whether market stress is primarily inflation-driven or growth-driven in nature.
Ready to Position Yourself Ahead of the Next Major ASX Gold Discovery?
While global gold markets navigate critical price floors and Fed-driven volatility, Discovery Alert's proprietary Discovery IQ model scans ASX announcements in real time, instantly identifying significant mineral discoveries across gold and beyond — explore historic discoveries and their extraordinary returns, then begin your 14-day free trial to ensure you're positioned before the broader market moves.