June 20, 2026
The Hidden Architecture of a Gold Market in Transition
Precious metals markets move in cycles that operate simultaneously across multiple timeframes, and understanding those cycles accurately is what separates reactive investors from strategic ones. In mid-2026, this gold price exclusive update reveals one of the most technically layered environments in recent memory, where the macro cycle tells one story and the short-term price action tells another. Understanding the gap between these two narratives is not just analytically interesting — it may be among the most consequential positioning decisions facing gold investors right now.
When big ASX news breaks, our subscribers know first
Where Gold Prices Stand After an Extraordinary Rally
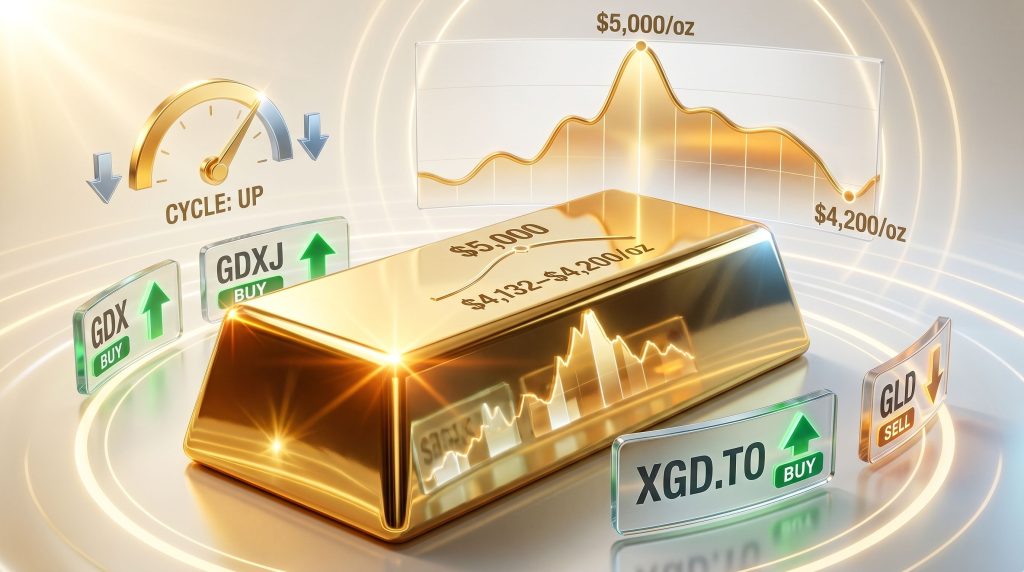
Gold's trajectory through 2026 has been nothing short of remarkable. Spot prices surged above $5,000 per troy ounce at their peak, a level that would have seemed speculative just a few years ago. As of June 20, 2026, prices have retreated into the $4,132 to $4,200/oz range, representing a correction of more than $800/oz from those cycle highs.
This is not the collapse of a bull market. Corrections of this magnitude are a structural feature of commodity cycles, not an aberration. What makes the current setup analytically compelling is the divergence unfolding across different instruments within the gold complex simultaneously. You can track the live gold price to monitor these movements in real time.
Key price context to understand the current environment:
- Gold surged above $5,000/oz during the early 2026 rally, one of the most extreme moves in modern market history
- The subsequent pullback to the $4,132 to $4,200/oz range represents a correction exceeding $800/oz from peak levels
- Despite this retreat, gold remains at historically elevated valuations relative to its 10-year average
- Intraday volatility has been significant, with AP-reported data showing gold briefly reaching $4,326/oz on a single June 2026 trading session during a safe-haven surge
"The scale of the preceding rally means that even a correction of this size leaves gold at price levels that would have defined generational highs in prior decades. Context matters enormously when interpreting pullbacks in long-cycle commodity markets."
Understanding the Cycle Indicator Framework
What a Proprietary Cycle Model Actually Measures
The most critical signal in the current analysis is the status of the sector cycle indicator, which has turned UP as of the June 20, 2026 update. To understand why this matters, it is worth examining what cycle indicators actually measure and how they differ from conventional technical tools.
Most retail investors are familiar with trend-following indicators such as moving averages, which confirm direction after price has already moved. Cycle indicators function differently. They are designed to identify recurring patterns of expansion and contraction in asset prices, with the goal of anticipating inflection points before they become obvious in price action. Furthermore, understanding gold market cycles can provide important context for interpreting these signals across secular timeframes.
| Indicator Type | Primary Function | Lag Profile | Typical User |
|---|---|---|---|
| 50/200 Day EMA | Trend confirmation | High lag | Long-term investors |
| RSI / MACD | Overbought and oversold detection | Medium lag | Short-term traders |
| Proprietary Cycle Models | Timing entry and exit at cycle turns | Low lag when accurate | Both investors and traders |
| Volume-Based Signals | Measuring conviction behind price moves | Real-time | Active traders |
How the Cycle Signal Applies Differently Across Investor Types
The same cycle signal carries different practical implications depending on investment horizon. This distinction is frequently misunderstood and can lead to costly misapplication.
For long-term investors:
- An up cycle confirmation functions as a structural green light to accumulate positions and hold through short-term volatility
- The cycle signal acts as a filter against panic-selling during temporary pullbacks within a broader uptrend
- Position sizing decisions are guided by cycle phase, not by short-term price fluctuations
For active traders:
- The cycle signal defines entry zones at cycle bottoms and profit-taking zones at cycle tops
- Short-term whipsaws — periods where price briefly moves against the dominant cycle direction — represent a known risk and require disciplined stop-loss management
- Traders look for signal convergence across multiple instruments before committing capital
"No cycle model delivers perfect accuracy in all market conditions. Elevated volatility, macro shocks, and liquidity events can generate false signals. Risk management must function independently of any single indicator, regardless of its historical track record."
The Divergence That Defines This Market: GLD vs. the Mining Sector
A Multi-Instrument Signal Breakdown as of June 2026
One of the most analytically significant features of the current environment is the pronounced divergence between physical gold proxies and gold mining equities. This is not a minor variation across instruments. It is a structured separation that carries meaningful directional information for anyone following gold and mining equities closely.
| Instrument | Signal Type | Directional Implication |
|---|---|---|
| GLD (SPDR Gold Trust) | Short-term sell signal | Physical gold proxy facing near-term price pressure |
| GDX (VanEck Gold Miners ETF) | Short-term buy signal | Large-cap gold miners showing relative strength |
| XGD.TO (S&P/TSX Global Gold Index ETF) | Short-term buy signal | Canadian-listed gold equities confirming sector momentum |
| GDXJ (VanEck Junior Gold Miners ETF) | Short-term buy signal | Junior miners leading, historically a risk-on signal within the sector |
Why Mining Equities Can Lead Physical Gold
The pattern of mining stocks outperforming physical gold is a recognised dynamic in precious metals technical analysis, and it carries specific interpretive weight. Several mechanisms explain this relationship.
Operational leverage: Mining equities amplify gold price movements through their cost structures. A 10% rise in gold prices can translate into a disproportionately larger improvement in mining company profit margins, making equities more sensitive to anticipated price recoveries than spot gold itself.
Forward earnings pricing: Equity markets incorporate expectations about future earnings, not just current conditions. When mining stocks show strength while spot gold weakens, it may reflect the market pricing in a gold price recovery before it materialises.
Sentiment rotation: Speculative capital often rotates into mining equities ahead of moves in the underlying metal, particularly when physical gold speculation has become compressed to historically low levels, as is currently the case.
"The simultaneous buy signal across GDX, GDXJ, and XGD.TO against a concurrent sell signal in GLD suggests the market is rotating within the gold complex rather than abandoning the sector entirely. Rotation is fundamentally different from distribution."
Three Structural Forces Shaping the Macro Environment
The Macro Signal Matrix: June 2026
| Factor | Current Status | Gold Price Impact |
|---|---|---|
| USD Trend | Uptrend with buy signal on USD/gold ratio | Bearish for gold near-term |
| Safe-Haven Demand | Elevated, with episodic surge events | Structurally bullish |
| Speculative Positioning | Compressed to bear market levels | Contrarian bullish signal |
| Gold Sector Cycle | UP | Structurally bullish medium-term |
| Short-Term Gold Trend | Downtrend | Near-term bearish |
| Gold Equity Trend | Downtrend | Near-term bearish |
| Fed Policy Posture | Hawkish signals active | Bearish for gold |
Force 1: The US Dollar as a Structural Headwind
Gold is globally priced in US dollars, which means the direction of the USD carries direct implications for gold demand across non-dollar economies. The USD is currently in an uptrend, and the USD-to-gold ratio is confirming a buy signal for the dollar. When the greenback strengthens, international buyers face a higher effective cost for gold in their local currencies, which systematically suppresses demand at the margin.
Force 2: Episodic Safe-Haven Demand
Geopolitical uncertainty and macroeconomic stress events continue to generate episodic demand spikes. Gold safe-haven demand illustrated its potency during the brief intraday surge to $4,326/oz seen in a single June 2026 trading session. Longer-term, central bank gold demand — particularly among economies seeking to reduce USD reserve exposure — represents a structural demand pillar that exists independent of speculative flows.
Force 3: Speculative Positioning at Contrarian Extremes
Perhaps the most underappreciated signal in the current environment is the compression of speculative positioning to levels consistent with bear market valuations. This is measured through futures market open interest, options positioning, and sentiment surveys. When speculative interest reaches extreme lows, the pool of potential sellers is largely exhausted. Contrarian analysis consistently identifies these moments as fertile conditions for cycle bottoms, even when trend indicators remain negative.
The 50/200 EMA Framework: Regime-Dependent Interpretation
Why the Same Indicator Works Differently in Bull and Bear Markets
The 50-day and 200-day exponential moving averages are among the most widely referenced technical levels in global markets. Their function, however, is not fixed. It changes depending on the prevailing market regime, and misapplying the framework is one of the most common and costly errors in gold technical analysis.
In bull market conditions:
- The 50 EMA and 200 EMA function as dynamic support levels
- Pullbacks to these levels represent low-risk accumulation opportunities for trend-aligned investors
- Buyers who establish positions at EMA support during uptrends historically achieve superior average entry prices
In bear market conditions:
- The identical EMA levels become resistance zones rather than support
- Rallies toward the 50 or 200 EMA during downtrends represent exit opportunities or potential short-entry zones for active traders
- Buying into EMA levels during a bear phase using bull-market logic is a structural error that compounds losses
Step-by-Step: Applying the EMA Framework to Gold Markets
- Determine the prevailing trend using a higher-timeframe chart (weekly or monthly)
- Identify the current market regime — whether gold is in a structural bull or bear phase
- Wait for price to approach a relevant EMA level (50-day or 200-day)
- Apply the appropriate framework: support logic in bull markets, resistance logic in bear markets
- Confirm with additional signals including cycle indicator status, volume patterns, and momentum readings
- Execute only with defined risk parameters established before entering the trade
The next major ASX story will hit our subscribers first
Identifying a Low-Risk Setup: What Convergence Actually Looks Like
Current Setup Assessment as of June 20, 2026
| Condition | Current Status | Trade-Ready Signal |
|---|---|---|
| Gold sector cycle | UP | Positive |
| Short-term gold price trend | Downtrend | Caution required |
| GDX signal | Short-term buy | Positive |
| GDXJ signal | Short-term buy | Positive |
| XGD.TO signal | Short-term buy | Positive |
| Speculative positioning | Bear market levels | Contrarian positive |
| USD trend | Uptrend with headwind | Monitoring required |
| Confirmed low-risk setup | Pending convergence | Watching for alignment |
A disciplined low-risk setup in gold trading requires more than a single favourable signal. It demands convergence across cycle direction, short-term trend alignment, speculative positioning, and EMA positioning. As of June 20, 2026, the conditions are moving toward alignment but have not fully converged. The strategic posture is one of active observation rather than immediate commitment.
For further context on what may follow this transitional phase, this gold price speculative analysis for 2026 provides additional forward-looking considerations worth reviewing.
"Patience is not passivity. Waiting for signal convergence before entering positions is itself a risk management discipline that protects capital from premature deployment into conditions that have not yet confirmed."
Frequently Asked Questions on Gold Cycle Signals
What does it mean when the gold sector cycle is up but the price trend is down?
The cycle indicator and the price trend operate on different timeframes. An up cycle reflects the medium-to-long-term directional bias, while a downtrend reflects near-term price pressure. These two conditions coexist during transition phases because cycle indicators typically turn before price trends confirm the new direction. This gold price exclusive update specifically highlights this transitional dynamic.
Why are gold mining ETFs showing buy signals when physical gold carries a sell signal?
Mining equities incorporate forward earnings expectations and operational leverage, meaning they frequently lead physical gold prices. A divergence of this nature — with miners on buy signals and spot gold facing selling pressure — can indicate that equity markets are anticipating a gold price recovery ahead of its appearance in spot prices.
What does bear market speculative value mean in this context?
When speculative positioning in futures and options markets falls to levels historically associated with bear market sentiment, it signals that pessimism has reached an extreme. Contrarian analysis treats these moments as precursors to sentiment reversals, because the pool of remaining sellers is largely exhausted. Consequently, this compression in positioning is one of the most structurally bullish signals present in today's gold price exclusive update.
How does the rising USD directly affect gold prices?
Gold is denominated in US dollars globally. A stronger USD makes gold more expensive for buyers using non-dollar currencies, which systematically reduces international demand and creates downward price pressure. The current USD uptrend represents a meaningful structural headwind for gold in the near term, and this gold price exclusive update identifies it as the primary macro risk to monitor.
Disclaimer: This article is for informational and educational purposes only and does not constitute financial advice. Gold markets involve significant price volatility and risk. Past cycle patterns and technical signals do not guarantee future results. All investment decisions should be made in consultation with a qualified financial adviser and based on individual risk tolerance and financial circumstances.
Ready to Capitalise on the Next Major ASX Mineral Discovery?
Discovery Alert's proprietary Discovery IQ model delivers real-time alerts on significant ASX mineral discoveries, transforming complex market data into actionable insights for both short-term traders and long-term investors — start your 14-day free trial today, or explore Discovery Alert's dedicated discoveries page to understand how historic mineral discoveries have generated extraordinary market returns.