
August 6, 2026
The Hidden Language of Gold Markets Most Traders Misread
Precious metals markets have a long history of sending mixed signals, particularly during transitional phases when short-term price momentum contradicts the broader structural trend. Understanding how to read these divergences, rather than reacting to surface-level price moves, separates disciplined market participants from those who repeatedly buy strength and sell weakness at exactly the wrong moment. This gold price exclusive update breaks down exactly where the market stands as of July 18, 2026, including technical cycle readings, ETF signal divergences, USD dynamics, and forward-looking scenario analysis.
Mid-2026 represents one of those periods. Gold has experienced a dramatic repricing cycle within just six months, collapsing roughly 28-30% from its January 2026 all-time high while still registering a near-20% gain on a year-over-year basis. That paradox is not a contradiction — it is the gold market doing precisely what it has always done: rewarding long-term structural holders while punishing short-term reactionary traders who mistake a daily bounce for a trend reversal.
When big ASX news breaks, our subscribers know first
Gold Pricing Snapshot: July 18, 2026
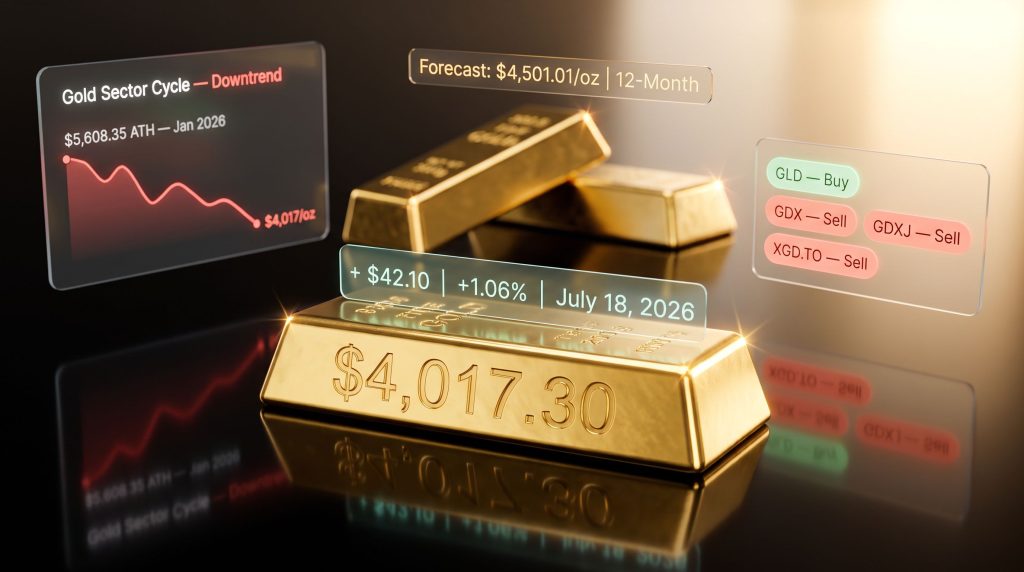
Gold is currently trading in a narrow intraday band, with bid prices sitting at $4,017.30 per troy ounce and ask prices at $4,019.30, representing a 24-hour gain of approximately $42.10, or +1.06%. On a per-gram basis, that translates to roughly $129.16, and per kilogram, the figure sits at approximately $129,161.17.
Regional pricing data adds further texture to the global demand picture. For those wanting to track movements in real time, goldprice.org provides continuously updated spot prices across multiple currencies.
- Indian MCX (per 10 grams): ₹141,006, up approximately +0.47%
- Pakistan (per tola): gaining approximately Rs 2,400 in recent trading sessions
- BullionVault spot price (per oz): $4,019.28, updated as of July 17, 22:00 GMT
These figures confirm that while daily price action is modestly positive, the broader multi-week trend remains under pressure — a distinction that cycle-based technical models are specifically designed to capture.
Performance Context: Reading Gold Across Multiple Timeframes
One of the most important disciplines in precious metals analysis is avoiding the trap of interpreting short-term data through a long-term lens, or vice versa. The current market illustrates this perfectly.
| Timeframe | Performance |
|---|---|
| Last 24 Hours | +1.06% (+$42.10) |
| Last 30 Days | -4.59% |
| Year-Over-Year | +19.87% |
| All-Time High (January 2026) | $5,608.35/oz |
Gold peaked at $5,608.35 per troy ounce in January 2026, a level that represented an extraordinary run-up driven by a confluence of macroeconomic pressures, geopolitical uncertainty, and institutional safe-haven demand. Since that peak, prices have retraced to the $4,000–$4,020 range, a pullback of roughly 28-30% that has technically invalidated the uptrend on most medium-term models.
Despite this, the year-over-year gain of nearly 20% reminds longer-horizon investors that the structural bull market thesis for gold has not been dismantled, only paused. Furthermore, understanding gold as a safe haven during volatile periods helps contextualise why long-term holders remain committed despite near-term turbulence. The critical distinction is between cyclical corrections within a secular bull market and genuine trend reversals.
What the July 15 Reaction Revealed
A brief but important event occurred on July 15, 2026, when spot gold spiked above $4,060 per ounce following a surprise expansion in the New York manufacturing index, which printed at 15.6, substantially above consensus expectations. This type of sharp, data-driven response reveals two things simultaneously: gold's sensitivity to macro surprises remains high, and the market lacks sufficient underlying conviction to sustain those moves beyond the initial reaction. Price retreated relatively quickly, reinforcing the broader downtrend narrative.
Cycle Indicators and What They Are Actually Telling You
Technical cycle analysis operates on a fundamentally different logic than traditional price charting. Rather than focusing purely on support and resistance levels, cycle models attempt to identify the rhythmic phases of market expansion and contraction, categorising the market as being in an upswing, a downswing, or a transition zone.
The current cycle configuration for the gold sector is unambiguous:
- Overall Gold Sector Cycle: Pointing downward
- Gold Price Trend: Confirmed downtrend
- Gold Equities Trend: Confirmed downtrend
- USD Trend: Confirmed uptrend (a structural headwind for gold)
- Speculation Index: Registering at bear market valuation levels
- Gold-to-USD Ratio: On a sell signal
Important context for readers: Cycle indicators are analytical tools that reflect current market structure and momentum. They are not predictive instruments and are subject to whipsaw signals during high-volatility or transitional market environments. Experienced analysts use these tools in conjunction with broader context rather than in isolation.
One technically notable development is that a previously established resistance zone has now converted into structural support. This is a classically bullish structural shift known as role reversal, suggesting the market has absorbed prior selling pressure at that price level. However, until broader trend indicators confirm a directional change, this pattern alone is insufficient to justify aggressive long positioning.
The ETF Signal Divergence: A Critical Distinction Most Investors Overlook
Perhaps the most analytically significant observation in the current gold market is the divergence between the signals being generated by physical gold ETFs versus gold mining equity ETFs. This divergence is widely misunderstood and frequently leads retail investors to draw incorrect conclusions about sector-wide momentum. In addition, exploring the relationship between gold and mining equities provides essential context for interpreting these conflicting signals.
| Instrument | Asset Type | Current Short-Term Signal |
|---|---|---|
| GLD (SPDR Gold Shares) | Physical Gold ETF | Buy Signal |
| GDX (VanEck Gold Miners) | Large-Cap Gold Miners ETF | Sell Signal |
| GDXJ (Junior Gold Miners) | Small/Mid-Cap Miners ETF | Sell Signal |
| XGD.TO (TSX Gold Index) | Canadian Gold Miners | Sell Signal |
The fact that GLD carries a short-term buy signal while GDX, GDXJ, and XGD.TO are all on sell signals is not a contradiction. It reflects a well-documented phenomenon in commodities markets: physical commodity prices and the equities of companies that produce those commodities are fundamentally different assets with different risk profiles.
Several factors explain why mining equities can diverge sharply from spot gold:
- Operating cost structures: Mining companies face fixed and variable costs including energy, labour, equipment, and permitting that do not move in lockstep with gold prices.
- Leverage asymmetry: Mining stocks are leveraged proxies for gold. This works brilliantly on the upside during bull phases but magnifies losses on the downside.
- Equity market correlation: During periods of broader equity market stress, mining stocks often trade in correlation with general market indices regardless of what gold itself is doing.
- Hedging and forward sales: Some producers have sold forward production at prices below current spot, creating a disconnect between reported earnings and prevailing commodity prices.
A buy signal on GLD does not validate a bullish view of gold mining equities. These instruments require entirely separate analytical frameworks, and conflating them is one of the most common and costly errors in precious metals investing.
Why the USD Uptrend Is the Most Important Variable Right Now
The confirmed uptrend in the US Dollar Index sits at the centre of the current bearish cycle for gold. The inverse relationship between the USD and gold is one of the most structurally reliable dynamics in financial markets, though it is frequently oversimplified in mainstream commentary.
A rising dollar affects gold through several transmission mechanisms:
- Purchasing power friction: Since gold is priced globally in USD, a stronger dollar increases the effective cost of gold for buyers operating in other currencies, systematically suppressing international demand.
- Opportunity cost dynamics: A rising dollar often coincides with elevated real interest rates, increasing the opportunity cost of holding non-yielding assets like gold.
- Risk sentiment signalling: USD strength can reflect tightening financial conditions globally, which in certain environments reduces the urgency of safe-haven allocation.
- Carry trade dynamics: Institutional positioning shifts away from gold during USD uptrends as currency carry trades become more attractive.
The gold-to-USD ratio currently sitting on a sell signal reinforces the view that any short-term bounces in gold price are likely to be sold into, rather than sustained, until the dollar trend reverses. Furthermore, central bank gold demand represents an additional variable that could counterbalance dollar-driven headwinds if accumulation programmes accelerate.
The next major ASX story will hit our subscribers first
What Bear Market Speculation Readings Actually Mean for Contrarian Investors
The speculation index registering at bear market valuation levels is a data point that deserves careful interpretation rather than reflexive optimism. Contrarian investors often view extreme bearishness as a precursor to market bottoms, applying the logic that when everyone who wants to sell has already sold, the path of least resistance is upward.
However, the timing risk is substantial. Bear market speculation readings can persist for extended periods, particularly when they coincide with:
- Confirmed structural downtrends in both the commodity and its equity proxies
- A strengthening USD environment that maintains ongoing selling pressure
- Margin compression narratives in the mining sector that discourage new institutional accumulation
The more nuanced interpretation is that bear market speculation levels define the conditions for a potential bottom, not the timing of one. Identifying when sentiment has reached an inflection point requires additional confirmation from price action and cycle reversals before positioning becomes prudent.
Analyst Forecasts and Scenario Analysis for H2 2026
Current analyst consensus estimates position gold at approximately $4,203.76 per ounce by end of Q3 2026 and $4,501.01 per ounce on a 12-month forward basis. These projections imply a meaningful recovery from current levels but remain well below the January 2026 all-time high of $5,608.35 per ounce. For broader context, reviewing gold price forecasts from leading analysts helps situate these figures within longer-term structural expectations.
| Forecast Horizon | Analyst Consensus Estimate |
|---|---|
| End of Q3 2026 | $4,203.76/oz |
| 12-Month Forward | $4,501.01/oz |
| All-Time High (Jan 2026) | $5,608.35/oz |
Three plausible scenarios could define gold's trajectory through the remainder of 2026:
Scenario 1: Bearish Continuation
The USD maintains its uptrend, macro data continues to surprise positively, and risk appetite shifts away from safe-haven assets. In this environment, gold tests lower structural support zones, mining equities face sustained margin compression, and even physical gold demand softens.
Scenario 2: Extended Consolidation
Gold enters a prolonged range-bound phase, neither breaking materially lower nor recovering convincingly. Speculation levels remain depressed, volatility compresses, and cycle indicators generate neutral or mixed readings. This is often the least actionable environment for traders but can represent a base-building phase for longer-term investors.
Scenario 3: Macro Catalyst-Driven Recovery
A shift in Federal Reserve policy direction, an unexpected geopolitical development, or a significant deterioration in USD confidence triggers a reversal in the prevailing trend. Gold breaks above key resistance, cycle indicators flip bullish, and mining equities recover sharply through their inherent operational leverage.
A Framework for Positioning in the Current Environment
Given the full picture of technical signals, cycle readings, and macro dynamics, a structured approach to positioning is more valuable than a binary long or short conclusion. Consequently, considering gold-silver ratio analysis alongside these signals can offer additional perspective on relative value across the precious metals complex.
For long-term investors:
- Avoid aggressively adding to positions while the overall cycle and trend remain in confirmed downtrend territory
- Use the near-20% year-over-year gain as evidence that the structural bull market thesis remains intact, but resist the urge to average down into weakness without cycle confirmation
- Monitor for a definitive cycle reversal signal before meaningfully increasing exposure
For active traders:
- The current environment does not offer a high-conviction directional trade in gold equities, given the uniform sell signals across GDX, GDXJ, and XGD.TO
- GLD's short-term buy signal may offer a tactically limited opportunity for experienced traders, but position sizing should reflect the broader bearish cycle context
- Forcing trades in an uncertain or bearish cycle phase is statistically among the lowest-probability strategies available
For risk-aware participants:
- Remaining in cash during confirmed bearish cycle phases is not a passive choice — it is an active risk management decision with genuine strategic merit
- Bear market speculation readings historically precede either capitulation lows or extended sideways consolidation, both of which can extend longer than most market participants expect
This gold price exclusive update underscores that the current environment rewards patience and analytical rigour above all else. Those who understand speculative exhaustion and USD dynamics will be far better positioned to act decisively when the cycle eventually turns.
Disclaimer: All technical signals, cycle readings, and analyst forecasts discussed in this article are for informational and educational purposes only. They do not constitute financial advice, investment recommendations, or a guarantee of future performance. Precious metals markets carry significant risks, and past performance of technical models is not indicative of future results. Readers should conduct their own due diligence and consult a qualified financial adviser before making any investment decisions.
Frequently Asked Questions
What is the gold price per ounce as of July 18, 2026?
Gold is trading at approximately $4,017.30 (bid) to $4,019.30 (ask) per troy ounce, reflecting a 24-hour gain of roughly +$42.10, or +1.06%.
Why does gold show a daily gain but remain in a downtrend?
Daily price movements capture intraday or 24-hour momentum, not structural trend direction. Technical trend analysis examines broader price structure, momentum indicators, and cycle positioning across weeks and months. A single positive session does not reverse a confirmed downtrend.
What does bear market speculation actually signal?
Speculation metrics reaching bear market territory indicate that participants have significantly reduced bullish positioning in gold. Historically, this has sometimes preceded market bottoms, but the timing signal is imprecise and requires cycle confirmation before acting on a contrarian basis.
Why are mining ETFs on sell signals while GLD shows a buy signal?
Physical gold and gold mining equities are distinct asset classes with different risk profiles, cost structures, and market sensitivities. Mining companies carry operational leverage, cost pressures, and equity market correlations that cause them to diverge from spot gold, particularly during bearish commodity cycles.
What was gold's all-time high price?
Gold reached its all-time high of $5,608.35 per troy ounce in January 2026.
What are the forward price forecasts for gold?
Current analyst consensus estimates project gold at approximately $4,203.76/oz by end of Q3 2026 and $4,501.01/oz on a 12-month forward basis. These are projections based on prevailing analytical models and are subject to material revision based on macroeconomic developments.
Want to Catch the Next Major ASX Mineral Discovery Before the Broader Market Does?
Discovery Alert's proprietary Discovery IQ model delivers real-time alerts on significant ASX mineral discoveries, instantly converting complex geological and commodity data into actionable investment insights for both short-term traders and long-term investors — explore historic discoveries and their exceptional returns to understand the opportunity, then begin your 14-day free trial at Discovery Alert to position yourself ahead of the market.