
July 24, 2026
When Market Signals Diverge: What the Gold Price Is Really Telling You in May 2026
Few moments in precious metals investing are more instructive than when short-term technical signals and long-term structural indicators point in opposite directions. This kind of divergence is not a contradiction to be feared but a nuance to be understood. For participants in the gold market, navigating this signal environment requires clarity about timeframes, position types, and the distinct roles that cycle analysis and trend-following tools each play in a complete investment framework.
The gold price update for May 2026 presents exactly this kind of environment: a macro cycle reading that favours accumulation sitting alongside near-term technical signals urging caution. Understanding why these two readings can coexist, and what each one means for different types of market participants, is the foundation of any serious approach to gold investing in the current climate.
When big ASX news breaks, our subscribers know first
Where Gold Prices Stand in May 2026
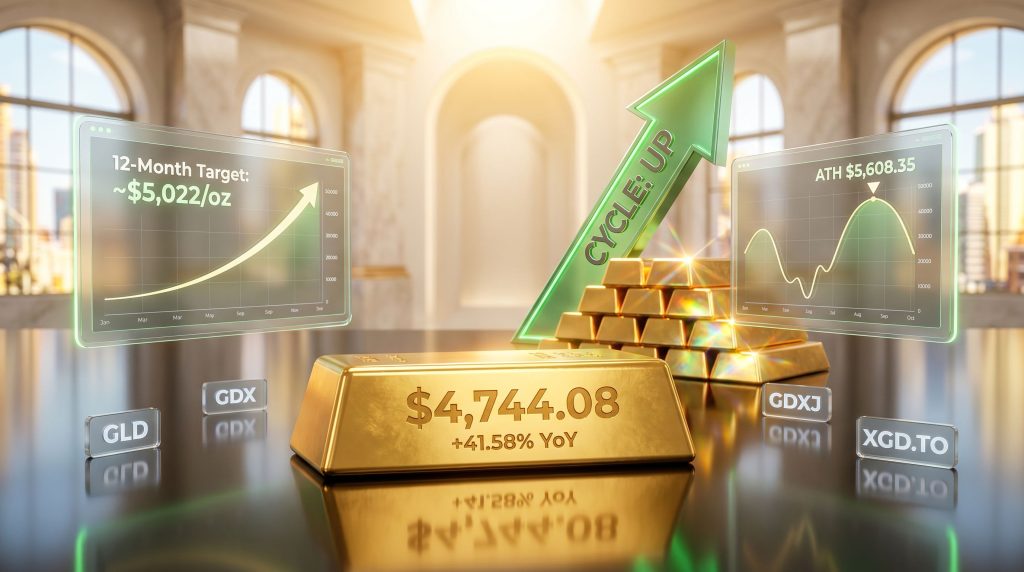
Spot gold prices are trading in the $4,700 to $4,744 USD per troy ounce range as of May 8 to 9, 2026. This pricing snapshot, drawn from major bullion platforms including Trading Economics, BullionVault, Monex, USA Gold, and JM Bullion, reflects a market that has delivered extraordinary long-term performance while undergoing a meaningful near-term consolidation.
The headline figures tell a compelling story:
- Year-over-year appreciation of approximately +41.58%, making gold one of the strongest performing asset classes over the past twelve months
- A ~16% retracement from the 2026 all-time high of $5,608.35 per troy ounce, recorded earlier in the year
- A modest -1.19% monthly decline, suggesting the consolidation phase is measured rather than a structural breakdown
- Silver trading above $80 per troy ounce, an eight-week high, reinforcing broad precious metals complex strength
| Platform | Spot Price (USD/oz) | Movement | Notable Context |
|---|---|---|---|
| Trading Economics | $4,706.36 | +0.43% daily | 12-month model forecast: $5,022/oz |
| BullionVault | $4,715.66 | +2.19% weekly | Silver at 8-week high above $80/oz |
| Monex | $4,714.00 | +$17 (+0.36%) | Per gram equivalent: ~$151.56 |
| USA Gold | $4,740.42 | +$46.12 (+0.98%) | Recovery driven by geopolitical signals |
| JM Bullion | $4,744.08 | Steady | Safe-haven demand sustaining price floor |
It is worth noting that published spot prices represent theoretical mid-market rates. Physical product transactions carry additional premiums. A one-ounce bar purchased through a retail dealer may reflect a spread of $150 to $200 above spot, depending on product type, dealer margin, and regional supply conditions. Indian consumers have reportedly been among the most price-sensitive, with elevated gold prices constraining retail demand in one of the world's largest physical gold markets.
The Cycle Indicator: What It Measures and Why It Matters
The most significant data point from the May 9, 2026 technical update is a straightforward one: the gold sector cycle indicator has turned UP. For participants unfamiliar with cycle-based analysis, this warrants some explanation.
Market cycle indicators are distinct from price trend or momentum tools. Rather than measuring the current direction of prices, a cycle indicator attempts to identify where the market sits within its broader expansion and contraction rhythm. The goal is to locate inflection points, specifically the transitions between accumulation phases and distribution phases, before they are confirmed by price alone.
The practical application differs significantly depending on investment horizon:
- Long-term investors treat a cycle upturn as an accumulation window, building exposure gradually with the understanding that short-term volatility will occur within the larger upward structure
- Active traders seek to enter near confirmed cycle lows and exit near cycle highs, capturing compressed return windows through tactical positioning
- Risk managers use cycle context to scale position sizes, reducing exposure during confirmed downturns and increasing it during validated upswings
Cycle tools are most effective when used in combination with trend confirmation and momentum filters. Used in isolation, any single indicator carries elevated false-signal risk, particularly during high-volatility macro environments.
The current UP reading suggests the structural backdrop favours gold ownership over the medium term. Critically, this does not eliminate the possibility of further near-term price weakness. Cycle indicators are directional, not price-level tools. They indicate the environment is broadly constructive, not that a specific price will be achieved by a specific date.
Short-Term Technical Signals: A Uniform Caution Flag
While the cycle indicator points upward, short-term technical signals across major gold-linked instruments are uniformly on sell signals as of May 9, 2026. Furthermore, this includes a broad range of instruments:
| Instrument | Short-Term Signal | Primary Implication |
|---|---|---|
| GLD (SPDR Gold Shares ETF) | Sell | Near-term pressure on gold's primary listed proxy |
| GDX (VanEck Gold Miners ETF) | Sell | Senior producer equities facing near-term headwinds |
| XGD.TO (TSX Gold Index) | Sell | Canadian-listed gold companies under pressure |
| GDXJ (Junior Gold Miners ETF) | Sell | Smaller producers most exposed to short-term corrections |
This alignment is notable. When all four major gold investment vehicles simultaneously produce sell signals, it typically reflects one of three scenarios:
- A consolidation phase within a larger uptrend, where profit-taking and USD strength create temporary price compression
- A re-entry window forming, as markets establish lower-cost accumulation points before the next advance
- A patience test for longer-term holders, where elevated volatility creates noise that does not alter the underlying investment thesis
The simultaneous sell reading across GLD, GDX, XGD.TO, and GDXJ does not indicate a structural break in the gold bull market. It indicates that new long entries carry near-term timing risk. For active traders, waiting for short-term signal reversals before initiating positions is the prudent approach. For long-term accumulators, the current price level may represent a more attractive entry point relative to the 2026 all-time high, though position sizing during mixed-signal environments warrants conservatism. The gold price movement's impact on mining equities is an important consideration here.
The USD Factor: Understanding the Headwind Gold Is Facing
One of the most consistently misunderstood dynamics in precious metals investing is the inverse relationship between the US Dollar and gold prices. As of May 2026, the USD trend is UP, which directly contributes to the short-term downward pressure on both gold prices and gold equities.
The mechanism operates through several channels simultaneously:
- A stronger dollar increases the effective purchase cost of gold for buyers holding other currencies, reducing marginal demand from major markets including Europe, Japan, India, and China
- Dollar strength typically signals reduced near-term inflation expectations in US markets, which can temporarily diminish gold's appeal as an inflation hedge
- Rising yields and dollar appreciation often attract capital into US fixed income assets, drawing investment flow away from non-yielding assets like gold
Current directional summary:
| Indicator | Direction | Implication for Gold |
|---|---|---|
| USD Trend | UP | Headwind for gold prices |
| Gold Price Trend (short-term) | DOWN | Correction within broader bull market |
| Gold Stocks Trend (short-term) | DOWN | Equity weakness mirrors physical metal |
| Gold Sector Cycle | UP | Medium-term structural support |
What could shift this dynamic? A Federal Reserve pivot toward rate cuts would likely weaken the dollar, providing immediate relief for gold prices. Equally, a deterioration in US fiscal metrics, whether through debt ceiling stress, deficit expansion, or sovereign credit concerns, has historically applied structural pressure on the dollar's long-term purchasing power. The longer-term de-dollarisation trend, reflected in persistent central bank accumulation from sovereign institutions across Asia, the Middle East, and Eastern Europe, represents a structural demand floor that USD short-term strength cannot fully override.
Macro Catalysts: Geopolitics, Central Banks, and Structural Demand
The May 2026 gold market is being shaped by a combination of short-cycle geopolitical events and multi-decade structural demand shifts. Understanding the distinction between these two forces is essential for positioning decisions.
Short-cycle catalyst: A US-Iran ceasefire signal, including indications of paused strikes targeting energy infrastructure, triggered a Friday rebound in gold prices during the reporting week. Safe-haven demand surged during the escalation phase and partially retreated when the ceasefire was announced. This pattern illustrates how geopolitical events generate volatility around an underlying price trend rather than setting that trend independently.
Structural demand drivers sustaining the long-term bull thesis:
- Central bank accumulation remains a foundational pillar. Sovereign wealth managers continue rotating reserve assets from USD-denominated securities into physical gold holdings, a trend that accelerated following the 2022 freezing of Russian foreign exchange reserves and has shown no signs of meaningful deceleration
- Inflation persistence continues to support gold's monetary hedge function. Despite central bank tightening cycles across major economies, structural inflation driven by deglobalisation, energy transition costs, and labour market shifts keeps inflation above pre-2020 baselines in most developed economies
- Currency debasement concerns arising from expanding fiscal deficits in the US, EU, and Japan sustain demand for hard assets with no counterparty liability
- Silver co-movement provides confirming evidence. Silver trading above $80 per ounce at an eight-week high suggests industrial demand is contributing alongside monetary demand, reinforcing the broader precious metals complex rather than gold acting in isolation. In addition, the gold-silver ratio remains a valuable tool for assessing relative value between the two metals
The next major ASX story will hit our subscribers first
Gold Price Forecasts: What the Models Project
Forward-looking price models provide useful reference points, though all forecasts carry inherent uncertainty and should not be treated as guarantees of future performance.
| Timeframe | Projected Price (USD/oz) | Basis |
|---|---|---|
| Near-term (current quarter) | ~$4,677 | Trading Economics macro model |
| 12-month forward | ~$5,022 | Trading Economics macro model |
| 2026 all-time high recorded | $5,608.35 | Market pricing data |
From current levels near $4,714, reaching the 12-month model target of $5,022 would represent approximately +6.5% appreciation. Re-testing the all-time high of $5,608 would require a +19% move, a target that falls within historical precedent for gold bull market extensions but one that requires sustained macro support rather than occurring on technical momentum alone. The broader gold price forecast from leading analysts supports this medium-term outlook.
What Could Accelerate the Next Advance?
Scenarios that could accelerate the next advance:
- A Federal Reserve rate cut cycle, which typically weakens the USD and reduces the opportunity cost of holding gold
- Renewed escalation in Middle Eastern or Eastern European conflict zones, driving safe-haven capital allocation
- Acceleration of central bank gold purchases beyond current pacing
- A US dollar structural decline driven by fiscal deterioration or credit rating pressure
What Could Extend the Consolidation Phase?
Scenarios that could extend the consolidation phase:
- Prolonged USD strength driven by sustained hawkish Federal Reserve policy
- Durable geopolitical de-escalation removing the safe-haven premium from current prices
- An equity market rally drawing risk appetite and capital away from defensive asset classes
- A deflationary macro shock that compresses commodity prices broadly, reducing gold's inflation hedge premium
Positioning Strategy: Matching Signal Type to Investment Horizon
The most persistent error among gold market participants is applying a trader's decision framework to a long-term investment strategy, or conversely, treating short-term sell signals as fundamental reversal indicators when they reflect nothing more than near-term momentum exhaustion.
The signal type must match the position horizon. A short-term sell signal on GLD is not a signal to abandon a multi-year gold allocation. A cycle upturn is not a signal to enter a two-week trade.
For long-term investors:
- The confirmed cycle upturn supports continued accumulation during this consolidation phase
- Dollar-cost averaging during short-term sell signal periods reduces average entry cost relative to peak levels
- Core holdings are best expressed through physical gold, established gold ETFs such as GLD, or senior producer equities for those seeking leverage to the gold price. However, understanding gold as a safe-haven investment remains fundamental to this long-term thesis
For active traders:
- Current sell signals across GLD, GDX, XGD.TO, and GDXJ argue against initiating new long positions until signal reversal is confirmed
- The USD trend remains a critical confirming filter: new gold long positions carry higher risk while the dollar trend remains upward
- Patience until signals align is the technically sound approach. Tracking live gold prices through the Perth Mint can assist with real-time decision-making
For risk-conscious participants:
- The divergence between a bullish macro cycle and bearish short-term trend warrants reduced position sizing or partial cash positioning until confirmatory signals emerge
- Stop-loss placement is especially important during high-volatility, mixed-signal environments where temporary whipsaws can trigger outsized drawdowns before the structural trend reasserts
Key Takeaways: Gold Market Summary, May 9, 2026
This gold price update concludes with the following key readings across all major indicators:
- Gold spot price: $4,700 to $4,744/oz representing +41.58% year-over-year performance
- Gold sector cycle indicator: UP, favouring medium-term accumulation
- Short-term technical signals across GLD, GDX, XGD.TO, and GDXJ: Sell, warranting near-term caution
- USD trend: UP, creating headwinds for gold in the immediate term
- 12-month price model target: ~$5,022/oz (Trading Economics)
- Primary macro driver: Geopolitical dynamics including US-Iran ceasefire signals and persistent safe-haven demand
- Silver confirmation: Above $80/oz at eight-week highs, supporting broader precious metals complex strength
Disclaimer: This article is for informational purposes only and does not constitute financial advice. All forecasts, price projections, and technical signals referenced carry inherent uncertainty and should not be relied upon as guarantees of future performance. Precious metals markets involve significant risk of loss. Independent financial advice should be sought before making any investment decisions.
Want to Identify the Next Major ASX Mineral Discovery Before the Broader Market?
While gold's macro cycle signals a constructive medium-term environment, Discovery Alert's proprietary Discovery IQ model scans daily ASX announcements in real time, instantly converting complex mineral data across 30+ commodities into actionable insights for both short-term traders and long-term investors — explore historic discoveries and their remarkable returns, then begin your 14-day free trial to position yourself ahead of the market.