July 10, 2026
Understanding Gold's Dual Nature: Safe Haven Asset or Speculative Vehicle?
Few assets in modern finance generate as much debate as gold. For centuries, it has served simultaneously as a store of value, a medium of exchange, and a speculative instrument. Yet the mechanics that govern its short-term behaviour are often poorly understood, even among experienced investors. This gold price update reveals that when a market records nearly 42% gains over twelve months while simultaneously flashing corrective signals on technical dashboards, something more complex than simple supply and demand is at work. Understanding that complexity is what separates informed positioning from reactive speculation.
When big ASX news breaks, our subscribers know first
What the Gold Price Is Doing Right Now
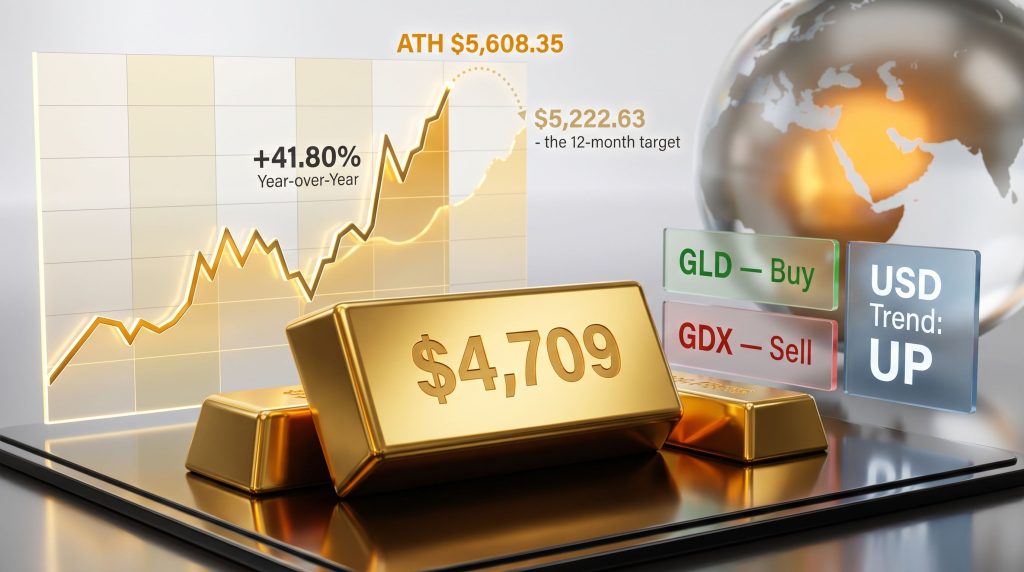
As of April 25, 2026, gold is trading in a range of approximately $4,709 to $4,719 per troy ounce USD, depending on the exchange and time of day sampled. The variation across that intraday window reflects the continuous nature of global gold markets, which operate across overlapping Asian, European, and North American sessions from Sunday evening through Friday morning (EST).
The table below captures the price across common denominations relevant to different types of buyers:
| Denomination | Approximate Price (USD) |
|---|---|
| Per Troy Ounce (Spot) | $4,709.00 to $4,719.55 |
| Per Gram | $151.40 to $151.42 |
| Per Kilogram | $151,394 to $151,422 |
| 1 oz Bullion Bar (Ask) | $4,811.00 |
The difference between the spot price and the bullion bar ask price reflects what the industry calls a dealer premium, which typically ranges from 2% to 8% above spot depending on product type, dealer, and prevailing demand conditions. Coins generally attract higher premiums than cast bars, and smaller denominations carry proportionally larger markups than larger bars.
For those wishing to track movements in real time, live gold price data provides continuous spot pricing across global sessions and is a useful reference point for monitoring intraday fluctuations.
It is worth noting that gold is quoted globally in USD per troy ounce, with one troy ounce equal to precisely 31.1035 grams, a standard set by the London Bullion Market Association (LBMA) and maintained across global commodity exchanges.
Gold Price Performance Across Multiple Time Horizons
Looking at gold across different windows tells a nuanced story about where the market has come from and where the corrective forces currently pulling on it originate.
| Time Frame | Performance |
|---|---|
| Daily (April 24, 2026) | +0.20% to +0.24% |
| Weekly | -2.50% (High: $155,392/kg to Low: $149,782/kg) |
| Monthly | +3.95% to +3.98% |
| Yearly | +41.80% to +41.85% |
| All-Time High (January 2026) | $5,608.35/oz |
The yearly figure is striking. A gain of approximately 42% year-over-year places gold among the strongest performing asset classes of the period, comfortably outpacing most equity indices and traditional inflation hedges. For broader context, the World Gold Council's research consistently identifies four macro conditions that historically propel gold outperformance: elevated inflation expectations, geopolitical uncertainty, currency debasement, and compressed real interest rates. All four conditions have been present in varying degrees across this period.
Why Is Gold Pulling Back Despite a Structural Bull Market?
The 2.5% weekly decline can be unsettling for investors who entered at higher prices, but technical corrections within strong uptrends are entirely normal. Gold's annualised historical volatility typically sits between 10% and 15%, meaning weekly moves of this magnitude are statistically within the expected range.
Several factors are contributing to the near-term softness:
- The market reached an all-time high of $5,608.35 in January 2026, and natural mean-reversion dynamics are at work following that extreme
- Traders are repositioning ahead of the U.S. Federal Reserve's April 28-29 policy meeting, which introduces rate-path uncertainty
- A strengthening U.S. Dollar Index (DXY) is applying mechanical downward pressure on gold, since a stronger USD makes the metal more expensive for buyers operating in other currencies
- Short-term profit-taking is compressing prices after a sustained run
Historically, corrections of 5% to 15% within gold bull markets have frequently resolved as accumulation phases rather than trend reversals. The January 2026 all-time high and the current corrective phase are structurally consistent with that historical pattern. Furthermore, gold as a safe haven continues to attract long-term institutional interest even during these corrective episodes.
Technical Signal Breakdown: What the Charts Are Saying
One of the more interesting features of the current gold price update is the divergence between physical gold instruments and gold mining equity vehicles. Technical analysis of the major gold-related instruments as of April 25, 2026 reveals a split picture that demands careful interpretation.
| Instrument | Asset Type | Short-Term Signal |
|---|---|---|
| GLD (SPDR Gold Trust) | Physical gold ETF | Buy |
| GDXJ (Junior Gold Miners ETF) | Junior mining equities | Buy |
| GDX (Gold Miners ETF) | Large/mid-cap mining equities | Sell |
| XGD.TO (TSX Gold Index) | Canadian gold equities | Sell |
The broader trend indicators add additional context:
| Trend Indicator | Current Direction |
|---|---|
| Gold Price Trend (Medium-Term) | Down |
| Gold Stocks Trend (Medium-Term) | Down |
| USD Trend (Medium-Term) | Up |
| Gold/USD Ratio | Sell Signal |
Why Do GLD and GDX Diverge?
This is a question many retail investors overlook, and understanding it provides a meaningful edge. GLD tracks the spot price of physical gold held in allocated vaults. Its performance is essentially a direct reflection of the gold price itself. GDX, by contrast, holds stakes in gold mining corporations, which are exposed to a far wider set of variables beyond the metal price. The gold stocks relationship to the underlying metal is therefore more nuanced than many assume:
- Operational costs: Mining companies face rising energy, labour, and equipment costs that can compress margins even when gold prices hold firm. The World Gold Council has noted that global gold mining all-in sustaining costs (AISC) have risen materially over recent years, reflecting inflationary pressures across the mining sector.
- Currency exposure: Most gold mines operate outside the United States. A stronger USD can reduce the revenue realised by miners when their domestic currency earnings are converted back to USD-denominated reporting.
- Capital intensity: Mining companies require continuous reinvestment in exploration, development, and infrastructure. Rising interest rates increase the cost of capital for these activities, weighing on valuations.
- Equity market correlation: During risk-off periods, mining stocks often behave more like equities than commodities, selling off alongside broader markets even when gold itself holds value.
The divergence between GLD (buy signal) and GDX (sell signal) is therefore not a contradiction. It reflects the additional operational and financial headwinds that mining equities face relative to the underlying metal, particularly when the USD is strengthening and broader equity sentiment is cautious.
Understanding the Proprietary Cycle Indicator
The gold sector cycle indicator is currently classified as DOWN, indicating the market remains in an active corrective phase. Cycle-based analysis is grounded in established technical frameworks, including Elliott Wave theory, which proposes that markets move through predictable expansion and contraction phases. Cycle indicators function as timing tools rather than directional forecasting models: they attempt to identify when a market is positioned for a move, not why that move will occur.
The practical application differs meaningfully between investor types and trader types:
For long-term investors:
- Cycle downturns represent opportunities to accumulate positions at lower average cost bases
- The goal is to build exposure ahead of the next cycle upswing, holding through near-term volatility
For short-term traders:
- Cycle bottoms serve as entry signals and cycle peaks as exit points
- Position sizing and stop placements are calibrated to the expected duration and magnitude of the cycle move
An important caveat applies: during periods of elevated geopolitical volatility, short-term whipsaws can occur, temporarily invalidating signals before the underlying trend reasserts. This risk is explicitly elevated in the current environment.
Macro Forces Shaping the Gold Price in Late April 2026
No technical analysis exists in a vacuum. The macro backdrop is what gives the technical signals their weight. Several converging forces are simultaneously supporting gold's long-term structural case while creating near-term friction.
The primary macro drivers currently at work include:
- Iran-Related Military Conflict (now entering its third month): Extended armed conflict in the Middle East has embedded a persistent geopolitical risk premium into gold pricing. Historical data shows that gold typically appreciates 3% to 15% in the early weeks of a major geopolitical escalation, with sustained conflict prolonging elevated safe-haven demand.
- Strait of Hormuz Disruption: Interference with one of the world's most critical energy shipping corridors sustains elevated oil prices, which feeds directly into broader inflation expectations and reinforces the case for hard asset ownership.
- Stagflation Risk: The combination of slowing economic growth signals alongside persistent inflation creates a macro environment that has historically been among the most favourable for gold. Stagflation erodes the real value of bonds and cash while making equity earnings less reliable, pushing capital toward real assets.
- Absence of Diplomatic Resolution: Stalled ceasefire negotiations keep uncertainty elevated, preventing any sustained risk-on rotation that would typically see capital move away from safe havens.
- Federal Reserve Policy Uncertainty: The upcoming April 28-29 FOMC meeting is the single most immediate market-moving catalyst for gold in the near term.
The Gold-Dollar Relationship: A Critical Mechanism
The inverse relationship between gold and the U.S. Dollar is one of the most consistent dynamics in commodity markets. When the DXY strengthens, gold faces a mechanical headwind: it becomes more expensive in non-USD terms, reducing demand from international buyers. The current medium-term uptrend in the USD is a significant factor in gold's ongoing corrective phase.
However, the Fed meeting introduces a pivot risk. If the April 28-29 statement signals a pause or reduction in the pace of monetary tightening, USD strength could reverse quickly. That reversal would remove one of the primary headwinds facing gold and could catalyse a renewed upward move toward the quarter-end price target. In addition, central bank gold demand remains a structural tailwind that continues to underpin prices across both corrective and expansionary phases.
Price Targets and Scenario Analysis for Gold in 2026
| Forecast Horizon | Price Target |
|---|---|
| Quarter-End Target | $4,875.47 |
| 12-Month Forward Estimate | $5,222.63 |
| All-Time High (January 2026) | $5,608.35 |
Three plausible scenarios frame the range of outcomes from here:
Scenario 1: Bullish Continuation (Base Case)
The Fed adopts a neutral-to-dovish tone at its April meeting, USD strength fades, geopolitical tensions persist without escalation, and gold tracks toward the $4,875 quarter-end target before building toward $5,222 over the subsequent twelve months.
Scenario 2: Prolonged Correction (Bear Case)
The Fed maintains a hawkish posture, reinforcing USD strength. Diplomatic progress in the Middle East reduces the geopolitical risk premium. Gold tests support below $4,500 before finding a floor, delaying the path back toward prior highs.
Scenario 3: Event-Driven Spike
A sudden escalation in the Iran conflict or a significant Strait of Hormuz disruption triggers an acute safe-haven surge. Gold moves rapidly back toward the January 2026 all-time high of $5,608. Traders positioned on the wrong side of the current cycle indicator face meaningful whipsaw risk.
The next major ASX story will hit our subscribers first
Strategic Framework: How Different Investors Should Approach This Market
The divergence between physical gold signals and mining equity signals means a uniform strategy is unlikely to serve all market participants equally. The appropriate approach depends on investment horizon, risk tolerance, and the vehicle used.
| Investor Profile | Recommended Positioning |
|---|---|
| Long-Term Gold Investor | Use the current corrective phase to accumulate physical gold or GLD exposure; hold through cycle volatility with a 12-month horizon |
| Short-Term Trader | Monitor GLD and GDXJ buy signals with disciplined stop placements; cycle uncertainty warrants reduced position sizes |
| Gold Mining Equity Investor | Exercise caution; GDX and XGD.TO remain on sell signals and the broader gold stock trend is down |
| Macro Hedge Seeker | Maintain structural gold allocation; stagflation and geopolitical risks remain elevated and are unlikely to resolve quickly |
A key insight that often escapes retail participants is the distinction between speculating on gold and hedging with gold. These require different position sizes, time horizons, and exit strategies. Cycle indicators are primarily tools for speculators. Long-term investors building a macro hedge may find the current corrective phase more valuable as an accumulation window than as a timing signal. For those wishing to explore this further, gold price forecasts offer additional analytical context across varying macro scenarios.
Frequently Asked Questions: Gold Price Update
What is the current gold price per ounce?
Gold is trading at approximately $4,709 to $4,719 per troy ounce USD as of April 25, 2026. Prices vary by exchange, time of day, and whether spot or dealer ask prices are referenced. The LBMA and COMEX markets remain the primary global benchmarks for pricing across all denominations.
Why did gold reach an all-time high in January 2026?
The January 2026 peak of $5,608.35 reflected a confluence of elevated geopolitical risk, persistent inflation concerns, compressed real interest rates, and sustained central bank accumulation globally.
Is gold in a bull or bear market right now?
Gold remains in a long-term structural bull market, with approximately 42% gains year-over-year. However, it is currently experiencing a medium-term corrective phase, with the gold sector cycle classified as down and the USD trend classified as up.
What is the practical difference between GLD and GDX signals?
GLD tracks physical gold and is on a short-term buy signal. GDX tracks gold mining companies and is on a short-term sell signal. The divergence reflects the additional operational, currency, and equity market headwinds facing mining companies relative to the metal itself.
What are the 12-month gold price forecasts?
Current estimates place gold at approximately $4,875 by quarter-end and $5,222.63 within twelve months, contingent on geopolitical risks remaining elevated and monetary policy moving in a more accommodative direction. For a broader perspective, gold price forecasts from leading commodity analysts offer useful comparative benchmarks across multiple modelling approaches.
How does the Federal Reserve affect gold?
Fed decisions influence both the USD and real interest rates, both of which share an inverse relationship with gold. A dovish April 28-29 outcome could weaken the USD and support a gold recovery; a hawkish outcome could extend the current correction.
Risk Disclosure: All technical signals, cycle models, and price forecasts discussed in this article are probabilistic analytical tools and do not constitute financial advice or guaranteed outcomes. Geopolitically driven markets can produce outcomes that deviate significantly from historical patterns. Readers should conduct independent research and apply appropriate risk management before making investment decisions. Past performance of gold or any related instrument is not indicative of future results.
Want to Know When the Next Major Gold Discovery Hits the ASX?
Discovery Alert's proprietary Discovery IQ model scans ASX announcements in real time, instantly identifying significant mineral discoveries across gold and 30+ other commodities — turning complex data into actionable opportunities for both short-term traders and long-term investors. Explore historic discoveries and the substantial returns they generated, then begin your 14-day free trial to position yourself ahead of the broader market.