July 28, 2026
The Geopolitical-Monetary Feedback Loop Shaping Gold Markets in 2026
Commodity markets have always functioned as real-time barometers of geopolitical stress, but the relationship between conflict and precious metals pricing is rarely as straightforward as headlines suggest. Gold does not simply rise when wars break out or fall when ceasefires are announced. The metal moves through a more intricate chain of cause and effect, one that runs through energy markets, inflation expectations, and ultimately the interest rate decisions of the world's most powerful central bank. Understanding this chain is what separates tactical traders from those who misread short-term price signals entirely.
The gold price rises on pause in US-Iran fighting seen in late July 2026 offers a textbook illustration of this dynamic. However, to understand what the price move actually means, and whether it represents a genuine shift in gold's trajectory or merely a technical relief rally, investors need to look well beyond the ceasefire headlines. For broader context, the gold price forecast for this period had already flagged the complex interplay between geopolitical risk and monetary policy as a defining theme.
When big ASX news breaks, our subscribers know first
How the Transmission Mechanism Works: From Ceasefire to Gold Markets
The pathway from a pause in Middle East hostilities to a rising gold price involves several sequential steps that are not immediately obvious to casual market observers.
When fighting between the US and Iran temporarily ceases, the first-order effect is a reduction in perceived oil supply risk. The Strait of Hormuz, the narrow waterway between Iran and Oman, handles a disproportionately large share of global seaborne oil exports. Any credible threat to shipping through this corridor embeds an immediate risk premium into energy prices worldwide. When that threat recedes, even temporarily, oil prices typically fall sharply.
That is precisely what occurred following the third consecutive night of restraint between Washington and Tehran, during which Iranian and Omani officials met to discuss potential frameworks for resolving the Hormuz shipping dispute. Brent crude fell as much as 9.5% in a single session, one of the sharpest energy price declines recorded in recent months. For a detailed breakdown of how energy markets intersect with commodities, the crude oil price analysis for 2025 provides valuable foundational context.
The downstream effects of that oil price fall then cascade through financial markets in the following sequence:
- Lower oil prices reduce near-term inflation expectations, since energy costs are embedded across virtually every sector of the global economy including transportation, manufacturing, and food production.
- Softening inflation expectations reduce the urgency for the Federal Reserve to maintain or extend restrictive monetary policy.
- When rate-hike probability diminishes, the relative opportunity cost of holding non-yielding assets like gold falls correspondingly.
- Reduced opportunity cost makes bullion more attractive compared to yield-bearing instruments, driving buying pressure into gold.
"The relationship between Middle East conflict and gold is not linear. It runs through oil prices, then inflation expectations, then Federal Reserve policy expectations, and only then into gold demand. Investors who skip steps in this chain frequently misinterpret price signals."
Where Gold Stands Right Now: Price Levels and Market Context
The following table captures the commodity market snapshot as of early US trading on July 27, 2026, the session following the pause announcement:
| Asset | Price | Session Move |
|---|---|---|
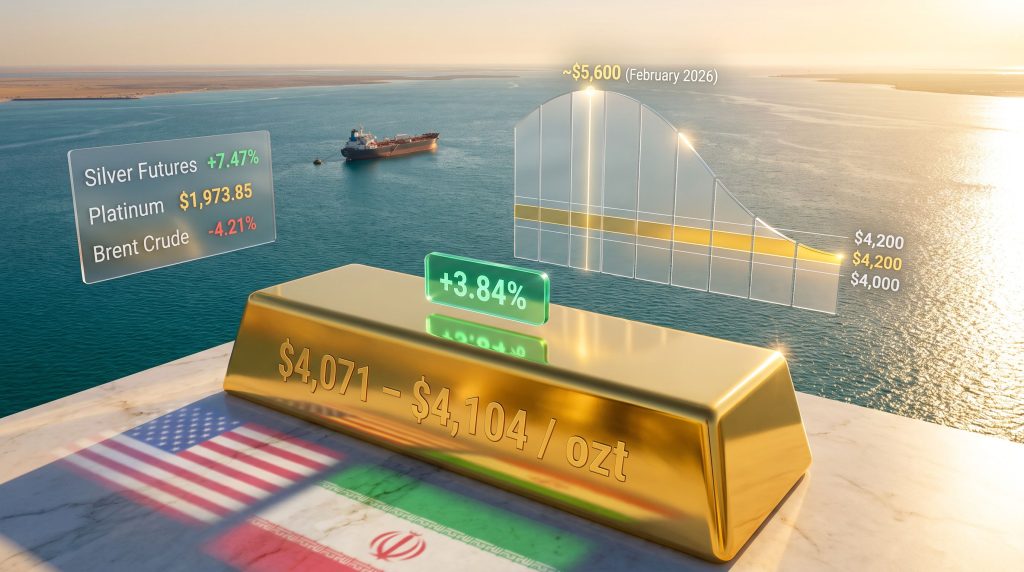
| Spot Gold | $4,071.16 / ozt | +0.5% |
| Gold Futures | $4,713.30 / ozt | +3.84% |
| Micro Gold Futures | $4,713.10 / ozt | +3.80% |
| Silver Spot | $58.42 / ozt | +0.4% |
| Silver Futures | $75.495 / ozt | +7.47% |
| Micro Silver Futures | $75.48 / ozt | +7.54% |
| Platinum | $1,973.85 / ozt | +4.22% |
| Palladium | $1,496.50 / ozt | +5.39% |
| Copper | $5.6358 / lb | +2.72% |
| Brent Crude Oil | $104.40 / bbl | -4.21% |
| WTI Crude Oil | $101.85 / bbl | -3.06% |
| Natural Gas | $2.89 / Btu | +0.10% |
| Aluminum Futures | $3,314.25 / ton | -1.21% |
Spot gold advanced 0.5% to $4,071.16 per ounce by late morning in New York, having earlier touched above $4,100 for an intraday gain of as much as 1.6% before paring those gains. The Bloomberg Dollar Spot Index remained broadly unchanged during the session, a detail that matters significantly. When gold rises during a period of dollar stability, it confirms that the buying pressure originated from genuine demand shifts rather than simple currency debasement effects.
The $4,000 Psychological Floor and What It Reveals About Investor Behaviour
Gold has traded in a relatively compressed corridor between approximately $4,000 and $4,200 per ounce since late June 2026. The consistency of dip-buying activity at the lower end of this range has reinforced $4,000 as a critical psychological support threshold, a level where institutional buyers have repeatedly stepped in to prevent sustained breakdowns.
This pattern of support behaviour is itself informative. It suggests that a significant cohort of market participants holds a strong structural conviction that gold's fair value lies above this level, even while rate-hike concerns suppress enthusiasm for a sustained rally. The compression of the trading range reflects a genuine equilibrium between two opposing forces rather than investor indecision.
Furthermore, it is worth noting that at current levels, gold remains more than 20% below its all-time record of approximately $5,600 per ounce, a peak reached in February 2026 before the commencement of US and Israeli military strikes on Iran triggered the current correction.
Gold's 2026 Price Arc: From Record Highs to a Conflict-Driven Correction
To properly contextualise where gold trades today, it is necessary to understand the multi-year bull run that preceded the current correction. Gold's ascent to $5,600 per ounce in February 2026 was underpinned by a combination of structural forces:
- Monetary easing cycles in major economies that suppressed real interest rates and reduced the opportunity cost of holding bullion.
- De-dollarisation trends driven by central bank reserve diversification, with central banks influencing gold prices particularly prominent among emerging market economies seeking to reduce exposure to US dollar-denominated assets.
- Persistent geopolitical uncertainty, including tensions across multiple theatres that elevated safe-haven demand.
- Structural supply constraints in gold mining, where declining ore grades at mature deposits and rising capital costs have made it increasingly difficult to grow global production meaningfully.
The paradox of the February 2026 reversal is that the very event most observers assumed would send gold higher, the outbreak of open conflict between the US and Iran, instead triggered a sharp correction. The mechanism was counterintuitive but logical in retrospect: conflict-driven energy price surges reignited inflation, which forced markets to reprice Federal Reserve policy expectations toward more aggressive tightening. Higher rate expectations then overwhelmed safe-haven demand and pushed gold lower despite the elevated geopolitical risk environment.
This dynamic illustrates a subtle but critical point about gold investing that is frequently misunderstood. Gold does not automatically benefit from geopolitical conflict. It benefits specifically from conflict that reduces rate expectations, typically by threatening economic growth rather than driving inflation. When conflict drives inflation instead, gold faces headwinds even as global uncertainty rises. Understanding gold as a safe haven requires appreciating precisely this nuance.
The Federal Reserve Dimension: Why Rate Policy Dominates Gold's Direction
Gold's primary structural headwind in 2026 has been the Federal Reserve's policy posture, itself shaped largely by conflict-driven energy price volatility. The upcoming rate decision, widely flagged by Fed watchers as particularly contentious, encapsulates the tension at the heart of gold's current trading range.
The dilemma facing policymakers is stark. On one hand, June's consumer price index reading came in softer than anticipated, suggesting that underlying inflation pressures may be moderating. On the other hand, the sustained elevation of energy costs driven by Middle East conflict has kept headline inflation stubbornly elevated. These two data streams are pulling in opposite directions, making the Fed's calculus genuinely uncertain and preventing markets from establishing a clear directional conviction on gold.
"Gold's sensitivity to rate expectations is structural rather than temporary. As a non-yielding asset, every basis point increase in real interest rates raises the relative attractiveness of yield-bearing alternatives. This structural sensitivity means gold cannot sustain a meaningful rally until rate expectations shift decisively in favour of easing or at minimum a prolonged pause."
Consequently, a sustained decline in Brent crude below $100 per barrel would materially alter this calculus, softening the energy component of inflation and giving the Fed greater room to signal a more patient approach to further tightening.
What Would Push Gold Above $4,200?
According to Justin Lin, an analyst at Global X ETFs, the market requires a meaningful resolution between the US and Iran, not merely a tactical ceasefire pause, before gold can be sustainably bid beyond the current $4,000 to $4,200 range. Lin has highlighted that yields and inflation expectations will remain elevated for as long as the conflict continues, which he identifies as the primary constraint on gold's upside at present.
Analysts broadly converge on three conditions necessary for a durable breakout above the current trading range:
- A formal diplomatic resolution between Washington and Tehran that removes the sustained Hormuz shipping risk premium from energy markets entirely.
- A multi-month decline in energy prices that materially reduces both headline inflation and the Federal Reserve's perceived need for further tightening.
- An explicit Fed pivot or pause in its tightening cycle that structurally lowers the opportunity cost of holding non-yielding assets.
The following scenario framework illustrates the range of potential outcomes depending on how the conflict evolves:
| Scenario | Conflict Outcome | Expected Gold Range | Primary Driver |
|---|---|---|---|
| Base Case | Pause extends without formal resolution | $4,000 to $4,200 | Range-bound with dip-buying support |
| Bull Case | Formal US-Iran diplomatic agreement | $4,400 to $4,800+ | Rate expectations ease materially |
| Bear Case | Conflict re-escalates significantly | $3,700 to $3,900 | Fed forced toward aggressive tightening |
| Tail Risk | Hormuz shipping fully disrupted | Extreme volatility | Oil shock triggers stagflationary dynamics |
The next major ASX story will hit our subscribers first
Silver, Platinum, and Palladium: Why the Broader Complex Is Moving
One of the most instructive aspects of the July 27 session was the behaviour of the broader precious metals complex. While gold's spot price advanced a relatively modest 0.5%, other metals recorded significantly larger percentage gains, a divergence that reveals important differences in underlying demand structures.
Silver exhibited the most striking contrast. Spot silver gained 0.4% to $58.42 per ounce, but silver futures surged as much as 7.47% to $75.495 per ounce, with Micro Silver Futures recording a 7.54% advance. This futures-spot divergence reflects a combination of short-covering pressure and speculative positioning rather than purely physical demand shifts.
The reason silver frequently outperforms gold on a percentage basis during geopolitical de-escalation is tied to its dual identity as both a monetary metal and an industrial commodity. Approximately 50 to 60% of annual silver demand is industrial in nature, spanning applications in solar photovoltaics, electronics, medical devices, and electric vehicle components. When conflict risks ease, improving economic activity expectations simultaneously boost industrial demand forecasts and reduce safe-haven selling pressure, creating a double tailwind that gold does not share to the same degree.
Platinum advanced 4.22% to $1,973.85 per ounce, benefiting from easing supply concern narratives alongside improved industrial sentiment. Palladium posted the strongest intraday gain in the complex at 5.39%, reaching $1,496.50 per ounce, reflecting both short-covering activity and the metal's acute sensitivity to automotive sector demand expectations.
In addition, the gold-silver ratio analysis deserves particular attention at current levels, as extreme readings in this ratio have historically preceded significant mean-reversion moves, making it a useful tactical tool for identifying relative value opportunities within the complex.
The Aluminium Indicator: How War Premiums Evaporate
Beyond the precious metals space, the aluminium market provides a striking illustration of how quickly conflict-driven risk premiums can unwind once geopolitical tension eases. After surging to a four-year high of $3,787.50 per tonne in early June 2026 on the back of Gulf disruption fears, London Metal Exchange three-month aluminium contracts had retreated to approximately $3,170 per tonne as war premiums dissipated, a decline of more than 16% from peak levels.
This aluminium trajectory serves as a useful reference point for gold investors. It demonstrates that conflict-driven premiums embedded in commodity prices can unwind much faster than they accumulate, particularly once diplomatic progress becomes credible. However, gold has a more complex relationship with conflict resolution because its demand is shaped by monetary policy expectations as well as pure risk sentiment, which means its price response to de-escalation will always be more nuanced than in purely industrial metals.
Copper at $5.6358 per pound, up 2.72%, tells a different story again, reflecting improved risk appetite alongside continued uncertainty about global demand trajectories, particularly from China.
Frequently Asked Questions
Why did gold rise when the US-Iran fighting paused?
A pause in hostilities reduced the perceived risk of oil supply disruption through the Strait of Hormuz. Lower oil prices softened inflation expectations, which reduced the probability of aggressive Federal Reserve rate increases. Since gold generates no yield, reduced rate expectations lower the opportunity cost of holding bullion, making it more attractive to investors.
What is the current support level traders watch most closely for gold?
The $4,000 per ounce level has functioned as a critical psychological and technical support threshold since late June 2026, with consistent institutional dip-buying preventing sustained moves below this floor.
How far has gold fallen from its record high?
Gold reached approximately $5,600 per ounce in February 2026. At current spot levels near $4,071, the metal is trading more than 20% below that record high. The gold price rises on pause in US-Iran fighting have provided some relief, though the metal remains well below peak valuations.
What conditions would push gold sustainably above $4,200?
Analysts broadly identify three requirements: a formal diplomatic resolution to the US-Iran conflict, a sustained multi-month decline in energy prices that materially eases inflation, and a clear signal from the Federal Reserve that its tightening cycle is pausing or reversing.
Why does silver sometimes move more sharply than gold during geopolitical shifts?
Silver's larger industrial demand component means it benefits from both easing monetary policy expectations and improving economic activity forecasts simultaneously. This dual sensitivity can produce larger percentage moves than gold during periods of de-escalation, particularly when futures markets are heavily positioned and subject to short-covering pressure.
Key Takeaways for Investors Watching Gold in 2026
- The gold price rises on pause in US-Iran fighting reflect a genuine tug-of-war between structural safe-haven demand and rate-hike headwinds driven by conflict-induced energy inflation. Neither force is currently dominant, which is why the trading range remains compressed.
- The $4,000 to $4,200 range is not a temporary anomaly. It represents a rational equilibrium given current monetary policy uncertainty and the absence of a formal diplomatic resolution.
- A tactical ceasefire pause, however welcome, is insufficient to trigger a structural re-rating of gold's fair value. Markets have been conditioned by repeated cycles of pause and re-escalation since February 2026.
- Silver, platinum, and palladium are all responding positively to de-escalation signals, with silver exhibiting the most pronounced futures-driven percentage gains due to its industrial demand sensitivity.
- The Federal Reserve's upcoming rate decision is the most immediate domestic catalyst for gold. With energy costs and underlying CPI data pointing in opposite directions, the outcome remains genuinely uncertain and the gold market knows it.
- The aluminium market's rapid unwinding of its Gulf disruption premium offers a cautionary precedent: conflict-driven commodity premiums can reverse sharply, and gold investors should be careful not to confuse a tactical bounce with a structural turning point.
Disclaimer: This article is for informational purposes only and does not constitute financial advice. Commodity price forecasts and scenario analyses involve inherent uncertainty. Readers should conduct their own independent research before making investment decisions. Past price performance is not indicative of future results.
Want To Stay Ahead of the Next Major Commodity Market Move?
Discovery Alert's proprietary Discovery IQ model delivers real-time alerts on significant ASX mineral discoveries, transforming complex market data into actionable insights for investors navigating volatile commodity environments like the one shaping gold markets in 2026 — explore historic discovery returns on Discovery Alert's discoveries page to see what early positioning can mean, then begin your 14-day free trial to secure a genuine market-leading edge.