August 4, 2026
The Hidden Mechanism Behind Gold's Sensitivity to U.S. Labor Data
Most commodity markets respond directly to supply and demand fundamentals. Gold operates differently. Its price formation is shaped less by physical scarcity in any given month and more by the invisible architecture of monetary policy expectations. Understanding this distinction is the starting point for making sense of why gold prices and U.S. jobs data have become so deeply intertwined in 2026.
The relationship is not intuitive at first glance. Gold does not pay a dividend, does not generate earnings, and does not benefit directly from economic growth. What it does respond to, with remarkable consistency, is the opportunity cost of holding it relative to yield-bearing assets. When interest rates rise, bonds and cash become comparatively more attractive. When rates fall or are expected to fall, gold's lack of yield becomes irrelevant, and its store-of-value appeal reasserts itself. Every major U.S. labor market release feeds directly into this dynamic, influencing gold and bond dynamics in ways that reverberate across global markets.
When big ASX news breaks, our subscribers know first
From Payrolls to Precious Metals: The Transmission Chain
The pathway from a monthly jobs report to a movement in gold prices runs through several interconnected steps, and each link in the chain matters.
- Jobs data is released and compared against consensus market expectations.
- Federal Reserve rate expectations shift based on whether the labor market appears tight or loosening.
- The U.S. dollar strengthens or weakens in response to revised rate expectations.
- Treasury yields adjust, particularly real yields (nominal yield minus inflation expectations).
- Gold reprices in response to changes in real yields and dollar strength.
The critical distinction here is between real and nominal yield sensitivity. Gold responds most powerfully to movements in real yields, which represent the actual return investors receive after accounting for inflation. When real yields rise sharply, the cost of holding non-yielding gold increases relative to inflation-protected government bonds.
This is why inflationary environments can present a paradox for gold investors: rising inflation theoretically supports gold as a store of value, but if central banks respond aggressively with rate hikes, the resulting surge in real yields can simultaneously undermine gold's appeal.
What Gold at $4,059 per Ounce Signals About Market Psychology
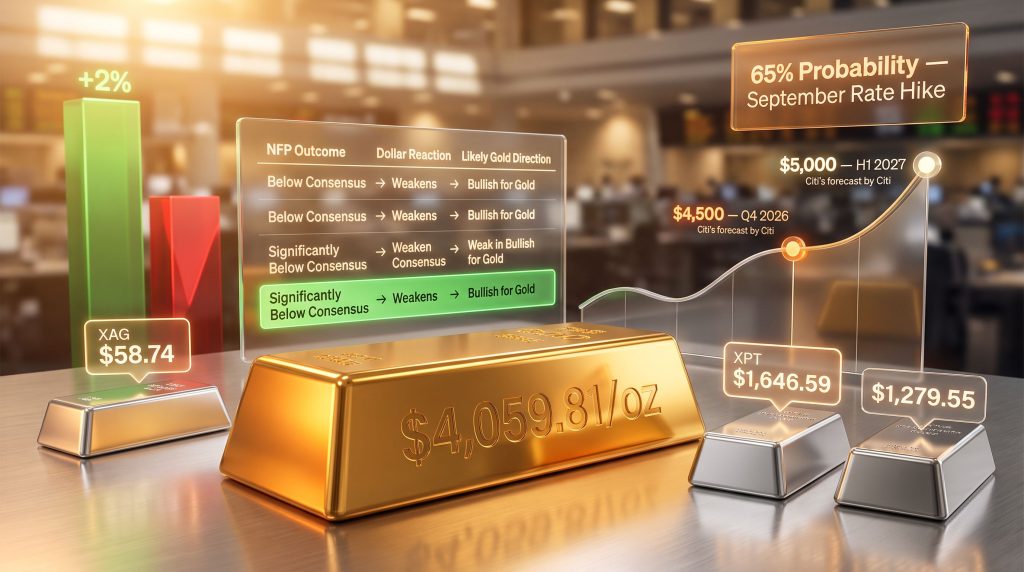
As of early August 2026, spot gold was trading at approximately $4,059.81 per ounce, representing a modest gain of 0.2% on the day. To the casual observer, this might look like stability. To experienced market participants, it reads as something more deliberate: a consolidation phase.
In commodity market terminology, a consolidation phase refers to a period of range-bound trading characterised by reduced directional volatility. It typically reflects a market that has absorbed recent information but is waiting for a new catalyst before committing to a meaningful trend. These periods often precede significant directional moves, and the quality of the breakout (up or down) tends to be determined by the nature of the catalyst that ends the consolidation.
In a consolidation environment, gold is not dormant. It is accumulating directional pressure. The resolution of that pressure depends on whether incoming data confirms or challenges the prevailing rate expectations that have built up over weeks or months.
The broader precious metals complex was showing interesting divergences during this same period. Furthermore, while gold gained modestly, its industrial counterparts were outperforming:
| Metal | Price (Early Aug 2026) | Daily Movement |
|---|---|---|
| Gold (XAU) | $4,059.81/oz | +0.2% |
| Silver (XAG) | $58.74/oz | +1.0% |
| Platinum (XPT) | $1,646.59/oz | +1.2% |
| Palladium | $1,279.55/oz | +1.2% |
Silver, platinum, and palladium each carry significant industrial demand components. Their outperformance relative to gold on a given day often signals that market participants are becoming more confident about economic activity rather than retreating into pure safe-haven positioning. This subtle divergence can serve as a useful cross-signal when assessing whether gold's behaviour is driven by monetary policy concerns or broader risk-off sentiment.
Historical Evidence: How Jobs Reports Have Moved Gold Prices
The historical record provides a compelling case study in asymmetric market reactions. The May 2026 nonfarm payrolls report delivered 172,000 jobs against a consensus expectation of roughly 85,000, an outperformance of nearly 100%. The result was a sharp decline in gold, as traders rapidly priced in a higher-for-longer interest rate scenario and scaled back Fed easing expectations.
The June 2026 report told the opposite story. Actual payrolls came in at just 57,000 against an expectation of 110,000, a miss of approximately 53,000 jobs. Gold rallied by more than 2% in response as traders unwound bets on Fed tightening and re-entered positions anticipating eventual monetary easing. Indeed, understanding recession and gold prices helps contextualise why such weak labour readings produce such powerful rallies.
| Jobs Report | Actual Payrolls | Market Expectation | Gold Reaction |
|---|---|---|---|
| May 2026 | 172,000 | ~85,000 | Sharp decline, higher-for-longer rates priced in |
| June 2026 | 57,000 | 110,000 | Rally exceeding +2%, tightening bets reduced |
What this data reveals is that the magnitude of deviation from consensus matters far more than the absolute payroll number itself. A headline figure of 57,000 jobs in isolation might suggest economic fragility. However, it was the 53,000-job shortfall relative to expectations that generated the trading response.
This is a critically important nuance: gold prices and U.S. jobs data interact probabilistically rather than mechanically. Gold traders are not reacting to economic conditions in the abstract. They are reacting to how new information changes the probability distribution of future Fed decisions.
The gold-to-jobs relationship is probabilistic, not mechanical. The same payroll number can be bullish or bearish for gold depending entirely on what markets had already priced in before the data was released.
The Three-Stage Labor Market Calendar Shaping Gold This Week
The week of early August 2026 presented traders with a sequential escalation of labor market data, each release carrying its own informational weight and market-moving potential.
Stage 1: JOLTS Job Openings (Tuesday)
The Job Openings and Labor Turnover Survey measures unfilled positions across the U.S. economy, providing a demand-side view of the labor market from the employer's perspective. Elevated job openings signal that businesses are still actively seeking workers, which typically implies wage pressure and, by extension, inflationary persistence. For gold, this translates to a potential headwind if openings remain high enough to keep the Fed in a hawkish posture.
Stage 2: ADP Employment Report (Wednesday)
The ADP report covers private-sector payrolls and is released approximately two days before the official government data. It functions primarily as a directional signal rather than a precise predictor. Historical divergences between ADP figures and the official nonfarm payrolls number have been substantial, which is why sophisticated traders treat ADP as one data point among many rather than a reliable forecast.
Its importance rises during periods, like the current one, when the Fed is actively debating the pace of rate adjustments.
Stage 3: Nonfarm Payrolls (Friday)
The nonfarm payrolls report, published on the first Friday of each month by the U.S. Bureau of Labor Statistics, is the definitive benchmark for U.S. labor market health. Beyond the headline job creation number, gold traders monitor two critical sub-components:
- Average hourly earnings: A proxy for wage-driven inflationary pressure. Strong wage growth complicates the Fed's task and creates mixed signals for gold.
- Labor force participation rate: Indicates whether the pool of available workers is expanding or contracting, which affects the structural tightness of the labor market over time.
Geopolitical Risk as a Parallel Gold Price Driver
While monetary policy expectations dominate the analytical framework for gold pricing, geopolitical uncertainty operates as a separate and sometimes overriding force. In early August 2026, the U.S.-Iran situation was generating conflicting signals: statements from U.S. officials suggesting diplomatic engagement were being contradicted by Iranian denials of any ongoing negotiations.
This kind of sustained ambiguity is precisely the environment in which gold safe-haven appeal reasserts itself independently of interest rate dynamics. The ongoing conflict had been driving up energy costs, feeding into broader inflationary pressures across the global economy.
This creates what might be called the gold inflation paradox:
Geopolitical instability drives energy prices higher, which stokes inflation. Inflation, in theory, supports gold as a store of value. But persistent inflation compels central banks to raise interest rates, which increases the opportunity cost of holding gold. The net directional outcome depends on which force proves dominant in any given market window.
Federal Reserve Bank of New York President John Williams, during this period, indicated cautious optimism that inflation pressures were gradually easing while making clear the central bank retained a willingness to respond decisively with additional rate hikes if price stability remained elusive. This kind of conditional guidance sharpens the market's sensitivity to each incoming data point, particularly labor market figures that carry direct implications for the inflation trajectory.
The next major ASX story will hit our subscribers first
Institutional Forecasts and the September Rate Decision
Traders as of early August 2026 were pricing in a 65% probability of a September rate increase, following a divided Fed policy meeting that left the benchmark rate unchanged. That 65% figure is not static. It will shift with every new piece of labor market evidence received this week, and its direction will have direct consequences for gold. Consequently, following updated gold price forecasts from institutional research teams has become increasingly important for investors seeking to navigate this environment.
Citi's research team published a structured outlook for gold that captures the range of near-term and medium-term scenarios:
| Timeframe | Citi Gold Price Projection |
|---|---|
| Next 1 Month | Stagnation or moderate decline |
| Q4 2026 | Rally toward $4,500/oz |
| H1 2027 | Potential advance toward $5,000/oz |
For the longer-term targets to materialise, several conditions would need to align simultaneously:
- A meaningful weakening of the U.S. dollar on a sustained basis
- A Fed pivot away from rate hikes toward rate cuts or extended pauses
- Continued geopolitical instability sustaining the safe-haven bid
- Ongoing central bank gold demand at rates elevated relative to historical norms
Central bank demand is a dimension of the gold market that receives less retail investor attention than it deserves. Over recent years, emerging market central banks in particular have been diversifying reserves away from U.S. dollar assets, and gold has been a primary beneficiary. This structural demand creates a price floor that operates independently of short-term rate expectations.
A Decision Framework for Positioning Around NFP Releases
For investors seeking to navigate gold's sensitivity to labor market data, a structured scenario framework is more useful than directional speculation:
| NFP Outcome | Dollar Reaction | Fed Rate Expectation | Likely Gold Direction |
|---|---|---|---|
| Significantly above consensus | Strengthens | Rate hike more probable | Bearish pressure on gold |
| Broadly in line with consensus | Neutral | Expectations unchanged | Consolidation continues |
| Significantly below consensus | Weakens | Hike probability falls | Bullish impulse for gold |
The U.S. Dollar Index (DXY) serves as the transmission belt in this mechanism. Research suggests that historically, a 1% appreciation in the DXY has corresponded to approximately a 1 to 1.5% decline in spot gold prices. This relationship tends to hold under normal market conditions but can break down during periods of acute geopolitical stress, when safe-haven demand for gold overrides the currency-driven pricing mechanism entirely.
Frequently Asked Questions: Gold Prices and U.S. Jobs Data
Does strong jobs data always push gold lower?
Not necessarily. When rate hike expectations are already fully reflected in market pricing, even a significant payrolls beat may produce only a muted response in gold. The marginal impact of new information depends heavily on how much of that information was already anticipated.
Why does gold respond to employment data at all?
The connection is indirect but powerful. Gold carries no yield, so its attractiveness relative to interest-bearing assets shifts with the rate environment. Jobs data shapes rate expectations, which alter the relative appeal of gold versus bonds and cash. The link operates through the Federal Reserve's policy response function rather than through any direct relationship between employment levels and gold demand.
What sub-components of the NFP report matter most?
Beyond the headline payroll creation figure, average hourly earnings and the labor force participation rate carry significant analytical weight. Persistent wage growth signals embedded inflationary pressure that complicates the Fed's path and creates genuinely mixed signals for gold bulls and bears alike.
How reliable is the ADP report as a predictor of NFP?
Directionally useful but not reliably precise. ADP covers private-sector employment only, while NFP includes government workers. Historical divergences between the two figures have been large enough that traders use ADP as one input among many rather than a definitive forecast for the official BLS release.
What price level would confirm the institutional bull case for gold?
A sustained close above $4,500 per ounce would validate the near-term institutional case. The $5,000 per ounce level represents a longer-horizon structural target that requires a genuine shift in the Fed's rate trajectory, most likely involving a pivot toward easing that has not yet materialised as of early August 2026.
Key Takeaways: Navigating the Gold and Labor Data Intersection
- Gold prices and U.S. jobs data remain tightly linked, with gold consolidating near $4,059 per ounce ahead of potentially decisive labor market releases.
- The 65% September rate hike probability is the pivotal variable. This week's jobs releases will move that number, and gold will respond accordingly.
- Historical precedent confirms the asymmetric nature of gold's response: the June miss of 53,000 jobs relative to expectations generated a 2%+ rally, whilst May's 87,000-job beat drove a sharp decline.
- Geopolitical uncertainty from the Middle East sustains an independent safe-haven bid that can partially cushion gold against rate-driven headwinds.
- Citi's institutional forecast projects a path toward $4,500 by Q4 2026 and $5,000 in H1 2027, contingent on a meaningful evolution in Fed policy and sustained dollar softness.
Disclaimer: This article is intended for informational purposes only and does not constitute financial advice. All price forecasts and probability estimates referenced are based on market data available as of early August 2026 and are subject to change. Past correlations between economic data releases and gold prices do not guarantee future outcomes. Readers should conduct independent research and consult a qualified financial adviser before making investment decisions.
Want to Capitalise on the Next Major Mineral Discovery Before the Broader Market?
Discovery Alert's proprietary Discovery IQ model delivers real-time alerts on significant ASX mineral discoveries, turning complex market data into actionable investment insights for both short-term traders and long-term investors — explore the historic returns major discoveries have generated and begin your 14-day free trial today to secure a market-leading edge.