
May 22, 2026
The Productivity Paradox at the Heart of Monetary History
For most of recorded history, storing wealth meant holding metal. There was no alternative. Grain rotted, land could be seized, and livestock died. Gold and silver were the only instruments capable of preserving value across time, geography, and political upheaval. That structural reality shaped the monetary world for thousands of years, and understanding it is the foundation of any serious analysis of gold purchasing power history.
What changed was not gold. What changed was everything around it.
When big ASX news breaks, our subscribers know first
Why the Roman Toga Comparison Tells Only Half the Story
The Labour Cost Hidden in Ancient Clothing
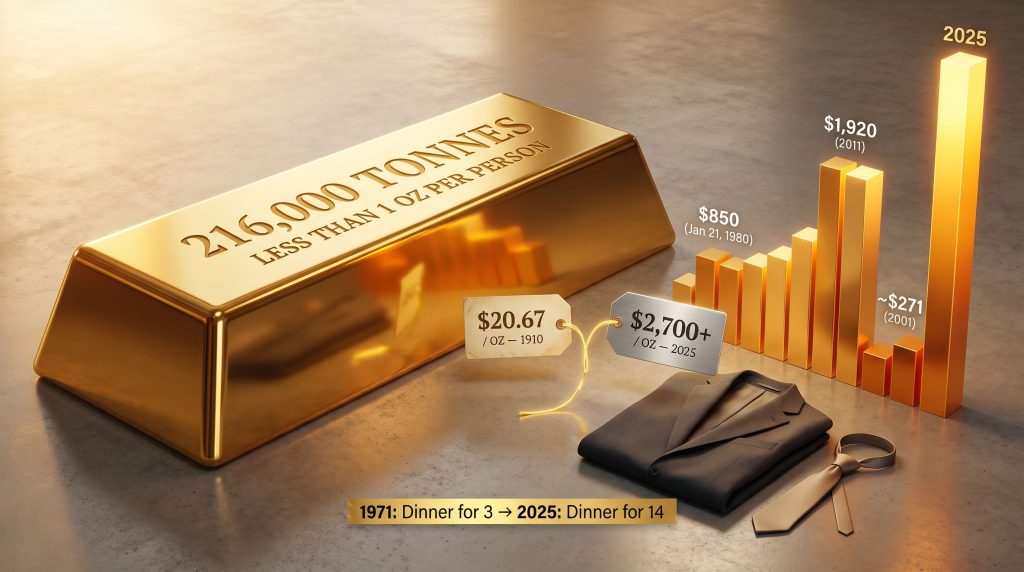
The widely repeated claim that one ounce of gold purchased a Roman toga, sandals, and belt, and that the same ounce still covers a modern suit and shoes today, contains a kernel of truth wrapped in a significant analytical error. The comparison treats purchasing power as static when the production reality behind those garments is almost incomparably different.
A Roman toga required weeks of skilled human labour. Wool had to be shorn by hand, cleaned, combed, and spun into thread using manual distaffs and spindles. That spinning process alone could consume weeks of a single worker's time per garment. Dyeing required pigments that were themselves extracted through labour-intensive processes. Weaving was performed on hand looms, and skilled craftspeople handled every cut and finish by hand.
Modern clothing production involves almost none of that human time. Industrial looms produce miles of fabric per hour. Computer-guided cutting systems slice through dozens of layers simultaneously. Assembly lines reduce individual garment labour to minutes rather than weeks.
The practical implication is that the Roman outfit represented a vastly greater quantity of human labour than its modern equivalent. When measured in labour-time equivalence rather than nominal price, gold's purchasing power should theoretically be far higher today than it was in antiquity. The fact that it is not demands a structural explanation.
What Purchasing Power Actually Measures for a Hard Asset
Before examining the historical record, it is worth establishing a precise definition. For a commodity-based monetary asset like gold, purchasing power is not simply the nominal price in any given currency. It is the ratio between the value of the metal and the cost of a representative basket of goods and services after adjusting for inflation. Furthermore, gold as ultimate money has always functioned differently from paper alternatives precisely because it cannot be printed or debased at will.
Comparing a gold price from 1920 directly to one from 2025 without inflation adjustment produces a meaningless figure. The more useful lens is the real CPI-adjusted gold price, which strips away the noise of currency debasement and isolates whether gold is actually buying more or less in the real economy over time.
Gold Purchasing Power Through the Major Monetary Eras
The Gold Standard Period: Stability as an Illusion
Britain's Royal Mint fixed gold at approximately £3 17s 10½d per troy ounce in 1717, a rate maintained for over two centuries. In the United States, the official price held at $20.67 per troy ounce from the late 18th century until 1933. On the surface, this looks like extraordinary stability. In practice, it masked significant volatility in real purchasing power.
When prices across the broader economy fluctuated, gold's fixed nominal price meant its real purchasing power moved in the opposite direction. Inflation compressed it; deflation expanded it. During the deflationary collapse of the Great Depression, gold's fixed price effectively increased what it could buy as consumer prices fell sharply. Then in 1933, the revaluation to $35 per troy ounce transferred purchasing power dramatically from fiat holders to those holding the metal, effectively devaluing the dollar by approximately 70% against gold in a single policy decision.
Under the Bretton Woods system that followed from 1944 to 1971, gold remained locked at $35 per ounce while inflation progressively eroded what that price could command. By 1970, the same $35 that had once purchased a quality outfit barely covered a pair of shoes. Gold and bond dynamics during this era illustrate how fixed monetary anchors interact with inflationary pressure across extended economic cycles.
1971 to 2001: The Volatility Era
When President Nixon ended dollar-gold convertibility in August 1971, gold entered a free-float market for the first time in the modern era. The consequences were immediate and dramatic.
Driven by double-digit inflation, two oil shocks, and collapsing confidence in fiat monetary management, gold surged from $35 per ounce to an intraday peak of $850 on January 21, 1980, a nominal increase of approximately 2,329% in under a decade (Federal Reserve History). This was not a reflection of any change in gold's physical properties. It was a repricing event triggered by a loss of trust in paper alternatives.
The cycle then reversed. As the Federal Reserve under Paul Volcker raised interest rates aggressively to break inflation, capital rotated back toward financial assets. By 2001, gold averaged approximately $271 per troy ounce, compressing its real purchasing power back toward multi-decade lows. These mean reversion cycles are a recurring feature of gold pricing across monetary transitions, not exceptions to a stable rule.
The Modern Repricing Cycle (2001 to Present)
Gold's sustained recovery from approximately $271 per ounce in 2001 through the 2011 peak near $1,920 per ounce, and subsequent advances to multi-thousand dollar levels, represents the longest sustained repricing in the post-gold-standard era. Its role as a safe-haven investment has become increasingly recognised during this period, particularly during episodes of heightened financial stress.
A concrete illustration of this shift comes from a real-world benchmark. In 1971, one ounce of gold was sufficient to cover dinner for approximately three people at London's Savoy Grill, with the bill running around £11.33. By January 2025, that same single ounce covered dinner for approximately 14 people at the same establishment, with a comparable bill running near £472.65.
Over that same period, the purchasing power of the pound sterling had declined dramatically in conventional goods, yet gold had expanded its real command over premium goods and services considerably. The contrast with fiat currency holders over the same period is stark. Dollars held in 1971 lost the overwhelming majority of their purchasing power in the decades that followed.
Gold Purchasing Power Across Key Historical Benchmarks
| Time Period | Approximate Gold Price (USD/oz) | Real-World Benchmark | Key Driver |
|---|---|---|---|
| Pre-1913 (US) | ~$20.67 | Full quality outfit including suit, shoes, belt | Gold standard; no competing financial assets |
| 1934 (Post-Revaluation) | $35.00 | Quality suit; fiat holders lost ~70% vs. gold | FDR revaluation; Bretton Woods precursor |
| 1970 (Bretton Woods end) | $35.00 | Budget shoes only | 30+ years of inflation on a fixed price |
| January 21, 1980 (Intraday Peak) | $850 | Full suit and more | Inflation crisis; collapse of fiat confidence |
| 2001 (Cycle low) | ~$271 | Budget suit; cheap shoes | Post-Cold War financial asset boom |
| 1971 vs. 2025 (Savoy Grill) | $35 to ~$2,700+ | Dinner for 3 vs. dinner for 14 | Fiat debasement; gold's real purchasing power expansion |
Sources: Federal Reserve History; World Gold Council
The Supply Constraint That Never Changes
One Ounce Per Person: Why Scarcity Is Structural
Annual gold mining adds approximately 1.5 to 2% to total above-ground supply each year, a rate that has closely tracked global population growth for centuries (World Gold Council). The World Gold Council estimates that approximately 216,000 tonnes of gold have been extracted across all of recorded human history, a volume sufficient to fill roughly three and a half Olympic swimming pools.
Distributed across a global population of approximately 8 billion people, that equates to less than one troy ounce per person. This per-capita figure has remained broadly flat since antiquity. Scarcity is not a recent feature of gold, nor a cyclical one. It is structural and permanent.
The critical insight this creates is one that most casual discussions of gold overlook entirely. The amount of physical wealth per person has multiplied by orders of magnitude since pre-industrial times. Yet the amount of gold per person has barely moved. By simple arithmetic, gold should command vastly more purchasing power today than in ancient Rome. The fact that it does not points directly to a structural compression mechanism operating in the background.
The Compression Mechanism: How Paper Assets Absorbed Gold's Dividend
In pre-modern economies, metal was the only savings vehicle. All surplus wealth flowed into gold and silver by necessity because there was nowhere else for it to go. That single fact is the hidden key to understanding why the Roman toga comparison appears to hold despite the enormous productivity gains of the intervening centuries.
Today, that surplus flows into equities, government bonds, corporate debt, exchange-traded funds, money market instruments, and thousands of other liquid financial products. According to Allianz Research, global net household financial assets stood at approximately EUR 210 trillion (roughly USD 230 trillion) as of end-2024, a figure that had doubled over the prior decade.
Investment-grade physical gold, including bars, coins, and ETF-backed metal, represents a structurally small fraction of that total. Global personal wealth is estimated at approximately $471 trillion, with privately held gold accounting for roughly 6% of that figure.
Every efficiency gain in human productivity that should theoretically have increased gold's purchasing power has instead been absorbed by the proliferation of paper-based financial instruments. Gold's missing purchasing power has not disappeared. It has been redirected into the ocean of financial alternatives that did not exist before the modern era.
What Releases the Compression: Trust, Crises, and Repricing
The Single Condition That Holds the System Together
Financial instruments maintain their role as wealth storage vehicles on one foundational condition: institutional trust. That trust encompasses confidence in counterparties, regulatory frameworks, sovereign creditworthiness, and the broader stability of the monetary system.
When that trust holds, capital remains distributed across the full spectrum of financial assets. Gold's share of total stored wealth stays compressed because there are simply too many alternatives absorbing the surplus. When trust deteriorates, however, the dynamic reverses with considerable speed.
How Repricing Events Actually Work
The 2008 global financial crisis provides the clearest modern example. Securities carrying the highest possible credit ratings were revealed to carry substantially greater default risk than their ratings implied. Capital rotated rapidly toward assets with no counterparty exposure. Gold rose from approximately $730 per ounce in late 2008 to above $1,900 per ounce by 2011, an appreciation of approximately 160% from crisis lows.
The mechanism driving that move is important to understand precisely. It was not that gold became more physically valuable. It was that the paper alternatives competing with gold for stored wealth lost credibility. When that happens, gold supply cannot expand to meet the incoming demand, because annual production adds only 1.5 to 2% to total supply regardless of price signals. The price therefore absorbs the entire adjustment.
The same pattern has recurred across historical currency crises. Populations holding physical gold through episodes of rapid fiat currency devaluation preserved purchasing power relative to those holding paper instruments. Furthermore, the gold-silver ratio provides additional context here: historically ranging approximately 10 to 16:1 from 1497 to 1870, it had expanded to 88 to 100:1 by 2019, a signal of gold's strengthening relative position in the modern financial era.
The Structural Stress-Test Framework
If just 10% of the approximately USD 230 trillion in global net household financial assets were to seek refuge in physical gold and gold-backed instruments, the metal would need to reprice dramatically to absorb that demand. This is not a price forecast. It is a measure of the structural distance between gold's current market capitalisation and the role it could be called upon to fill under systemic stress. (Allianz Research; World Gold Council)
This framework distinguishes between two fundamentally different ways of holding gold. The first is as a portfolio hedge, treating the metal as insurance against tail risk that performs precisely when other assets struggle. The second is as a speculative position, representing a directional bet on near-term price appreciation. Most serious institutional frameworks treat gold as the former.
The next major ASX story will hit our subscribers first
USD Purchasing Power vs. Gold: A Century of Divergence
The Dollar Since 1913
The Federal Reserve was established in 1913. In the century-plus since, the US dollar has lost the substantial majority of its purchasing power in nominal terms. Gold, priced in dollars, has risen from $20.67 per ounce before 1933 to multi-thousand dollar levels. That rise reflects not gold appreciating in absolute terms so much as the dollar depreciating against a fixed-supply asset.
At the 1910 benchmark of $20.67 per ounce, one troy ounce of gold purchased approximately 122 pounds of steak, roughly 0.83 of a quality suit, or approximately 1/40th of a Model T Ford. Those real-world anchors illustrate how much the dollar's purchasing power has compressed in the intervening century. Central bank gold demand has, in addition, accelerated meaningfully in recent years as sovereign institutions seek alternatives to dollar-denominated reserves.
| Year | Gold Price (USD/oz) | USD Purchasing Power (1910 = 100) | Key Monetary Event |
|---|---|---|---|
| 1910 | $20.67 | 100 | Pre-Federal Reserve baseline |
| 1920 | ~$20.67 | ~50 | WWI inflation; dollar halved vs. 1910 |
| 1934 | $35.00 | ~45 | Gold revaluation under Roosevelt |
| 1971 | $35.00 | ~17 | Nixon ends gold convertibility |
| 1980 | ~$615 (avg) | ~9 | Post-stagflation peak cycle |
| 2001 | ~$271 | ~7 | Post-Cold War financial asset boom |
| 2011 | ~$1,571 (avg) | ~5 | Post-GFC monetary expansion |
| 2025 | ~$2,700+ | ~3 | Ongoing fiat debasement cycle |
Sources: Federal Reserve History; World Gold Council; BLS CPI data
The Long-Term Verdict
Over timeframes measured in centuries, gold purchasing power history demonstrates a capacity to preserve value that no fiat currency in recorded history has matched. Over shorter periods, including multi-decade stretches, gold's real price has experienced significant compression and expansion cycles. The 1980 to 2001 period, for example, saw gold's real purchasing power decline substantially before eventually recovering.
The practical implication is that gold functions most reliably as a long-duration store of value rather than a short-term inflation hedge. Investors who use it to manage precise near-term inflation exposure often find the relationship inconsistent. Those who hold it across monetary cycles tend to find the relationship considerably more durable.
Three Scenarios for Gold's Purchasing Power Trajectory
Understanding where gold's purchasing power may travel from its current level requires thinking through distinct scenarios rather than single-point forecasts. Each rests on a different assumption about the durability of institutional trust.
-
Scenario A: Continued Financial Asset Dominance — If institutional trust in financial systems remains broadly intact and real yields stay positive, gold's share of stored wealth remains compressed. Purchasing power grows modestly in line with cumulative inflation. This scenario requires that the systems supporting $230 trillion in paper wealth continue to function without a significant confidence shock.
-
Scenario B: Gradual Monetary Debasement — Continued central bank balance sheet expansion and persistently low or negative real interest rates erode fiat purchasing power progressively. Historical precedent comes from the 2001 to 2011 cycle, during which gold rose approximately 600% in nominal terms as real yields fell and monetary policy remained accommodative.
-
Scenario C: Systemic Financial Stress — A significant deterioration in confidence around financial counterparties or sovereign debt markets triggers rapid capital rotation into hard assets. Because gold supply cannot expand to meet that demand, price absorbs the full adjustment. Historical precedents include the 1971 to 1980 cycle (approximately 2,329% nominal rise) and the 2008 to 2011 cycle (approximately 160% rise from crisis lows).
Disclaimer: The above scenarios represent analytical frameworks for understanding structural dynamics, not investment forecasts. Past performance is not indicative of future results. Always consult a qualified financial adviser before making investment decisions.
Frequently Asked Questions: Gold Purchasing Power History
Has gold always maintained its purchasing power?
Over multi-century timeframes, gold has preserved purchasing power more consistently than any fiat currency in recorded history. Over shorter periods, including multi-decade stretches, gold's real price has experienced significant compression and expansion cycles. The 1980 to 2001 period saw gold's real purchasing power decline substantially before recovering in the cycle that followed.
Why does gold's purchasing power fluctuate if supply is so limited?
Supply scarcity is necessary but not sufficient for stable purchasing power. The other variable is demand competition. When financial assets are trusted and abundant, gold's share of stored wealth compresses. When that trust erodes, gold's purchasing power recovers rapidly because supply cannot expand to absorb incoming demand, so price adjusts instead.
How much gold exists per person in the world?
The World Gold Council estimates approximately 216,000 tonnes of gold have been mined throughout human history, enough to fill roughly three and a half Olympic swimming pools. Distributed across approximately 8 billion people, this equates to less than one troy ounce per person, a per-capita figure that has remained broadly stable for centuries. Scarcity is structural rather than cyclical.
Is gold a reliable inflation hedge?
Over long timeframes of 20 years or more, gold has demonstrated a meaningful relationship with cumulative inflation. Over shorter periods, that relationship is inconsistent. Gold is more accurately described as a monetary debasement hedge and a systemic risk hedge than a precise short-term inflation instrument.
What happens to gold's purchasing power in a financial crisis?
When confidence in financial counterparties deteriorates, capital tends to rotate toward assets with no counterparty risk. Because gold supply cannot expand quickly to absorb that demand, price adjusts upward rapidly. This dynamic has recurred across multiple historical stress events, from 1970s stagflation through the post-2008 repricing.
Why isn't gold worth more given how productive the modern economy is?
This is the most underappreciated question in precious metals analysis. Productivity has exploded since antiquity, but gold supply per person has barely changed. The reason gold purchasing power history does not show proportional gains is that surplus wealth generated by productivity has been absorbed by trillions of dollars worth of paper financial instruments that simply did not exist in earlier eras. Gold is not underperforming because it is weak. It is compressed because it is competing against an ocean of alternatives built on institutional trust.
Want to Track the Next Major Mineral Discovery Before the Broader Market Does?
Discovery Alert's proprietary Discovery IQ model delivers real-time alerts on significant ASX mineral discoveries, transforming complex data into actionable insights for investors at every experience level — explore the historic returns major discoveries have generated and begin your 14-day free trial today to secure a genuine market-leading edge.