August 23, 2026
The Architecture of a Gold Rally on Dollar Weakness
The global monetary system carries a design flaw that most investors only notice during periods of acute stress: every major commodity market is architected around a single reference currency, and when that currency loses credibility, the ripple effects are immediate, simultaneous, and frequently dramatic. Gold, as the oldest monetary asset in human history, sits at the exact intersection of this structural tension. Understanding why a gold rally on dollar weakness is not merely a coincidence but a mechanical inevitability requires tracing the full chain of causation from policy decisions through currency markets to precious metals pricing.
When big ASX news breaks, our subscribers know first
Why Gold and the Dollar Move in Opposite Directions
The Pricing Mechanism That Creates the Inverse Relationship
Gold is settled globally in U.S. dollars. This single architectural fact means that any depreciation in the dollar's purchasing power functions as an automatic price reduction for every buyer transacting in euros, yen, yuan, or Swiss francs. The mathematics are straightforward: if the dollar falls 5% against a basket of foreign currencies, gold becomes approximately 5% cheaper for international buyers without any change in the underlying dollar price. This affordability improvement stimulates demand across non-U.S. institutional buyers, central banks, and retail markets simultaneously.
What makes this relationship particularly potent is that dollar weakness rarely arrives in isolation. It almost always carries an accompanying signal: that confidence in U.S. monetary stewardship is deteriorating. This dual transmission mechanism means gold benefits twice from the same event — first through the mechanical price reduction in foreign currency terms, and second through the surge in safe-haven demand from investors questioning the long-term integrity of dollar-denominated assets. For a deeper perspective, the gold safe-haven role in times of monetary uncertainty is well-documented across market cycles.
"The inverse relationship between gold and the dollar is not merely a correlation observed in financial data. It reflects a core architectural feature of how commodities are priced and settled in global markets, reinforced by investor psychology during periods of monetary uncertainty."
How the U.S. Dollar Index Transmits Into Gold Markets
When the U.S. Dollar Index (DXY) declines meaningfully, the cost of gold in every major currency simultaneously falls, creating a coordinated demand impulse across multiple geographies. The amplification effect is strongest when dollar weakness coincides with rising geopolitical tensions or deteriorating fiscal credibility, both of which independently reinforce gold's role as a store of value outside the financial system.
Furthermore, this is why sustained periods of dollar weakness have historically produced multi-week gold rallies rather than single-session spikes. Each successive day of dollar softness generates fresh demand from new buyer categories, creating a compounding dynamic that technical momentum indicators eventually begin to reflect. According to JM Bullion's investing guide, this structural linkage between the USD and gold pricing is one of the most reliable relationships in commodity markets.
What Triggered the Dollar's Recent Weakness
Treasury Debt Restructuring and Its Currency Consequences
The immediate catalyst for the most recent bout of dollar weakness was a U.S. Treasury decision to repurchase longer-duration debt instruments in exchange for shorter-maturity obligations. This debt management strategy, announced mid-week at approximately 12:30 GMT, effectively rotates the government's borrowing profile toward the short end of the yield curve.
The mechanism connecting this decision to dollar weakness operates through interest rate differentials. Longer-duration U.S. Treasuries had been offering a yield premium that attracted sustained capital inflows from foreign institutional investors. By reducing the yield available on long-dated instruments, the Treasury compressed the very interest rate advantage that had been supporting dollar demand. As that yield premium diminishes, the incentive for global capital to park in dollar-denominated assets weakens, and the currency softens accordingly.
The market response was immediate. Gold surged as much as $159 points (+3.6%) within hours of the announcement, underscoring how directly and rapidly currency dynamics transmit into precious metals pricing. Consequently, the gold price forecast for the remainder of the year has been meaningfully revised upward by several institutional analysts.
The Yield Curve Normalisation Context
This debt restructuring decision does not occur in a vacuum. Over the past several years, the U.S. yield curve has transitioned from deeply inverted territory — where short-term rates exceeded long-term rates — back toward a positively sloped configuration. While this normalisation reduces refinancing costs for the Treasury over time, it simultaneously erodes the yield advantage that had previously anchored global demand for dollar assets.
The practical consequence for gold investors is significant. A yield curve that no longer offers exceptional returns on long-dated dollar instruments reduces the opportunity cost of holding gold, which yields nothing but carries no counterparty risk. As the yield differential compresses, gold's relative attractiveness as a capital preservation vehicle improves. The interplay between gold and bonds dynamics is particularly instructive here, as yield curve shifts directly influence relative asset allocation decisions.
Federal Reserve Policy Uncertainty as an Amplifier
Complicating the picture further is genuine ambiguity within the Federal Reserve's policy apparatus. Several officials have signalled openness to additional rate increases, while incoming economic data presents a mixed picture that supports neither clear hawkishness nor unambiguous dovishness. The upcoming Personal Consumption Expenditures (PCE) price index release for July carries particular significance, with consensus forecasts calling for modest gains of +0.1% headline and +0.2% core.
Markets have responded to this uncertainty by pricing a volatility premium into dollar-sensitive assets. Gold, as the primary beneficiary of dollar uncertainty, has absorbed much of this positioning.
Gold's Performance: The Numbers Behind the Rally
Weekly Performance Summary
The scale of gold's recent move is notable even against a year that has already produced multiple historic sessions.
| Metric | Data Point |
|---|---|
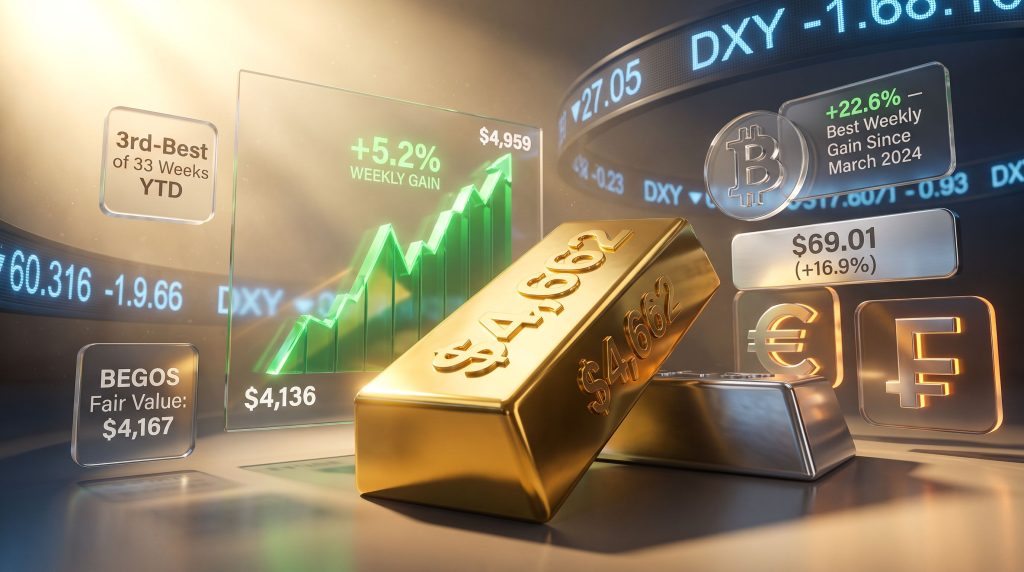
| Gold settlement price (Friday close) | $4,662 per ounce |
| Weekly point gain | +$230 points |
| Weekly percentage gain | +5.2% |
| Ranking among 2026 weekly performances | 3rd-best of 33 full trading weeks YTD |
| Intraday surge post-Treasury announcement | +$159 points (+3.6%) within hours |
| Gold's all-time intraday high (January 2026) | $5,586 per ounce |
| BEGOS model-derived fair value estimate | $4,167 per ounce |
The Valuation Gap Problem
One of the more nuanced observations from systematic market analysis involves the divergence between gold's current market price and its model-derived fundamental valuation. At $4,662 per ounce, gold trades at a significant premium to its BEGOS Market Value estimate of $4,167, representing a deviation that has reached one of its most extreme readings in recent months.
A comparable divergence previously appeared during the six consecutive trading days that preceded gold's all-time intraday high of $5,586 in late January 2026. The parallel does not confirm that a repeat performance is imminent, but it does establish that the current gold rally on dollar weakness has meaningfully outpaced fundamental valuation models.
"Elevated price-to-valuation spreads in gold markets do not predict reversals with precision, but they signal that the risk-reward profile for new long positions becomes progressively less favourable as the gap widens. Investors entering at current levels are buying momentum, not value."
Cross-Asset Performance: Everything That Moves When the Dollar Falls
The Broad-Based Non-Dollar Rally
Dollar weakness functions as a systemic force rather than an asset-specific catalyst. When the DXY records one of its worst weekly performances of the year, the benefits distribute across every non-dollar-denominated store of value and liquidity pool simultaneously.
| Asset | Performance During Dollar Decline |
|---|---|
| Gold | +5.2% (3rd-best weekly gain of 2026) |
| Silver | +16.9% gain from June 30 close of $59.05 to $69.01 |
| Bitcoin | Best weekly gain since March 2024 (+22.6%) |
| Euro | 5th-best weekly percentage gain of the year |
| Swiss Franc | 2nd-best weekly percentage gain of the year |
This coordinated appreciation across gold, silver, Bitcoin, the euro, and the Swiss franc reflects a broad-based rotation away from dollar-denominated assets. Historically, this pattern has characterised episodes of dollar debasement, where capital diversification accelerates simultaneously across multiple asset classes as investors seek exits from currency concentration risk. As reported by Investing.com, global uncertainty compounds the directional force of dollar weakness on precious metals.
Silver's Relative Underperformance and What It Signals
Despite posting a remarkable 16.9% gain from its June 30 close of $59.05 to reach $69.01, silver has not yet reclaimed its May 2026 price highs — a divergence from gold, which has already surpassed those levels. Silver's key volume-dominant support currently sits at $64.95, representing a critical technical floor for the near-term outlook.
This gold-silver divergence carries analytical significance. Furthermore, conducting a thorough gold-silver ratio analysis at this stage of the cycle reveals that silver historically plays catch-up to gold during later bull phases, amplifying the directional move due to its smaller market size and dual identity as both a monetary metal and an industrial commodity.
Technical Structure: What the Charts Are Communicating
The Parabolic Long Trend Framework
Gold's current weekly parabolic long trend was confirmed with a price base near $4,432. Drawing on historical analysis of the prior 10 comparable long trends dating back to August 2022, conservative projections point toward a potential cycle target of approximately $4,959. Crucially, the first week of this trend has already covered 44% of the projected distance to that target, a pace that significantly exceeds historical norms.
The average duration of comparable prior trends has been approximately 15 weeks, and they have not been uniformly upward. The previous long trend lasted 14 weeks and included five down-weeks within the broader uptrend. Investors who interpret individual down weeks as trend failure misread the historical pattern entirely.
Key Technical Support Levels
| Level | Significance |
|---|---|
| $4,547 | Primary volume-dominant support (10-day Market Profile) |
| $4,450 | Secondary volume-dominant support (10-day Market Profile) |
| $4,167 | BEGOS model-derived fair value estimate |
| $4,136 | Price at the July 2 technical buy signal (now +12.7% higher) |
The Momentum Signal That Preceded the Move
A momentum indicator crossing above its -80% threshold on July 2, 2026, at a gold price of $4,136 generated a confirmed buy signal for systematic traders. From that signal to the most recent settlement, gold has appreciated by approximately 12.7%. A comparable signal for silver triggered on June 30 at $59.05, with the metal subsequently advancing 16.9% to reach $69.01. These signal-to-return relationships underscore the value of systematic momentum frameworks when positioning within broader trend cycles.
The next major ASX story will hit our subscribers first
Equity Market Overvaluation and Gold's Portfolio Role
Why an Overvalued S&P 500 Strengthens the Case for Gold
Q2 2026 earnings season delivered a headline result that initially appears constructive: 79% of S&P 500 reporting companies exceeded their year-ago earnings, representing the second-best improvement rate across the past 12 reporting quarters. The surface reading suggests corporate health. The deeper reading reveals a more troubling picture.
The aggregate earnings level remains materially insufficient to justify current index valuations. The S&P 500's trailing twelve-month price-to-earnings ratio stands at approximately 43.1x, which is 70% above the 25.4x baseline recorded when that metric was first calculated in January 2013. At current dividend yield levels of approximately 1.09%, the equity risk premium relative to alternatives is historically compressed.
"A trailing P/E ratio of 43.1x represents an extreme valuation that, measured against long-term historical norms, implies structural vulnerability. At this level, the mathematical relationship between price and earnings suggests the potential for a correction exceeding 40% before index valuations return to historically supported territory."
Gold as the Structural Diversifier When 60/40 Fails
When equity valuations reach historically elevated levels, the traditional correlation between stocks and bonds as a hedging mechanism becomes unreliable. Bonds may fail to provide offsetting returns precisely when equity drawdowns are most severe, particularly in inflationary environments where both asset classes face headwinds simultaneously.
Gold's historically low or negative correlation with equities during market stress periods makes it a structurally attractive diversifier at exactly the moments when conventional portfolio construction faces its greatest pressure. In addition, central bank gold demand has been accelerating, adding a structural demand floor beneath speculative and investment flows. The combination of dollar weakness, elevated equity valuations, and monetary policy uncertainty creates a multi-factor environment that has historically produced sustained, not speculative, gold appreciation.
Macro Risks That Could Interrupt the Uptrend
Three Scenarios Worth Monitoring
Not every force in the current environment favours gold. Three risk factors deserve active monitoring:
-
PCE Inflation Surprise: If July's Personal Consumption Expenditures data comes in above the consensus forecasts of +0.1% headline and +0.2% core, markets may interpret the result as justification for Federal Reserve tightening. A hawkish pivot, particularly if signalled at the Jackson Hole gathering, would strengthen the dollar and create near-term pressure on gold prices.
-
Geopolitical Escalation and the Oil-Dollar Feedback Loop: Renewed tensions in the Middle East carry the potential to reignite oil demand, which historically strengthens the dollar through petrodollar flows. Rising oil prices tend to reinforce dollar demand as energy-importing nations require more dollars for settlement. This creates a paradox: geopolitical risk is typically gold-positive through safe-haven demand, but the accompanying dollar strength can partially offset that benefit, and in some scenarios, dominate it.
-
Technical Overextension: At $4,662 with a model value of $4,167, gold is trading at a meaningful premium to fundamentals. The speed with which 44% of the projected trend target has been covered in a single week introduces the possibility of sharp consolidation before the broader trend resumes.
Economic Indicators and What Incoming Data Means for Gold
Recent Barometer Readings
Of the 12 economic metrics released in the most recent reporting week, eight showed improvement on a period-over-period basis. Notable standouts included:
- July Building Permits exceeded consensus forecasts and surpassed the upwardly revised June figure, a positive leading indicator for near-term construction activity
- The Conference Board's Leading Economic Index registered a positive reading for only the fourth time in the past ten months, suggesting tentative stabilisation in forward-looking economic momentum
Upcoming Data With Direct Gold Market Relevance
| Data Release | Relevance to Gold |
|---|---|
| PCE Price Index (July) | Primary inflation gauge; above-consensus reading could pressure gold by shifting Fed rate expectations |
| Jackson Hole Fed Address | Rate guidance signals; hawkish tone would strengthen dollar and weaken gold |
| Conference Board LEI | Forward economic momentum; sustained improvement reduces safe-haven demand |
| Housing Starts (August) | Consumer health indicator; limited direct gold impact |
Frequently Asked Questions
Why does a gold rally on dollar weakness happen so consistently?
Gold's dollar-denominated pricing creates a mechanical channel through which any depreciation in the dollar immediately reduces gold's cost in foreign currency terms. This affordability improvement generates demand from non-U.S. buyers simultaneously across institutional, central bank, and retail categories. Layered on top of this mechanical effect is the signal that dollar weakness sends about U.S. monetary credibility, which independently reinforces gold's appeal as a store of value outside the financial system.
Can gold sustain upward momentum if the dollar stabilises?
Gold can maintain upward momentum through alternative drivers including geopolitical risk premiums, central bank purchasing programmes, negative real interest rates, inflation expectations, and deteriorating equity market confidence. The current environment features several of these supporting factors simultaneously, which reduces the dependency on continued dollar weakness as the sole driver.
How does Treasury debt restructuring affect gold prices?
When the Treasury rotates its borrowing toward shorter maturities, the yield available on longer-duration bonds falls. This compresses the interest rate premium that makes dollar-denominated assets attractive to global capital, weakening the dollar. The weakened dollar then transmits directly into gold demand through the currency pricing mechanism, reducing gold's cost in foreign currency terms and stimulating international buying.
What distinguishes silver's behaviour from gold during dollar weakness?
Silver amplifies gold's directional moves in both directions due to its smaller market size and dual role as both a monetary asset and an industrial commodity. During dollar weakness episodes, silver often outperforms gold on a percentage basis during the later stages of a rally. However, its higher volatility means it also carries greater downside exposure during corrections. The current divergence — where silver has not yet reclaimed May 2026 highs while gold already has — is consistent with historical patterns where silver's catch-up phase arrives later in the cycle.
Disclaimer: This article is for informational purposes only and does not constitute financial advice. All forecasts, technical projections, and valuation estimates involve inherent uncertainty and should not be interpreted as predictions of future price movements. Past performance of any asset or indicator pattern is not indicative of future results. Readers should conduct their own due diligence before making investment decisions.
Want to Capitalise on the Next Major Mineral Discovery Before the Broader Market Notices?
While gold's rally on dollar weakness highlights the power of macro-driven moves, the most significant wealth-creation opportunities in the resources sector have historically come from being positioned early in transformative mineral discoveries — and Discovery Alert's proprietary Discovery IQ model delivers real-time ASX discovery alerts straight to subscribers, turning complex geological announcements into actionable investment insights. Explore historic discoveries and their extraordinary returns to understand the scale of opportunity, then begin your 14-day free trial to ensure you're never the last to know when the next major find is announced.