
August 23, 2026
When Governments Blink: The Fiscal Signal Behind the Treasury Buyback Expansion
Throughout modern financial history, the moments that matter most for precious metals investors are rarely the ones that generate the loudest headlines. They are instead the quieter policy pivots, the technical adjustments buried in Treasury announcements, the incremental shifts in government behaviour that, when viewed through the right analytical lens, reveal something far more significant than their surface presentation suggests.
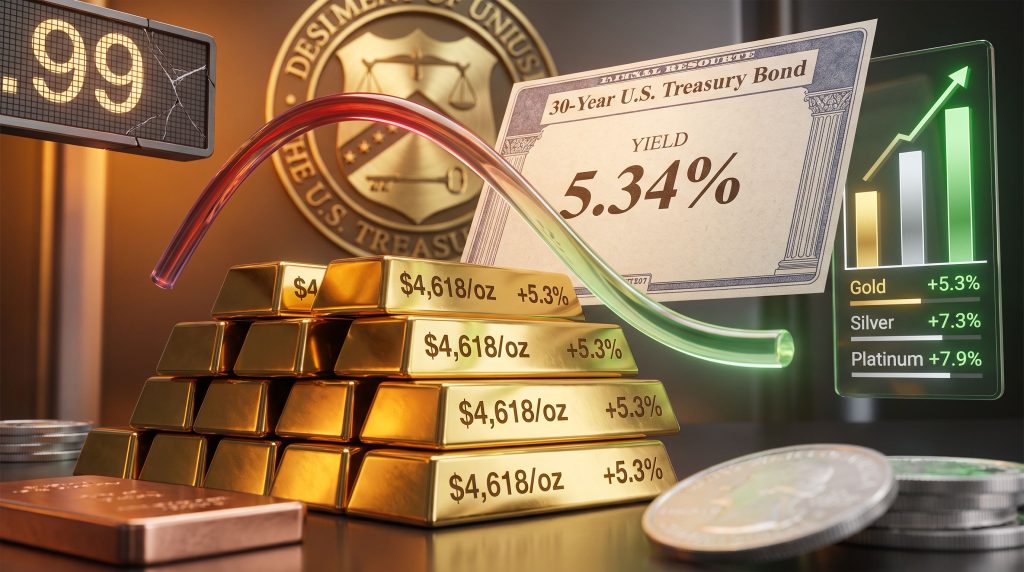
The U.S. Treasury's decision to double the maximum per-operation size of its liquidity support buyback program, from $2 billion to $4 billion in the 10-to-20-year and 20-to-30-year maturity ranges, is precisely this kind of moment. Scheduled to commence September 9, the expanded program arrived just as 30-year Treasury yields climbed to 5.34%, a level not observed since 2007. The timing was not coincidental. Understanding why it matters requires looking at the mechanics, the fiscal arithmetic, and the historical precedents that together explain why treasury buybacks and gold prices are now moving in lockstep.
When big ASX news breaks, our subscribers know first
Understanding the Liquidity Support Buyback Mechanism
What Treasury Buybacks Actually Do
The Treasury's buyback program operates by repurchasing previously issued government securities from the open market. Officially framed as a tool for improving secondary market liquidity, the program's practical effect is straightforward: when the Treasury becomes a larger buyer of specific bond maturities, it increases demand, which pushes bond prices higher and mechanically compresses yields.
This is structurally distinct from Federal Reserve quantitative easing in one important respect. The Fed creates new bank reserves to purchase assets, directly expanding the monetary base. The Treasury, by contrast, operates within existing fiscal constraints, drawing on cash balances or proceeds from other issuance. Yet both mechanisms share the same directional consequence: downward pressure on yields in the targeted maturity range.
The distinction that markets are grappling with is whether this expansion represents routine liquidity maintenance or a more deliberate effort to cap borrowing costs at the long end of the curve. Given that the announcement arrived within hours of 30-year yields reaching a 17-year high, the interpretation that bond markets settled on was unambiguous. Yields in the 20-to-30-year range retreated from 5.34% toward 5.2% almost immediately following the Treasury's announcement.
Why the Long End of the Curve Is the Critical Battleground
Long-duration bonds are uniquely sensitive to two variables: inflation expectations and fiscal sustainability concerns. A 30-year bond investor is effectively underwriting the credibility of U.S. fiscal policy across three decades. When that investor demands a yield of 5.34%, a level not seen since the pre-global financial crisis era, it is communicating something specific about perceived risk.
The maturity zones targeted by the buyback expansion, precisely the 10-to-30-year segment, are not where the government typically faces immediate rollover pressure. Short-dated bills and notes dominate near-term refinancing needs. The decision to intervene at the long end signals that Washington's discomfort with rising long-term rates is sufficiently acute to justify direct fiscal action in that specific part of the market.
Furthermore, understanding the broader gold-bond dynamics at play here is essential for placing this intervention in its proper historical context.
Key Insight: When a government with over $40 trillion in outstanding debt expands its intervention capacity at the long end of the yield curve at the moment yields reach a 17-year high, the message to hard asset investors is structural, not tactical.
The Step-by-Step Transmission From Buyback Announcement to Gold Rally
The mechanics of how expanded Treasury buybacks translate into precious metals price strength follow a clear sequence:
- The Treasury announces expanded buyback operations, doubling maximum per-operation size in the 10-to-30-year maturity range to $4 billion.
- Increased institutional demand for long-dated bonds pushes prices higher across the targeted maturities.
- Higher bond prices mechanically compress nominal yields, with the 30-year retreating from 5.34% toward 5.2% within hours.
- Falling nominal yields reduce the opportunity cost of holding non-yielding assets, most directly gold and silver.
- The Dollar Index weakens below 99, removing a key structural headwind for gold priced in U.S. dollars.
- Gold crosses back above $4,500 for the first time in roughly two months, with the rally subsequently accelerating toward $4,618 by week's end.
The speed of this transmission matters. Gold did not drift higher over several sessions as algorithmic models slowly repriced. It moved sharply within a compressed timeframe, suggesting that institutional investors were already positioned for exactly this type of fiscal policy pivot and required only the trigger to act. As reported by the AFR, gold bulls were broadly vindicated as prices roared back above $4,500.
The Yield-Gold Inverse Relationship: A Framework for Context
| Yield Environment | Impact on Gold | Historical Precedent |
|---|---|---|
| Rising real yields | Negative: bonds become relatively more attractive | 2022 gold correction during Fed tightening cycle |
| Falling nominal yields (policy-driven) | Positive: opportunity cost of gold declines | 2020 QE-era gold surge to then-record highs |
| Yield suppression amid elevated inflation | Strongly positive: negative real rates amplify gold appeal | 1970s stagflation period |
| Artificially capped long yields | Strongly positive: fiscal debasement narrative accelerates | Current environment |
The $40 Trillion Constraint: Fiscal Arithmetic That Cannot Be Ignored
Why Washington Cannot Tolerate Market-Clearing Rates
The U.S. national debt has surpassed $40 trillion. Annual federal interest expenditure has already crossed $1 trillion. These are not abstract statistics. They define the operating environment within which every interest rate decision, every bond issuance, and every policy intervention must now be evaluated.
The compounding dynamic is particularly unforgiving:
- Larger deficits require more bond issuance to fund federal spending
- More supply places upward pressure on yields as investors demand higher compensation
- Higher yields increase the cost of servicing the existing $40 trillion debt load
- Elevated debt servicing costs widen deficits further, requiring yet more issuance
At $40 trillion in outstanding debt, every 100 basis point increase in average borrowing costs adds approximately $400 billion in annual interest expense. This is not a theoretical calculation. It is the fiscal arithmetic that explains why Washington has a structurally powerful incentive to prevent long-term yields from rising freely.
Structural Warning: When sovereign interest costs exceed $1 trillion annually on a $40 trillion debt load, the political tolerance for allowing market forces to set borrowing costs diminishes sharply. Intervention becomes the path of least resistance, not the exception.
The Policy Framing Versus Market Reality Debate
Treasury officials have described the expanded buyback program in technical, neutral language, emphasising market functioning and secondary market liquidity. This framing is not inherently dishonest, since liquidity in specific maturity segments does affect overall market efficiency.
However, the critical distinction for investors is between a technical plumbing operation and a structurally motivated yield suppression effort. Routine liquidity maintenance occurs across the yield curve and across market conditions. An intervention that specifically doubles buying capacity in the 20-to-30-year range at the precise moment 30-year yields hit a 17-year high carries a different informational content.
The $32 trillion Treasury market is large enough that $4 billion per operation cannot mechanically control yields against sustained selling pressure. What the intervention does achieve is a powerful signal: that the government is willing to act when long-term borrowing costs breach certain thresholds. For investors tracking gold and bond markets simultaneously, that signal has option value that extends well beyond a single week's price action.
Historical Parallels: When Rate Suppression Meets Hard Assets
| Period | Country | Mechanism | Gold or Commodity Outcome |
|---|---|---|---|
| 1940s to 1950s | United States | Treasury-Fed Accord era yield caps | Gold price eventually unanchored post-1971 |
| 1970s | United States | Negative real rates amid oil shocks | Gold rose from approximately $35 to approximately $850 per ounce |
| 2011 to 2021 | Global post-GFC | QE and zero interest rate policies | Gold rose from approximately $700 to $2,075 per ounce |
| 2026 | United States | Treasury buyback expansion targeting long end | Current bull market in progress |
The pattern across these episodes is consistent. Every sustained period of government-directed interest rate suppression, implemented against a backdrop of elevated debt and inflation, has been accompanied by meaningful appreciation in hard assets. Gold's role as a monetary anchor and store of value is most powerfully activated precisely when fiscal credibility comes under pressure.
Pattern Recognition: Governments rarely intervene in bond markets when conditions are comfortable. The intervention itself is the signal. History suggests that when the intervention begins, it seldom ends with a single operation.
Multi-Scenario Analysis: What Treasury Buybacks Mean for Gold Prices
Scenario 1: Yields Remain Suppressed While Inflation Stays Elevated
In this environment, real interest rates — nominal yields minus prevailing inflation — remain near zero or deeply negative. Gold's opportunity cost advantage reaches its maximum. The historical analog is the 2020 to 2021 period, when suppressed yields combined with rising inflation expectations drove gold to what were then record highs. Under this scenario, the current bull market has structural support that could sustain upward momentum well beyond recent price levels.
Gold outlook: Structurally bullish with potential for acceleration if real rates deteriorate further.
Scenario 2: Buybacks Prove Insufficient as Yields Resume Climbing
Bond markets may ultimately overwhelm Treasury intervention capacity given the scale of new issuance required to finance ongoing deficits. In this scenario, short-term momentum reverses partially, but the underlying fiscal sustainability concerns that drove the intervention in the first place remain intact. Gold retains a debasement premium even in a rising yield environment if the reason for rising yields is deteriorating fiscal credibility rather than genuine economic strength.
Gold outlook: Volatile but supported by an elevated floor compared to pre-intervention levels.
Scenario 3: The Federal Reserve Resumes Rate Hikes
Fed officials have maintained that additional rate increases remain possible if inflation data deteriorates. Elevated oil prices, sustained by ongoing geopolitical tensions around the Strait of Hormuz, represent a material upside inflation risk. A tighter Fed stance would partially offset the yield-suppression effect of Treasury buybacks, creating a tug-of-war between fiscal and monetary policy. Consequently, this creates uncertain near-term outcomes for gold.
Gold outlook: Near-term headwinds possible, but medium-term thesis remains intact.
Scenario 4: The Dollar Accelerates Its Decline Below Key Technical Levels
The Dollar Index breaking below 99 is a psychologically and technically significant development. A sustained dollar downtrend amplifies gold's upside through two channels: gold becomes cheaper in non-dollar currencies, expanding the global buyer pool; and dollar weakness signals concerns about U.S. monetary and fiscal credibility, directly supporting gold's role as an alternative store of value.
Gold outlook: Most immediately bullish near-term scenario for precious metals price acceleration. The broader gold safe-haven dynamics at work in this scenario have strong historical precedent.
The next major ASX story will hit our subscribers first
Precious Metals Weekly Performance: Reading the Market Data
Weekly Scorecard
| Metal | Weekly Price | Weekly Change | Percentage Gain |
|---|---|---|---|
| Gold | $4,618 per ounce | +$230 | +5.3% |
| Silver | $70.18 per ounce | +$4.68 (approx.) | +7.3% |
| Platinum | $1,893 per ounce | Significant gain | +7.9% |
| Palladium | $1,360 per ounce | Modest gain | +2.0% |
| Copper | $6.58 per pound | Approaching record | Near all-time high of ~$6.80 |
The Gold-to-Silver Ratio as a Bull Market Barometer
The compression of the gold-to-silver ratio toward 66 carries specific technical significance that experienced precious metals investors will recognise. The gold-to-silver ratio measures how many ounces of silver are required to purchase one ounce of gold. When this ratio declines, silver is outperforming gold on a relative basis. In-depth gold-silver ratio analysis reveals that this type of compression has historically accompanied the more aggressive phases of bull markets.
Historically, ratio compression of this kind occurs during the more aggressive phases of precious metals bull markets, when investor participation broadens beyond institutional safe-haven buying into retail and speculative demand. Silver's 7.3% weekly gain outpacing gold's already strong 5.3% move, combined with platinum's outsized 7.9% advance, suggests the rally has broadened into a sector-wide rerating rather than a gold-specific safe-haven response.
This distinction matters analytically. A gold-only rally driven by fear has different durability characteristics than a broad precious metals move driven by a combination of monetary, fiscal, and industrial demand factors.
Copper as a Cross-Asset Macro Signal
Copper approaching its all-time high of approximately $6.80 per pound, currently trading at $6.58, provides important cross-asset validation for the current environment. Copper is widely regarded as a leading indicator of global economic activity, given its pervasive use across construction, manufacturing, and electrification infrastructure.
The fact that copper is strengthening alongside gold and silver suggests the market is not pricing an imminent deflationary recession, which would typically suppress industrial metals while lifting gold as a safe haven. Instead, the simultaneous strength across gold, silver, platinum, and copper points toward an inflationary or stagflationary macro environment — a backdrop that historically rewards hard asset exposure across multiple categories.
Key Risk Factors That Could Interrupt the Gold Bull Case
Understanding the risks to the current thesis is as important as understanding the tailwinds. Several factors could disrupt or delay the trajectory implied by treasury buybacks and gold prices moving in tandem:
- Federal Reserve policy divergence: If the Fed raises rates aggressively while the Treasury suppresses long yields, curve distortions could create unpredictable short-term volatility in both bonds and precious metals.
- Buyback scale limitations: Even at $4 billion per operation, the program remains modest relative to the $32 trillion Treasury market. Sustained selling from foreign holders, particularly large sovereign creditors reducing U.S. debt exposure, could overwhelm intervention capacity.
- Geopolitical de-escalation: A resolution of tensions around the Strait of Hormuz could ease oil prices, reduce inflation pressures, and diminish one of gold's near-term supporting narratives.
- Dollar stabilisation: If the Dollar Index recovers from below 99 and reestablishes a base, one key mechanical tailwind for gold would diminish.
- Profit-taking after compressed appreciation: A 5.3% weekly gain in gold and a 7.3% move in silver represent rapid appreciation that historically invites short-term consolidation before any next directional leg.
Furthermore, analysts at Metals Mine have noted that gold's outsized reaction to the Treasury buyback reflects deeper debasement concerns rather than purely technical price movements.
FAQ: Treasury Buybacks and Gold Prices Explained
Are Treasury buybacks the same as quantitative easing?
Treasury buybacks and Federal Reserve QE share the mechanical effect of adding demand for government bonds, but they differ fundamentally in origin and funding. The Fed creates new bank reserves to purchase assets, directly expanding the monetary base. The Treasury uses existing fiscal resources and operates within established appropriations. Both can suppress yields, but QE directly inflates the money supply while Treasury buybacks work within existing constraints.
Why does gold rise when Treasury yields fall?
Gold generates no income. When government bonds offer lower returns, investors sacrifice less by choosing gold over bonds. This relationship intensifies when real yields — nominal yields minus inflation — move into negative territory, at which point holding gold carries a lower opportunity cost than holding bonds that are losing purchasing power in real terms.
How large is the expanded program?
The expanded schedule doubles the maximum per-operation size in the 10-to-20-year and 20-to-30-year maturity ranges from $2 billion to $4 billion, with operations commencing September 9.
Can Treasury buybacks permanently suppress long-term yields?
No. While buybacks can influence yields at the margin and send important policy signals, they cannot override the market forces of a $32 trillion bond market indefinitely. If fiscal deficits continue expanding and inflation remains elevated, bond investors will ultimately demand higher compensation regardless of buyback activity.
What does the gold-to-silver ratio of 66 indicate?
A ratio of 66 indicates silver is outperforming gold. Historically, this type of ratio compression during precious metals bull markets signals broader investor participation and has often preceded the most aggressive phase of price appreciation in both metals.
Strategic Takeaways for Investors Tracking This Theme
The Three Indicators Worth Monitoring Closely
- 30-year Treasury yield: The primary transmission mechanism. Sustained moves above 5.3% will test whether the Treasury is willing to expand interventions further, with each decision carrying fresh signal value for gold.
- 10-year TIPS yield (real yield): The most direct driver of gold's opportunity cost. Negative or near-zero real yields represent the most reliably bullish environment for precious metals.
- Dollar Index relative to 99: A sustained break below this level historically correlates with accelerating precious metals performance, as it compounds the yield suppression effect by reducing the dollar's safe-haven premium.
The Dual Dilemma at the Core of the Gold Thesis
Washington faces a choice between two unfavourable outcomes, and gold benefits from both:
- Allow long-term rates to rise freely, and the cost of servicing $40 trillion in debt becomes increasingly destabilising, eventually forcing a fiscal adjustment that undermines confidence in dollar-denominated assets.
- Suppress long-term rates artificially, and currency debasement concerns intensify, inflation expectations become harder to anchor, and alternative stores of value attract growing capital flows.
Core Thesis: Gold does not require policymakers to choose the wrong path. It benefits structurally from the existence of the dilemma itself. Whether rates rise or are suppressed, the fiscal credibility question remains, and hard assets historically absorb the resulting demand over time.
The week ending August 23, 2026 may ultimately be remembered less for the specific price levels gold and silver reached and more for what the Treasury's intervention revealed about the structural constraints now governing U.S. fiscal and monetary policy. With $40 trillion in debt and counting, the incentive to keep long-term borrowing costs contained is not diminishing. It is intensifying. For those monitoring the gold price outlook over the medium term, the relationship between treasury buybacks and gold prices may represent the most enduring story of the current cycle.
Disclaimer: This article is intended for informational and educational purposes only and does not constitute financial or investment advice. Precious metals prices are subject to significant volatility. All forecasts, scenarios, and analytical frameworks discussed represent potential outcomes only and involve inherent uncertainty. Past performance of gold, silver, or any asset class is not indicative of future results. Investors should conduct their own due diligence and consult a qualified financial adviser before making any investment decisions.
Want to Position Yourself Ahead of the Next Major Mineral Discovery?
While macro forces like Treasury buybacks and yield suppression are reshaping precious metals markets, Discovery Alert's proprietary Discovery IQ model delivers real-time alerts on significant ASX mineral discoveries — translating complex market data into actionable opportunities the moment they emerge. Explore how historic discoveries have generated extraordinary returns and begin your 14-day free trial today to secure a genuine edge in this accelerating hard assets cycle.