June 27, 2026
When Technical Signals and Macro Forces Collide: Decoding Gold's Critical Juncture
Precious metals markets have a long history of punishing traders who mistake temporary recoveries for sustained reversals. The psychology behind this dynamic is well-documented: after a meaningful price decline, short-covering and bargain hunting create convincing upside momentum that draws in new buyers, only for the underlying trend to reassert itself. Consequently, genuine trend exhaustions often look identical in their early stages, making the distinction between a relief rally and a downtrend finale one of the most consequential calls in the gold relief rally or downtrend finale debate. Understanding which scenario is unfolding requires a structured, multi-layered approach drawing on technical momentum, structural demand, equity market dynamics, and economic data simultaneously.
When big ASX news breaks, our subscribers know first
Setting the Analytical Baseline: Gold's Recent Price Trajectory
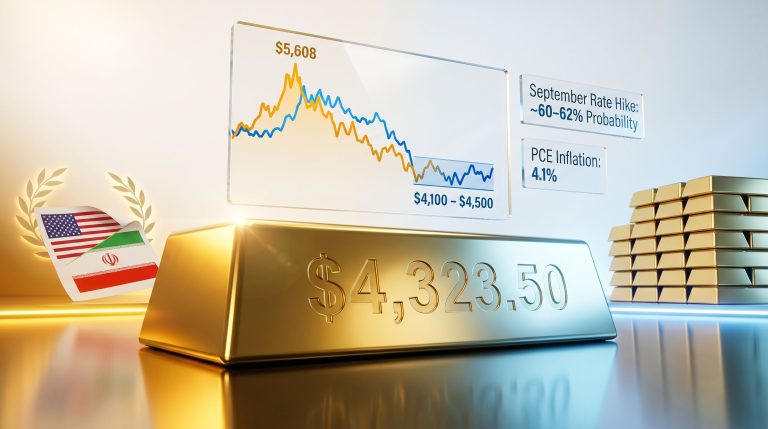
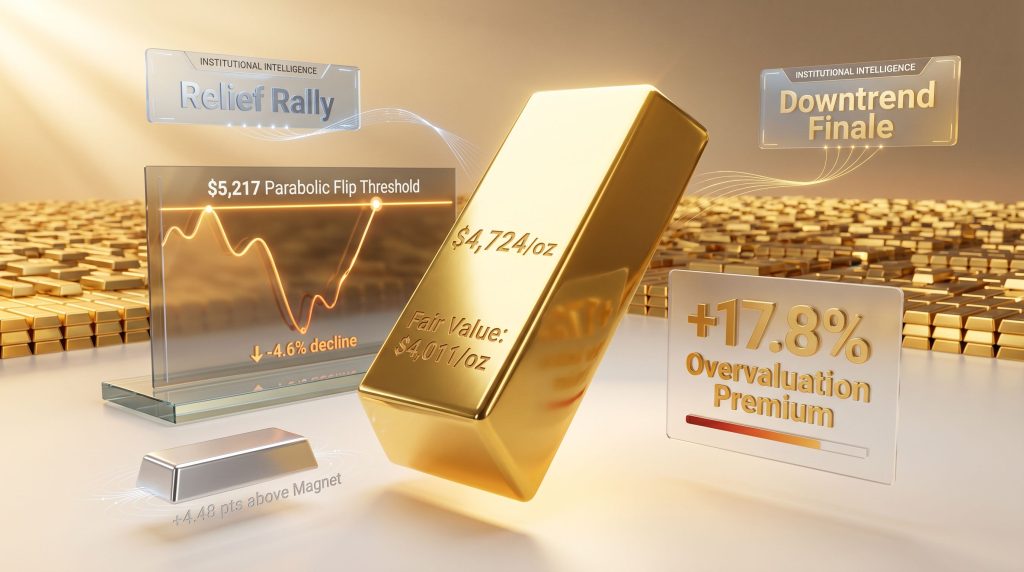
The setup entering the current analytical window carries genuine complexity. Gold declined approximately -4.6% from a late-April high near $4,725/oz to an intraweek low around $4,510/oz, a move that initially appeared to validate an ongoing bearish trend. However, the metal staged a sharp recovery, reaching $4,775/oz intraday before settling the week near $4,724/oz, effectively recapturing the entire loss and adding a modest premium.
The BEGOS Market Value framework, which measures gold's fair positioning relative to the composite behaviour of Bonds, the Euro, Gold itself, Oil, and the S&P 500, currently places gold's value near $4,748/oz. With spot price settling near that same level, the two figures are converging — a condition that technical analysts recognise as a potential precursor to mean reversion activity.
What makes the picture more nuanced is gold's computed fair value of approximately $4,011/oz, implying a +17.8% overvaluation premium at current prices. This gap between market price and modelled value is not necessarily an immediate sell signal. Structural demand forces can sustain elevated premiums for extended periods. However, it does narrow the margin of safety and reinforces the importance of determining whether current price action represents conviction buying or temporary repositioning. For further context on where prices could head, the gold market outlook for 2025 provides a useful macro-level frame.
| Metric | Level | Implication |
|---|---|---|
| Late-April Peak | ~$4,725/oz | Prior high before decline |
| Intraweek Low | ~$4,510/oz | -4.6% drawdown bottom |
| Intraday Recovery High | ~$4,775/oz | Short-term ceiling tested |
| Weekly Settlement | ~$4,724/oz | Consolidation close |
| BEGOS Market Value | ~$4,748/oz | Near-convergence with spot |
| Computed Fair Value | ~$4,011/oz | +17.8% overvaluation premium |
| Weekly Parabolic Flip Threshold | ~$5,217/oz | Required for Long signal |
The Core Question: Relief Rally or Downtrend Finale?
These two scenarios are structurally distinct, even when early price behaviour looks similar on a chart.
A relief rally is a temporary price recovery that occurs within the body of an ongoing downtrend. It is typically driven by short-covering, momentum exhaustion on the downside, or sentiment-driven buying that lacks fundamental support. The defining characteristic is that the underlying trend reasserts itself once the short-covering pressure dissipates.
A downtrend finale, by contrast, marks the genuine exhaustion of selling pressure. It is characterised by a transition from distribution to accumulation, where the weight of evidence shifts from bearish to neutral and eventually bullish. The difference between the two scenarios is not merely academic — positioning on the wrong side of this call carries direct financial consequences.
Correctly framing this question requires examining evidence across at least three dimensions: short-term technical momentum, medium-term trend structure, and longer-term macro fundamentals.
How Technical Indicators Frame the Debate
Reading Momentum Oscillators as Leading Indicators
A foundational concept in technical analysis distinguishes between leading indicators and lagging indicators. Trend lines, by their construction, confirm price moves that have already occurred. Momentum oscillators, by contrast, can shift direction before the price trend itself rotates, providing an early signal of potential change.
Both gold and silver currently retain negatively skewed 21-day linear regression trends, which is technically bearish. However, the rate of downside deterioration within those trends is visibly decelerating. More importantly, short-term momentum oscillators, which track the internal consistency of the regression trend, have turned upward for three consecutive sessions. This is a meaningful early signal because it suggests the trend's downside conviction is weakening even before the trend line itself turns.
If this momentum shift is sustained, both metals could see their 21-day regression trends rotate from negative to positive within approximately one to two weeks, specifically when the momentum indicators cross back above their neutral zero axes. Investopedia's gold price history shows that such momentum shifts have historically preceded significant directional moves in either direction.
Market Magnet Dynamics: Understanding the Attraction Mechanism
The Market Magnet framework operates on the principle that prices are drawn toward a dynamically calculated equilibrium level. When price crosses above its Magnet from below, this crossover historically tends to be followed by continued upside as momentum reinforces the directional shift. Both gold and silver have recently executed upside price crossovers above their respective Magnet levels, which is technically constructive.
Gold's price currently sits approximately +80 points above its Magnet, compared to prior peak excursions of +200 points or more. This comparison is analytically useful because it suggests the current rally has not yet reached the kind of stretched positioning that historically triggers mean reversion pullbacks. There is meaningful upside headroom before exhaustion sets in.
Silver's Magnet distance of approximately +4.48 points is comparable to readings from around one month prior, while a February 2026 excursion extended to roughly +10 points higher. This historical comparison implies that silver has not exhausted its recent move relative to prior cycles. Furthermore, the gold-silver ratio insights for 2025 offer additional context on how the relative positioning of both metals can signal broader market turning points.
The Weekly Parabolic Trend: A Structural Barrier That Cannot Be Ignored
The weekly timeframe presents the starkest challenge to the downtrend finale thesis. Gold has registered eight consecutive Short-signal weeks under its parabolic trend framework. Critically, the most recent six of those weeks have displayed sideways price action rather than continued price deterioration, which is a subtle but important distinction. Selling exhaustion tends to manifest as sideways consolidation before reversal, so this pattern is at least directionally encouraging.
However, the maths of a trend reversal remains demanding. For gold to flip its weekly parabolic trend from Short to Long, price would need to rally approximately +493 points to eclipse the $5,217/oz threshold. With the projected weekly trading range sitting near 335 points (and recent realised ranges closer to 265 points), achieving this threshold within a single week would require an extraordinary catalyst — something on the scale of a major geopolitical shock or a dramatic policy announcement.
Key Structural Reality: Even if gold continues climbing steadily, the weekly trend reversal is likely two or more weeks away under normal market conditions. Short-term traders and longer-term investors need to hold different frameworks simultaneously when assessing current positioning.
Scenario Analysis: Pathways to Resolution
Scenario A: The Downtrend Finale Takes Hold
For this scenario to materialise, the following conditions would need to align:
- Momentum oscillators sustain their upward trajectory and cross above neutral axes within one to two weeks
- Price holds above near-term converted support levels (gold near $4,691; silver in the $80s range)
- Trading ranges expand meaningfully beyond the 335-point weekly projection
- Macro catalysts, such as Federal Reserve policy shifts or sustained USD weakness, reinforce the technical picture
The structural demand case for this scenario has legitimate foundation. Central bank gold demand has been a defining feature of recent cycles, with institutions globally diversifying away from traditional reserve assets and gold's share of official reserves reaching historically elevated levels. Gold demand set a record in value terms in Q1 2026, according to World Gold Council data — a development that reflects sustained institutional conviction even at elevated price levels.
Additionally, global ETF flows into gold-backed products have been recovering after a period of outflows, suggesting that institutional and retail sentiment is tilting back toward accumulation. Historical analysis of Federal Reserve rate-cutting cycles also shows that gold has tended to perform constructively in the medium-term period following the initial rate reduction, as the opportunity cost of holding a non-yielding asset compresses.
Scenario B: The Relief Rally Scenario
The case for this being a temporary recovery rather than a genuine trend reversal rests on several observable conditions:
- The weekly parabolic trend remains firmly Short, requiring substantial additional upside to reverse
- Gold's +17.8% premium above computed fair value creates structural mean reversion pressure
- Momentum indicators have only just turned upward, and three sessions of improvement does not yet constitute confirmed rotation
- Liquidity-driven selling dynamics remain a risk if equity markets experience further stress
A particularly important dynamic worth understanding is how gold behaves during acute liquidity events. When equity markets experience sharp, rapid drawdowns, institutional investors sometimes sell gold alongside risk assets — not because they have lost conviction in gold's thesis, but because they need to raise cash quickly to meet margin calls. This liquidity-driven selling overrides gold's typical safe-haven mechanics in the short term. Early 2026 provided a visible example of this dynamic, and the recession impact on gold in comparable periods illustrates how these episodes tend to resolve.
Critical Warning for Short-Term Traders: Gold declining alongside equities during market stress does not invalidate the long-term bull case. It signals a liquidity event, which historically has preceded some of gold's strongest recovery phases. However, the short-term downside during such events can be severe.
The S&P 500 Valuation Problem: A Macro Risk With Gold Implications
Understanding the Equity Valuation Extreme
The S&P 500's current valuation environment represents one of the most important macro backdrops for gold in the current cycle. The index's price-to-earnings ratio settled near 48.20x, meaning investors are paying approximately $48.20 for every $1.00 of annual index earnings. Adding the index's dividend yield of approximately 1.08% produces an all-in projected one-year return of roughly +3.15%.
To contextualise how inadequate this return is, consider that the annualised three-month U.S. Treasury Bill currently yields materially more. For the S&P's dividend yield alone to match the risk-free T-Bill rate, the index would theoretically need to decline approximately -64% from current levels. This mathematical reality illustrates the depth of the valuation gap, even accounting for the expectation of capital appreciation.
Individual constituent valuations extend this picture to an extreme degree:
| Company | P/E Ratio | Earnings per $1 Paid | Risk Classification |
|---|---|---|---|
| S&P 500 Index | ~48.20x | $1.00 per $48.20 | Elevated |
| Tesla (TSLA) | ~358x | $1.00 per $358.00 | Extreme |
| CoStar Group (CSGP) | ~536x | $1.00 per $536.00 | Extreme |
| Datadog (DDOG) | ~647x | $1.00 per $647.00 | Extreme |
| CrowdStrike (CRWD) | Negative earnings | $0 per $528.00 | Critical |
Why This Matters for Gold: The Two-Phase Response Dynamic
Extreme equity overvaluation creates a bifurcated macro environment for gold that plays out in two distinct phases. In the first phase, when an equity correction begins, gold often sells off alongside stocks as liquidity demands dominate. In the second phase, once the initial liquidation is complete, capital rotation from overvalued equities into hard assets historically creates powerful tailwinds for gold.
The combination of a near-50x P/E ratio, a dividend yield that offers a fraction of the risk-free rate, and constituent valuations that stretch into the hundreds of multiples creates conditions where the risk-reward profile of equities is fundamentally deteriorating relative to gold over a medium-term horizon. This structural backdrop provides a macro foundation for the downtrend finale scenario even when short-term technicals remain ambiguous. In addition, the relationship between gold and mining equities in such environments can amplify the directional move, as mining stocks often lead gold itself during genuine trend reversals.
Furthermore, Forbes Australia's analysis of the Dow, S&P 500 and Nasdaq rebound highlights how equity relief rallies and gold price stumbles have coincided in recent sessions — a pattern worth monitoring closely as the interplay between asset classes continues to evolve.
The next major ASX story will hit our subscribers first
Economic Data Context: The Productivity Paradox
The most recent economic data cycle presented a genuinely mixed picture. Of 18 tracked economic metrics in the latest reporting period, eight improved, eight deteriorated, and two were unchanged. Factory Orders for March provided the standout positive reading, beating both consensus forecasts and February's revised figure. Manufacturing activity, at least in this data point, remains constructive.
However, the counterbalancing negative came from Q1 Productivity data, which missed consensus estimates and came in below Q4's figure (which was itself revised lower). More output is being produced, but with declining efficiency — meaning more inputs are being consumed to generate each unit of economic production.
This productivity weakness carries an important structural implication for gold: declining productivity growth is inherently inflationary. When businesses require increasing inputs to maintain output levels, unit costs rise, and pricing pressure filters through the broader economy. This dynamic reinforces gold's role as a long-term inflation hedge, even when short-term price action remains technically constrained by trend signals.
Gold vs. Silver: Comparative Technical Positioning
The two metals are sending broadly aligned signals at present, which adds weight to the directional case in either scenario.
| Indicator | Gold | Silver | Interpretation |
|---|---|---|---|
| 21-Day Regression Trend | Negative, softening | Negative, softening | Aligned bearish but decelerating |
| Momentum Oscillator | Rising 3 sessions | Rising | Early rotation signal for both |
| Magnet Distance | ~+80 points | ~+4.48 points | Gold has more relative headroom |
| Prior Magnet Peak Excursion | ~+200 points | ~+10 points (Feb 2026) | Both have room versus prior peaks |
| Near-Term Support | ~$4,691 | ~$80s range | Converted resistance holding as support |
Silver's current Magnet distance is broadly in line with readings from approximately one month ago, and its February excursion extended roughly +10 points further than current levels. This suggests the white metal retains additional upside capacity before exhaustion relative to recent cycle history. The fact that both metals have converted prior resistance zones into support during last week's rally is technically constructive, assuming those levels hold through the coming sessions.
Strategic Assessment: Where Does the Weight of Evidence Land?
Synthesising the technical, structural, and macro evidence produces a probability-weighted assessment across two distinct timeframes.
Short-Term (1-2 Weeks):
- Weekly parabolic trend remains firmly Short, requiring ~493 points of additional upside to reverse
- Projected weekly trading ranges (335 points) are insufficient to achieve the flip threshold in a single week
- Overvaluation premium of +17.8% above computed fair value creates near-term mean reversion risk
- Mixed economic data provides no definitive macro acceleration catalyst
- Verdict: Relief rally probability elevated
Medium-Term (1-6 Months):
- Momentum oscillators showing genuine early rotation signals after three consecutive upside sessions
- Structural demand from central banks and gold-backed ETFs remains intact
- Extreme equity overvaluation creates conditions for eventual capital rotation into hard assets
- Productivity weakness reinforces structural inflation-hedge demand
- The sideways consolidation pattern over the last six weekly Short-signal weeks suggests selling exhaustion rather than continuation
- Verdict: Downtrend finale probability rising
Disclaimer: This analysis is for informational purposes only and does not constitute financial advice. All technical signals, valuation models, and scenario projections involve inherent uncertainty. Past performance of gold, silver, or equity indices is not indicative of future results. Investors should conduct independent research and consult qualified financial advisers before making any investment decisions.
The most defensible analytical position at this stage is that the gold relief rally or downtrend finale question remains genuinely unresolved. Gold occupies a transitional zone where neither scenario has yet confirmed. The behaviour of momentum indicators and price relative to near-term support levels over the next one to two weeks will likely determine which hypothesis deserves the stronger conviction weighting. Longer-horizon investors face a structurally favourable macro environment built on genuine demand foundations, whilst shorter-term participants face real technical uncertainty that demands disciplined risk management above all else.
Want To Be First When The Next Major Gold Discovery Hits The ASX?
Discovery Alert's proprietary Discovery IQ model scans ASX announcements in real time, instantly converting complex mineral data into actionable opportunities across gold and 30+ other commodities — so subscribers are positioned ahead of the broader market before momentum builds. Explore how historic mineral discoveries have generated extraordinary returns on the Discovery Alert discoveries page, then start your 14-day free trial to secure your market-leading edge.