
June 5, 2026
The Incomplete Model Most Investors Are Still Using
Most financial commentary operates on a simple and seductive logic: when central banks raise interest rates, gold falls. Higher rates make bonds more attractive, strengthen the dollar, and drain capital away from non-yielding assets. The textbook is clear. The headlines repeat it daily. And in certain economic environments, it is entirely accurate.
However, understanding why is gold rising when rate hike odds rise requires looking well beyond this simplified framework, particularly in the macro environment of 2026.
When April 2026 JOLTS data revealed 7.62 million job openings against a consensus expectation of 6.88 million, a beat of roughly 750,000, the standard playbook predicted gold would retreat. Instead, gold gained approximately $43 to trade near $4,477 per ounce. Meanwhile, the probability of a Federal Reserve rate hike by December 2026 climbed to 85% on the CME FedWatch Tool, up sharply from 60% just one week prior (CME Group, June 2026).
The answer lies not in the policy rate itself, but in a variable most financial headlines overlook entirely.
When big ASX news breaks, our subscribers know first
The Variable That Actually Governs Gold's Direction
The standard rate-gold model contains a fundamental flaw: it conflates nominal interest rates with real interest rates, and the distinction matters enormously.
The formula is straightforward:
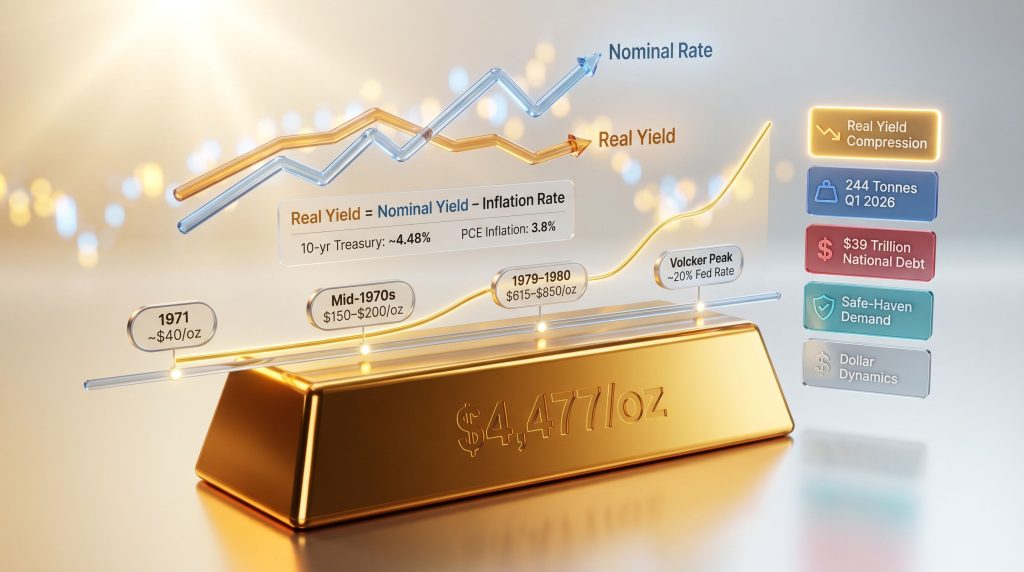
Real Yield = Nominal Yield minus Inflation Rate
Gold's true competitor is not the headline federal funds rate. It is the real yield available on savings instruments and government bonds after inflation is factored in. When nominal yields are high but inflation is running at a comparable pace, the effective purchasing-power return on fixed income approaches zero or turns negative. In that environment, gold's absence of a coupon payment stops being a disadvantage and starts being a structural feature.
As of the April 2026 data release, the U.S. Personal Consumption Expenditures (PCE) price index was running at 3.8% year-over-year (Bureau of Economic Analysis, May 2026). The 10-year Treasury yield was sitting near 4.48 to 4.49% (U.S. Treasury, June 2026). The implied real yield on a 10-year bond was barely above +0.6 to +0.7%. The 10-year TIPS yield was tracking near 1.96 to 1.99% as of early April 2026 (Trading Economics).
These figures are positive, but they are nowhere near the threshold that has historically made bonds structurally preferable to gold as a store of purchasing power. Furthermore, gold's relationship with real interest rates is one of the most consistently misunderstood dynamics in mainstream investing commentary.
The variable that drives gold's directional trend is not the fed funds rate announcement. It is the real yield on Treasury securities. When inflation erodes the purchasing-power value of fixed-income returns, gold's zero nominal yield becomes competitively attractive in real terms.
How Stagflation Rewires the Relationship Between Rates and Gold
Identifying the Stagflationary Regime
Stagflation is economically distinct from a standard inflationary cycle. In a typical overheating economy, strong growth drives price pressure, and rate hikes address the root cause by cooling demand. In a stagflationary environment, something fundamentally different is happening: economic momentum is stagnating while inflation remains persistently elevated, driven by structural factors such as energy supply constraints, fiscal deficits, and supply-chain disruptions rather than demand excess.
The current macro backdrop exhibits several hallmarks of this condition:
- PCE inflation holding at 3.8% despite multiple prior tightening cycles (Bureau of Economic Analysis, May 2026)
- Labour market resilience, with April 2026 nonfarm payrolls adding 115,000 jobs against a consensus of just 62,000, without corresponding productivity acceleration
- Services inflation remaining sticky even as goods disinflation moderates the headline figure
- GDP growth decelerating whilst cost pressures persist across energy and housing sectors
Why Rate Hike Signals Become Bullish in This Context
In a stagflationary environment, rising rate-hike probability communicates policy desperation rather than policy success. The Fed is responding to structural price pressures it cannot fully address through rate adjustments alone. Rate hikes take between 12 and 18 months to filter through the broader economy via credit conditions and borrowing costs. Inflation driven by fiscal deficits, energy dynamics, and supply constraints does not respond to monetary tightening on the same timeline.
The result is what analysts describe as real yield compression: nominal rates tick higher, inflation expectations remain elevated or rise in parallel, and the net improvement in purchasing-power-adjusted returns is marginal. A 25 basis point increase in the federal funds rate against 3.8% PCE inflation does not move the real yield needle in any meaningful way. Gold's competitive position against bonds remains largely intact.
According to Investopedia's analysis of rate hikes and gold, the relationship between monetary policy and gold prices is far more nuanced than conventional wisdom suggests.
Step-by-step: how real yield compression supports gold prices
- The central bank signals a rate hike and nominal yields edge modestly higher
- Inflation expectations simultaneously remain elevated or increase
- Real yield (nominal minus inflation) barely improves or stays compressed near historical lows relative to prior cycles
- Fixed-income investors earn minimal purchasing-power-adjusted returns on bonds
- Gold, which carries no coupon payment to erode in real terms, maintains its relative appeal
- Institutional, sovereign, and retail capital continues gravitating toward physical gold as a real-return alternative
What the 1970s Actually Prove: A Macro Laboratory
The most instructive historical test of the rate-gold relationship is not a theoretical model. It is the decade-long stagflationary episode that began with President Nixon's suspension of dollar-gold convertibility in August 1971 and concluded with Paul Volcker's aggressive tightening campaign in the early 1980s.
| Period | Federal Funds Rate (Approx.) | Gold Price (Approx.) | Real Yield Environment |
|---|---|---|---|
| 1971 (Nixon Shock) | ~4.7% | ~$40/oz | Near-zero to negative |
| Mid-1970s | Rising toward 10%+ | $150 to $200/oz | Persistently negative |
| 1979 to 1980 | Approaching 15 to 20% | $615 to $850/oz | Still near-zero to marginally positive |
| 1981 (Volcker peak) | ~20% | Declining from peak | Decisively positive (+4% to +6%) |
Sources: Federal Reserve Historical Data; Bureau of Labor Statistics
Gold appreciated from approximately $40 per ounce to a January 1980 peak of $850, a gain exceeding 1,400%, during a period when the Federal Reserve was actively and aggressively tightening monetary policy. The critical observation is precise: gold did not decline because rates rose. It declined only when real yields turned decisively and sustainably positive.
The Volcker Exception: What It Actually Required
Paul Volcker's intervention between 1979 and 1981 is frequently cited as evidence that rate hikes can end gold bull markets. The more accurate lesson is far more specific. Volcker did not simply raise rates. He accepted a deliberate and severe economic contraction as the necessary cost of restoring price stability. The federal funds rate peaked near 20% by mid-1981. Unemployment climbed to 10.8% (Bureau of Labor Statistics). The real yield achieved was +4% to +6% above prevailing inflation.
That threshold, not the nominal rate, broke entrenched inflation expectations and ended the structural bull market for gold.
Volcker's success required two simultaneous conditions: nominal rates materially exceeding the prevailing inflation rate, and the sustained political will to absorb a deep recession. The fiscal arithmetic of 2026 makes replicating both conditions structurally implausible at anything approaching that scale.
The Fiscal Constraint: Why a Modern Volcker Replay Is Structurally Improbable
Understanding why the Volcker precedent does not translate directly to the current environment requires examining the fiscal mathematics underlying U.S. monetary policy today.
| Fiscal Variable | Current Estimate | Source |
|---|---|---|
| U.S. National Debt | Approaching $39 trillion | Joint Economic Committee, March 2026 |
| Annual Federal Interest Expense | Over $1 trillion | Congressional Budget Office, FY2026 |
| Rate Required to Achieve +4% Real Yield | ~8 to 9% fed funds rate | Derived from PCE at ~3.8% |
| Estimated Annual Interest Cost at 8 to 9% | Approaching $3 trillion | Extrapolated from CBO baseline |
With national debt approaching $39 trillion and annual interest payments already exceeding $1 trillion at current rates, the federal government faces a structural ceiling on how aggressively monetary policy can tighten. Replicating the real yield environment Volcker achieved would require pushing the federal funds rate to approximately 8 to 9% while inflation holds near 3.8%. The resulting annual debt servicing cost would approach $3 trillion, representing a fiscal crisis in itself.
Paradoxically, a sovereign debt spiral triggered by aggressive rate hikes would not weaken the structural case for gold. It would strengthen it dramatically.
The Policy Trap: Both Paths Support Gold
This creates what TD Securities commodities strategist Bart Melek observed in early June 2026: higher inflation expectations stemming from energy supply dynamics have pushed yields across the curve higher and prompted markets to price in a potential Fed hike in late 2026, a circumstance where the bank simultaneously maintains a long-term gold target well above $5,000 per ounce (TD Securities, June 3, 2026).
The mechanism behind that coexistence is the policy trap itself:
Scenario A: Incremental Tightening (Base Case)
The Fed raises rates by 25 basis points. Real yields improve by a fraction of one percent. Inflation remains structurally elevated. Gold's purchasing-power competitive advantage over bonds is maintained. The structural bull case remains intact.
Scenario B: Aggressive Tightening (Tail Risk)
The Fed attempts a more forceful response. Debt servicing costs escalate toward fiscal crisis territory. Sovereign credibility deteriorates. Gold demand accelerates as a hedge against fiscal instability rather than retreating as a response to higher rates.
Both paths generate conditions that preserve or enhance the structural rationale for owning gold. The asymmetry of outcomes is structurally favourable regardless of which scenario materialises. In addition, the dynamics of gold bonds across economic cycles provide further context for understanding how these competing forces interact over time.
Sovereign Demand: The Layer That Changes the Floor
One dimension of the current gold market that the standard rate-gold model entirely fails to capture is the structural shift in who is buying physical gold and why.
The World Gold Council confirmed 244 tonnes of net central bank gold purchases in Q1 2026 alone, continuing seventeen consecutive quarters of net sovereign accumulation (World Gold Council Gold Demand Trends Q1 2026, April 2026). Central banks influencing gold prices through sustained reserve accumulation are not behaving inconsistently with their rate-setting mandates. They are hedging the purchasing-power risk embedded in their own fiat currency issuance, a dynamic that operates on entirely different logic than short-term rate cycle positioning.
Several additional dynamics define this structural shift:
- Physical investment demand is overtaking jewellery demand as the primary gold consumption category, a transition the World Gold Council describes as occurring for the first time on record
- Unlike ETF flows or speculative futures positioning, sovereign reserve purchases represent long-term reallocation decisions that are not reversed on monthly economic data releases
- The U.S. still leads global gold reserves with 8,133.5 tonnes, but the accumulation trend is concentrated among emerging-market central banks seeking to diversify away from dollar-denominated reserves
- Seventeen consecutive quarters of net purchases represents a fundamental recalibration of how sovereign institutions value gold relative to fiat currency alternatives
Sustained sovereign demand of this scale creates a structural price floor that individual rate decisions cannot easily override. This is arguably the single most underappreciated factor in mainstream commentary on why is gold rising when rate hike odds rise.
The next major ASX story will hit our subscribers first
Reading Economic Data Through a Real Yield Lens
The April 2026 labour market data releases illustrate precisely why the real yield framework produces more durable analytical conclusions than the standard rate-reaction model.
| Data Scenario | Short-Term Gold Reaction | Structural Implication for Gold |
|---|---|---|
| Strong jobs print | Potential short-term pressure as hike odds rise | 25bp hike against 3.8% PCE leaves real yields compressed; structural thesis unchanged |
| Weak jobs print | Immediate safe-haven bid strengthens | Stagflation picture sharpens; slow growth plus sticky inflation is the classic gold-positive regime |
| In-line print | Neutral to mildly positive | Market attention returns to real yield dynamics; no change to structural direction |
April 2026 nonfarm payrolls of 115,000 jobs against a 62,000 consensus represented a meaningful upside surprise. Under the textbook model, that print should have pressured gold. It did not, because informed market participants have increasingly adopted the understanding that monthly employment releases generate hours of volatility whilst the real yield mechanism generates years of directional trend.
Historically, short-term gold dips following strong labour market data have functioned as accumulation opportunities for investors who understood the underlying mechanism had not changed. The data point is noise. The mechanism is the signal.
What Would Actually Reverse the Structural Gold Thesis
The intellectual honesty of the real yield framework requires acknowledging its single genuine vulnerability.
The only historically validated mechanism for terminating a stagflation-era gold bull market is the achievement of sustained, decisively positive real yields above approximately +4%, held long enough to break entrenched inflation expectations. This is not speculation. It is the empirical lesson of 1981.
Investors monitoring the structural gold thesis should watch the following indicators for genuine inflection signals:
- The 10-year TIPS yield sustained above +3.5% to +4.0% (currently near 1.96 to 1.99%)
- PCE inflation declining toward 2% whilst nominal yields remain materially elevated
- Federal debt-to-GDP stabilising or declining, reducing the fiscal constraint on rate policy
- A policy commitment demonstrating willingness to absorb recessionary costs comparable to the Volcker era
None of these conditions are present in the current environment. Furthermore, gold as a safe haven investment continues to attract sustained institutional interest precisely because these conditions remain so structurally distant. Until the 10-year TIPS yield reaches and sustains the +4% threshold that historically ended gold bull markets, the mechanism driving gold's structural appreciation remains operational.
Five Simultaneous Forces Supporting Gold in 2026
The real yield argument is compelling on its own, but gold's current structural position is reinforced by multiple converging forces that the rate-reaction model cannot account for individually.
| Force | Current Status | Directional Bias for Gold |
|---|---|---|
| Real yield compression | TIPS near 1.96%, well below +4% threshold | Bullish |
| Sovereign accumulation | 244 tonnes net in Q1 2026; 17 consecutive quarters | Bullish |
| Fiscal credibility risk | $39T debt, $1T+ annual interest expense | Bullish |
| Safe-haven demand | Geopolitical volatility, trade policy uncertainty | Bullish |
| Dollar dynamics | Structural pressure from debt and deficit trajectory | Bullish |
The convergence of these five drivers within a single macro environment is unusual by historical standards. Each force operates on a different mechanism and a different time horizon, which means they do not cancel each other out during short-term volatility episodes. Consequently, they collectively reinforce a structural floor beneath gold prices that monthly data surprises cannot sustainably breach. Gold's historic $3,000 milestone demonstrated precisely this dynamic in action, as multiple structural forces converged to support prices through periods of elevated rate expectations. JPMorgan's research on gold price dynamics similarly highlights the multi-driver nature of gold's current structural positioning.
FAQ: Why Is Gold Rising When Rate Hike Odds Rise?
Does gold always fall when the Fed raises rates?
No. The relationship is conditional on the economic regime. In a healthy-economy tightening cycle where growth is robust and inflation is the primary target, rate hikes push real yields higher and create genuine headwinds for gold. In a stagflationary environment, nominal rate hikes do not automatically produce meaningfully positive real yields, and gold's competitive position remains structurally intact.
What is the real yield and why does it matter more than the policy rate?
The real yield is the inflation-adjusted return on a fixed-income instrument, calculated by subtracting the prevailing inflation rate from the nominal yield. Because gold pays no nominal return, it competes most directly with the real yield available on bonds and savings. When real yields are near zero or marginally positive, gold's absence of coupon income stops being a competitive disadvantage.
What level of real yields has historically ended gold bull markets?
Evidence from the Volcker era indicates that real yields need to reach approximately +4% or above, sustained long enough to break inflation expectations, to terminate a structural gold bull market. Marginally positive real yields in the +0.5% to +2% range have not historically been sufficient in stagflationary contexts.
Why can central banks buy gold while raising rates simultaneously?
Sovereign institutions operate on multi-decade reserve allocation frameworks rather than short-term rate cycle logic. Central banks accumulating gold whilst raising domestic rates are hedging the purchasing-power risk inherent in their own fiat currency creation. These are not contradictory behaviours within a long-duration reserve management context.
What is the single most important indicator to monitor for a structural shift in gold's direction?
The 10-year TIPS yield is the most direct real-time measure of the variable that actually governs gold's structural direction. As of early 2026, it was running near 1.96 to 1.99%, far below the +4% historical threshold. Investors focused on the headline fed funds rate are monitoring the wrong variable.
Disclaimer: This article is intended for informational and educational purposes only. It does not constitute financial or investment advice. All data referenced reflects information available at the time of writing. Precious metals involve risk and past performance is not indicative of future results. Consult a qualified financial adviser before making investment decisions.
Want To Profit From The Next Major Mineral Discovery Before The Market Catches On?
While gold's macro dynamics reveal the importance of real-yield analysis, the most significant wealth-creation opportunities often emerge from ground-level mineral discoveries — and Discovery Alert's proprietary Discovery IQ model delivers real-time ASX alerts the moment those discoveries are announced, transforming complex geological data into actionable investment insights. Explore historic examples of extraordinary discovery returns and begin your 14-day free trial today to position yourself ahead of the broader market.