August 8, 2026
The Case for Gold Royalty Companies in a Structurally Broken Monetary System
History offers a useful lens here. Every major monetary inflection point, from the breakdown of Bretton Woods in the early 1970s to the quantitative easing era following the 2008 financial crisis, has been preceded by a period of apparent stability that masked deepening structural fragility. Sovereign balance sheets expand. Fiscal deficits compound. Bond markets quietly begin pricing in risk that politicians have not yet acknowledged publicly. Gold, almost without exception, has been the first asset to sense the shift.
The conditions present in mid-2025 bear a striking resemblance to those historical precursors. Understanding the gold royalty company and gold price outlook, and which investment structures capture that upside most efficiently, requires going beyond headlines and into the structural mechanics of how capital flows in and out of the precious metals sector.
When big ASX news breaks, our subscribers know first
How the Gold Royalty Business Model Fundamentally Differs From Mining
The Core Mechanics: Revenue Without the Shovel
At its most fundamental level, a gold royalty company is a financing entity, not an operating one. It provides capital to mining operators in exchange for the right to receive a percentage of future production revenue. The royalty holder never swings a pickaxe, manages a tailings dam, or negotiates a diesel supply contract. It simply receives a percentage of the top line generated at the mine site.
This distinction matters enormously in an inflationary environment. When energy prices rise, when explosives costs escalate because oil products are embedded in their manufacturing, and when labour markets tighten, those cost pressures fall entirely on the operator. The royalty company's revenue calculation happens before any of those costs are deducted. It earns a share of gross revenue, not net profit.
Gold Royalty Corp, led by chairman and CEO David Garafalo, exemplifies this structural efficiency. The company operates with just 14 employees and quarterly fixed costs of approximately $2 million, representing an annual overhead of roughly $8 million. That lean structure means virtually every additional dollar of revenue flowing from rising gold prices or increasing production volumes falls directly to the bottom line.
Royalties vs. Streaming: Understanding the Structural Distinction
These two financing mechanisms are frequently conflated, but they operate differently. A royalty entitles the holder to a percentage of revenue or production from a mine, typically calculated as a net smelter return (NSR) or gross overriding royalty. A stream is a forward purchase agreement where the streaming company pays an upfront amount in exchange for the right to buy a fixed percentage of future production at a predetermined, below-market price.
Both models insulate the financier from operating cost inflation, but royalties tend to carry simpler administrative structures. Streams require ongoing delivery mechanics and price settlement processes, whereas royalties are passive instruments that generate income without requiring ongoing transactional engagement from the holder. For a deeper comparison of how gold and bond dynamics influence these financing models across economic cycles, the relationship between asset classes becomes even more instructive.
Why Fixed Costs Create a Scalability Advantage Unmatched in Traditional Mining
A royalty company managing 258 royalties with 14 employees could theoretically manage a portfolio ten times its current size without a proportional increase in overhead. This scalability is structurally impossible in traditional mining, where every new asset demands new machinery, new workforce, new permitting, and new infrastructure.
This operating leverage is the defining characteristic of the royalty model. As production volumes and gold prices rise, the revenue base expands while the cost base remains essentially static. For investors, this translates into an asymmetric payoff profile that conventional mining equities cannot replicate. Furthermore, physical gold vs ETFs each offer their own trade-offs, but neither delivers this kind of structural operating leverage.
What Does a Gold Royalty Company Actually Own?
Portfolio Architecture: Diversification Across the Production Lifecycle
The strength of a royalty portfolio lies in its diversity across the mining development spectrum. A well-constructed portfolio balances assets generating immediate cash flow with assets that offer medium-term growth potential and longer-dated optionality tied to exploration outcomes.
| Asset Category | Role in Portfolio | Risk Profile | Upside Mechanism |
|---|---|---|---|
| Producing mine royalties | Immediate cash flow | Low | Gold price leverage |
| Development-stage royalties | Near-term growth | Medium | Production ramp-up |
| Exploration-stage royalties | Long-term optionality | Higher | Discovery upside |
Foundational Assets vs. Optionality Assets
Gold Royalty Corp holds royalties in three of the five largest producing gold mines in North America, including Canadian Malartic, Cortez, and the underground extension of Gold Strike. These generational assets provide the revenue stability and institutional credibility that anchor the portfolio.
Layered on top of those foundational positions is a pipeline of more than 250 royalties spanning development and exploration-stage projects. This combination creates a risk-return profile where downside is cushioned by producing assets while the upside is amplified by the optionality embedded across a deep exploration pipeline. Understanding the mineral discovery curve helps illustrate precisely where the most asymmetric returns tend to emerge across the development lifecycle.
Is Gold in a Bull Market, or Just Base Building?
Decoding the $4,000/oz Resistance Zone
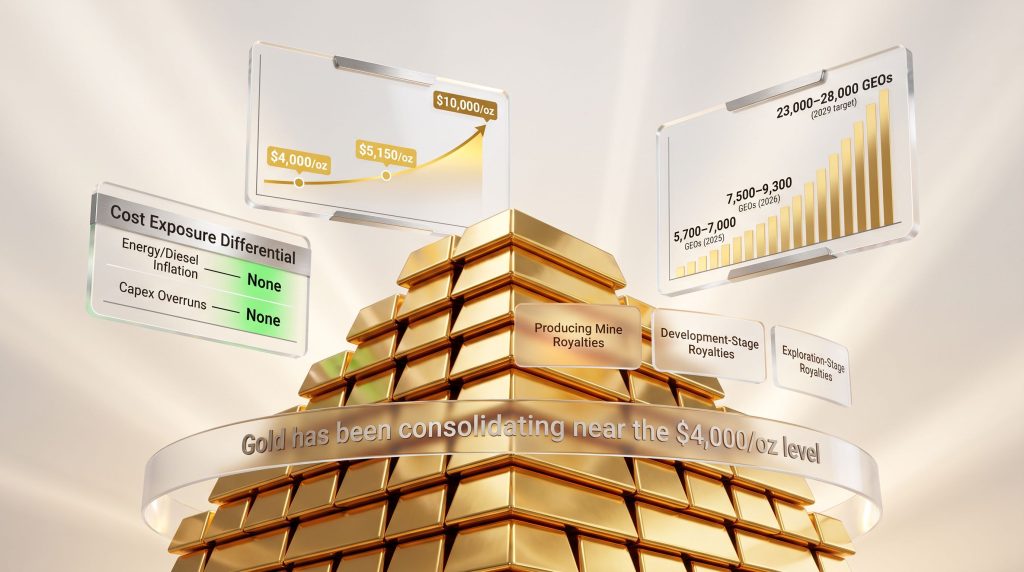
Gold has been consolidating near the $4,000 per ounce level for several months, with strong buying support preventing meaningful corrections below that threshold. Central bank gold buying has been a key driver of this price floor, with sovereign buyers treating gold as a strategic reserve asset rather than a speculative position.
The macro factors that drove gold to its current levels have not resolved. They include:
- Sovereign debt expansion across major economies
- Persistent fiscal deficits in the United States, compounded by elevated defence spending
- Ongoing monetary base expansion and fiat currency debasement
- Geopolitical instability functioning as a structurally embedded risk premium
Markets appeared to absorb the shock of escalating geopolitical tensions in early 2025, temporarily suppressing gold as a risk-off trade unwound. However, as geopolitical instability transitions from an acute shock to a chronic condition, the underlying monetary fundamentals reassert themselves as the dominant pricing driver.
Why Central Bank Accumulation Is Acting as a Structural Price Floor
Central bank accumulation has shifted from episodic to systematic over the past several years. Sovereign institutions, particularly those in emerging markets seeking to reduce dollar dependency, have been consistent buyers. This structural demand source does not respond to short-term price movements in the way that speculative traders do, which means it provides a durable support level beneath spot prices.
The Long End of the Bond Curve: The Metric Most Investors Are Ignoring
A steepening long-end yield curve signals that bond markets are pricing in elevated fiscal risk. Historically, this environment has preceded periods of gold outperformance as investors seek non-sovereign stores of value.
The US long bond market has experienced notable steepening in 2025, reflecting growing unease about the trajectory of federal debt servicing costs. When bond markets begin pricing in fiscal sustainability concerns, gold historically follows with a lag. The Federal Reserve's apparent willingness to accommodate expansionary monetary policy adds further weight to the bull case, as it constrains the real yield environment that would otherwise compete with gold for capital.
What Is the Gold Price Outlook for 2025 Through 2029?
A Spectrum of Scenarios
The gold price forecast involves a wide range of assumptions depending on the analytical framework applied. The table below captures the spectrum of scenarios circulating in institutional and independent analysis, according to data from Trading Economics and other market sources:
| Forecast Horizon | Price Assumption | Source Context |
|---|---|---|
| 2025 base case | ~$2,668/oz | Conservative institutional planning |
| Five-year outlook midpoint | ~$2,212/oz | Long-range operational modelling |
| 2026 scenario assumption | ~$5,150/oz | Elevated-price planning scenario |
| Analyst range (bullish) | $7,000–$8,000/oz | Sell-side and independent forecasts |
| Long-run speculative ceiling | ~$10,000/oz | Executive and macro commentator views |
What Would Drive Gold to $5,000/oz or Beyond?
A move toward $5,000 per ounce would likely require a combination of: accelerating US fiscal deterioration, a material weakening in the US dollar index, a policy pivot by the Federal Reserve toward renewed monetary accommodation, and continued or accelerating central bank accumulation. None of these conditions are implausible given current trajectories.
VanEck and other institutional commentators have published views suggesting that elevated gold prices could persist through 2028 and 2029, supported by structurally negative real yields and persistent geopolitical fragmentation. The speculative upper range of $10,000 per ounce reflects scenarios involving severe monetary disorder, and while not a base case, these views are gaining broader circulation among macro-oriented investors.
Near-Term Catalyst: The Second Half of 2025
The second half of 2025 is shaping up as a potentially pivotal period. Seasonal demand patterns, potential Federal Reserve signalling shifts, and continued central bank buying could combine to push gold through the current consolidation range. A sustained break above the $4,000/oz resistance zone would likely attract significant momentum-driven capital from institutional allocators who have been waiting for confirmation of the next directional leg.
How Does Inflation Risk Affect Gold Miners, and Why Royalty Companies Are Immune?
The Hidden Cost Trap in Producer Stocks
Gold mining is an extraordinarily energy-intensive industrial process. Diesel powers haul trucks, generators, and ventilation systems. Explosives, which are used extensively in open-pit and underground operations, contain significant oil-derived inputs. When energy prices rise, the cost structure of a conventional gold producer deteriorates rapidly, compressing the operating margins that generate the gold price leverage investors expect.
This is not a theoretical risk. Cost inflation has repeatedly surprised mining investors who assumed that a rising gold price would translate proportionally into rising earnings per share. In practice, energy cost spikes and labour market tightening frequently absorbed a substantial portion of the revenue windfall, leaving shareholders with far less leverage than anticipated.
The Royalty Shield Explained
| Cost Exposure | Traditional Gold Producer | Gold Royalty Company |
|---|---|---|
| Energy/diesel inflation | High | None |
| Labour cost increases | High | None |
| Capex overruns | High | None |
| Royalty revenue impact | Indirect | Direct (top-line %) |
| Quarterly fixed overhead | Variable and rising | Fixed (~$2M/qtr) |
Because royalty revenue is calculated as a percentage of gross mine revenue before any operating costs are deducted, the royalty company's income stream is completely insulated from mine-site cost inflation. Rising diesel prices, increasing explosive costs, and expanding labour expenses are borne entirely by the operating partner. The royalty holder receives its contractual share of top-line revenue regardless of what happens beneath it.
The next major ASX story will hit our subscribers first
What Is the Production Growth Outlook for Gold Royalty Companies?
Reading the Five-Year Curve
Gold Royalty Corp has published growth projections that illustrate the compounding effect of a diversified royalty portfolio entering production ramp-up across multiple assets simultaneously:
- 2025 forecast range: 5,700 to 7,000 Gold Equivalent Ounces (GEOs)
- 2026 forecast range: 7,500 to 9,300 GEOs (modelled at a $5,150/oz gold assumption)
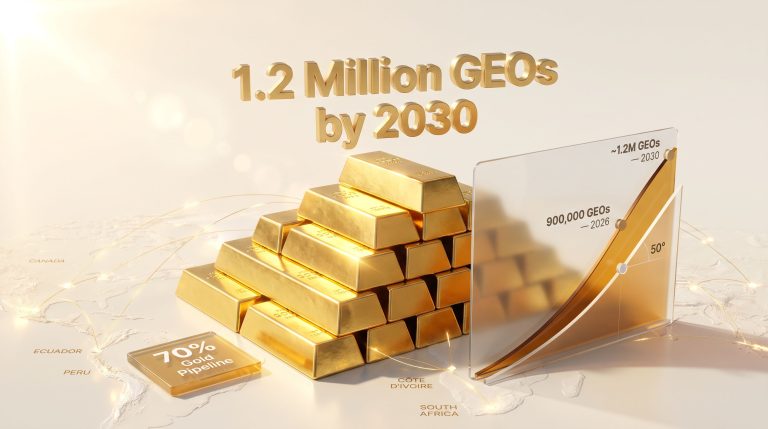
- 2029 target range: 23,000 to 28,000 GEOs, representing approximately 367% growth from the 2024 midpoint
- 2030 extended outlook: 28,000 to 34,000 GEOs from existing portfolio assets
Why Debt-Free Status Changes the Capital Return Equation
Operating without debt fundamentally alters the free cash flow dynamics of a royalty company. Without interest servicing obligations consuming revenue, every incremental dollar of production growth flows more directly toward potential capital returns. The company has indicated that it is actively evaluating shareholder return mechanisms, with an aim to implement a framework in the near term.
At fixed quarterly costs of approximately $2 million, even modest GEO production growth at elevated gold prices creates substantial free cash flow inflection. As production approaches the 2029 targets, the compounding of volume growth and gold price appreciation creates a scenario where the free cash flow yield relative to market capitalisation could become compelling for value-oriented institutional investors.
Why Junior Explorers Are Critical to the Long-Term Gold Supply Chain
The 40% Reserve Decline Since 2012
One of the least discussed structural risks in the gold sector is the prolonged decline in global reserves. Industry gold reserves have fallen approximately 40% from their 2012 peak, driven by more than a decade of capital starvation at the junior exploration level. Junior mining companies are responsible for the vast majority of grassroots discovery activity globally. Major producers, focused on optimising their existing asset bases, do not typically conduct the early-stage exploration that replenishes the industry's reserve base.
This creates a supply-side constraint that is invisible in the near term but increasingly consequential over a five-to-ten-year horizon. As existing mines approach the end of their productive lives without being replaced by equivalent new discoveries, the structural supply deficit will intensify, adding another fundamental support layer beneath gold prices.
Capital Markets Reopening for Junior Miners
After roughly 15 years of constrained access, junior exploration companies are selectively accessing capital markets again. This is significant for royalty companies because new exploration activity creates the deal flow from which future royalties are originated. A junior that discovers a significant deposit will eventually need capital to advance toward development, and royalty financing offers an attractive non-dilutive alternative to repeated equity raises.
The reopening of junior capital markets is therefore not competitive with the royalty model. It is, in fact, complementary. More exploration capital means more discovery activity, which consequently means a richer pipeline of future royalty opportunities.
How Should Investors Think About Gold Exposure in a Volatile Macro Environment?
A Framework for Comparing Gold Exposure Types
| Exposure Type | Gold Price Leverage | Inflation Risk | Operational Risk | Liquidity |
|---|---|---|---|---|
| Physical gold | 1:1 | None | None | Low-Medium |
| Gold ETFs | 1:1 | None | None | High |
| Gold producer equities | 2x–4x (theoretical) | High | High | High |
| Gold royalty companies | 2x–3x (structural) | None | Low | Medium-High |
Physical gold and ETFs provide direct price exposure without leverage. Producer equities theoretically offer amplified returns but carry significant operational and inflation risk that frequently erodes the expected leverage in practice. Royalty companies occupy a structurally superior position: they offer leverage to the gold price without the inflation exposure or operational complexity that undermines conventional mining equities.
Gold as Fiat Currency Insurance
In an era where central banks are structurally expanding money supply and fiscal authorities show no meaningful appetite for deficit reduction, gold functions as a form of monetary insurance rather than a speculative instrument. Holding gold, whether physically, through ETFs, or through leveraged royalty exposure, preserves purchasing power against the systematic debasement of paper currencies.
The expanding money supply dynamic is not unique to the United States. It is, however, a global phenomenon, which means the diversification benefit of gold operates across multiple currency regimes simultaneously. The broader gold royalty company and gold price outlook therefore reflects macro forces that transcend any single economy or policy cycle.
Frequently Asked Questions: Gold Royalty Companies and the Gold Price Outlook
What Is a Gold Royalty Company and How Does It Make Money?
A gold royalty company provides upfront capital to mining operators in exchange for contractual rights to receive a percentage of future mine revenue. It earns income passively, without conducting mining operations itself, and its revenue scales directly with both production volumes and the prevailing gold price.
How Does a Rising Gold Price Benefit a Royalty Company More Than a Miner?
Because royalty revenue is calculated on gross mine revenue rather than net profit, every dollar increase in the gold price flows almost entirely to the royalty holder's bottom line. For a conventional miner, rising costs frequently absorb a portion of any gold price increase, diluting the earnings benefit. The royalty company has no such cost absorption problem.
What Are the Biggest Risks Facing Gold Royalty Companies Right Now?
The primary risks include counterparty risk (the possibility that an operator fails to develop or maintain a royalty-bearing asset), exploration failure at optionality-stage assets, and gold price drawdown. Systemic market risk and regulatory changes affecting mining operations in specific jurisdictions also represent potential headwinds.
Is Now a Good Time to Invest in Gold or Gold Royalty Stocks?
This is not financial advice. Individual investment decisions should be based on personal financial circumstances, risk tolerance, and independent professional guidance. From a macro structural perspective, the conditions that have historically supported the gold royalty company and gold price outlook — including fiscal expansion, monetary base growth, geopolitical instability, and real yield suppression — remain intact as of mid-2025.
What Is the Difference Between a Gold Royalty and a Gold Stream?
A royalty is a passive right to receive a percentage of mine revenue, typically calculated on gross production value. A stream is a forward purchase agreement where the streaming company pays an agreed below-market price for a fixed percentage of future production. Both models eliminate operational exposure, but they differ in their contractual mechanics and risk profiles.
How Do Central Banks Influence the Gold Price?
Central banks influence gold prices primarily through their reserve allocation decisions. Sustained buying from sovereign institutions creates durable demand that absorbs supply and establishes price floors. Central bank policy also influences gold indirectly through interest rate settings, which determine the real yield environment that competes with gold for capital.
What Gold Price Is Needed for Royalty Companies to Significantly Grow Free Cash Flow?
Given fixed quarterly costs of approximately $2 million, meaningful free cash flow growth is achievable at any sustained gold price above current operational breakevens. The larger lever is production volume growth. As GEO production approaches the 2029 targets of 23,000 to 28,000 ounces, the combination of volume and elevated gold prices creates a compelling free cash flow trajectory without requiring gold to reach speculative price targets.
Key Takeaways: Gold Royalty Model Strengths in the Current Macro Environment
- Gold's structural support from fiscal deficits, monetary expansion, and persistent geopolitical instability remains firmly intact
- The royalty model eliminates inflation and operational risk entirely while preserving full leverage to gold price appreciation
- Fixed quarterly cost structures of approximately $2 million create exceptional operating leverage as revenue scales from volume growth
- Portfolio diversification across producing, developing, and exploration-stage royalties balances near-term income with long-term optionality
- Junior explorer capital access is improving after 15 years of constraint, expanding future royalty deal flow and discovery pipelines
- Production growth trajectories suggest meaningful free cash flow inflection approaching the 2029 to 2030 period
- Gold price forecasts range from conservative planning assumptions near current levels to speculative multi-thousand-dollar scenarios, with institutional consensus trending higher through 2028
Disclaimer: This article is intended for informational purposes only and does not constitute financial, investment, or legal advice. Gold price forecasts referenced herein reflect a range of third-party and institutional scenarios and should not be construed as predictions or guarantees of future performance. Readers should conduct their own due diligence and consult qualified financial professionals before making investment decisions. Past performance of gold or gold-related assets is not indicative of future results.
Want to Know When the Next Major ASX Mineral Discovery Hits the Market?
Discovery Alert's proprietary Discovery IQ model delivers real-time alerts on significant ASX mineral discoveries, instantly converting complex geological data into actionable investment insights — without the operational risks that burden conventional mining equities. Explore Discovery Alert's dedicated discoveries page to understand how historic mineral discoveries have generated substantial returns, and begin a 14-day free trial to position yourself ahead of the broader market.